
Mutual banks in Australia are facing continued change. With tighter margins, increased regulation, and higher member expectations, a growing number of organisations are looking to strategic mergers as a solution.
Our review shares the latest results from 2025 and explores what’s next for the sector, the impact of digital transformation and the buoyancy Mutual banks are showing in the current environment, demonstrated through:
- the sector’s resilience, despite economic uncertainty and cost-of-living pressures
- strong deposit growth, up 8.7% from 2024
- continued commitment to community and member support
- rising costs and evolving customer expectations testing traditional models.
To stay competitive, Mutual banks need to keep innovating and using AI, automation, and better data to streamline operations, connect with members, and build a sustainable future. Aligning purpose with progress will also allow Mutual banks to lead with trust and achieve long-term, sustainable growth.
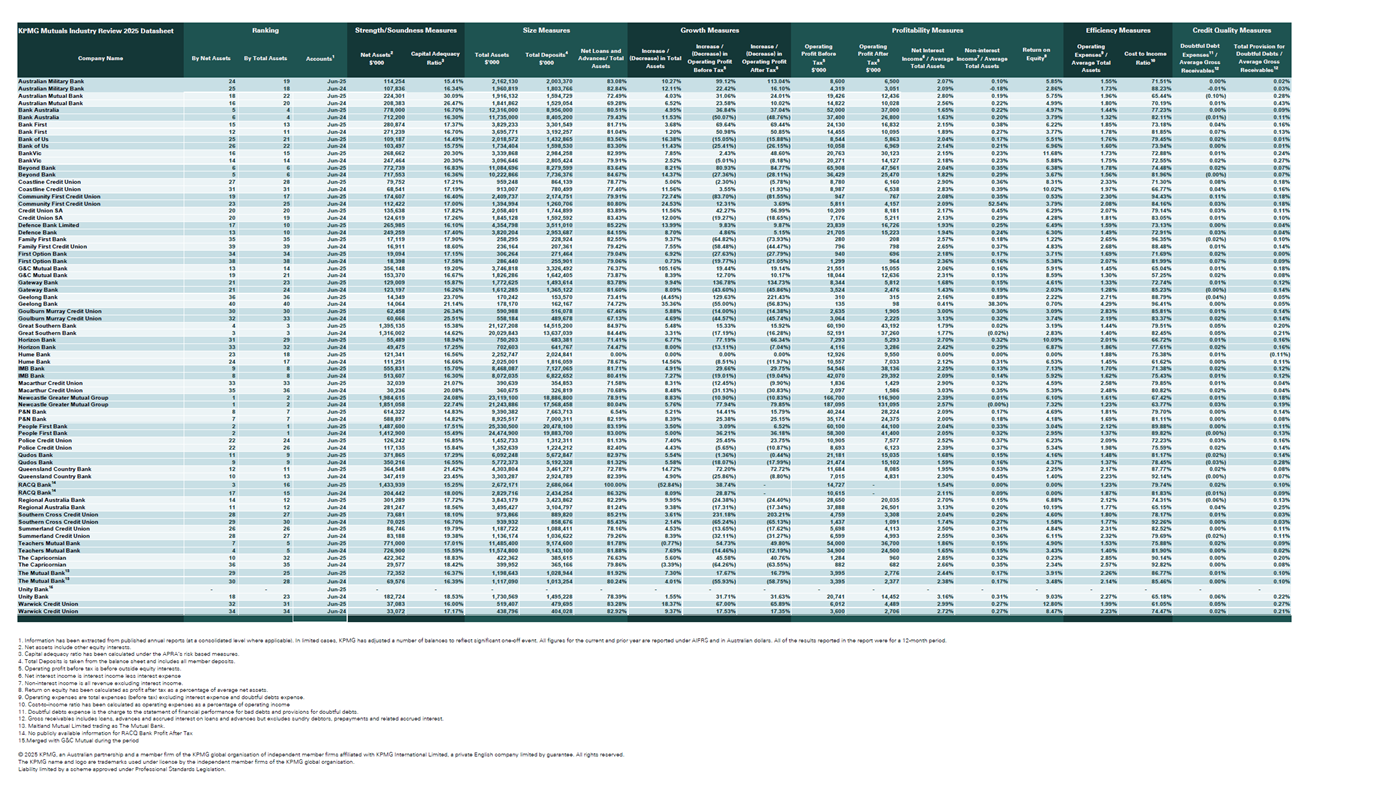
Australian Mutuals: financial results 2025
Key findings based on the 2025 financial results of 38 institutions in the mutual banking sector, when compared to 2024 data.
Mutual Industry Review 2025 survey: Key insights
Every year we ask leaders within Australia’s Mutual banks, building societies and credit unions to share their views on risks, challenges and opportunities within the customer-owned banking sector.
Customer-owned banks: focus areas
KPMG has identified six focus areas facing the Mutual banking sector in Australia.
Key industry metrics
- Net interest margin
- Cost to Income
- Profit before tax
- Total asset growth
- Loan provisioning
- Capital
Net interest margin (NIM)
The market has started to ease in 2025, with the continued decrease in the cash rate that commenced in calendar year 2024. The NIM for the top 10 Mutual banks decreased by 17bps to 1.97% (2024: 2.14%) compared to the broader Mutual banks group which saw a decrease of 25bps to 2.39% (2024: 2.64%). These decreases are mainly due to lower interest rates.
Net interest income (NII)
In 2025, the Mutual banks reported an increase in NII of 8.9% to $3.567 billion (2024: $3.275 billion), driven by the increase in lending/loans written and lower interest expense.
Cost to Income ratio (2021–2025)
Total reported operating costs for Mutual banks increased in 2025 by 9.6% to $3.015 billion (2024: $2.75 billion). The cost increases, primarily due to tech transformations, talent attraction and retention, have been largely offset by a number of management strategies across the sector resulting in only a small increase in the CTI from 76.83% in 2024 to 78.15% in 2025. The majority of survey respondents expected the cost to income ratio to improve by 2-5% over the next few years driven by a reduction in customer ‘points of friction’ and digital/automated workflow.
Personnel expenses continue to account for the majority of operating costs at $1.59 billion (2024: $1.45 billion). And, with continued low unemployment, the hunt for talent remains highly competitive and a key focus for Mutual banks.
Information technology and marketing were the next major cost. These increased to $391 million in 2025 (2024: $341 million). On average there was a 15% increase compared to 2024, reflecting continued investment in technology and digitisation.
Profit before tax
In 2025, profits before tax (PBT) for the Mutual banks increased by 14.5% (2024: 3.5%) to $844.1 million (2024: $737.1 million). This increase is due to a rise in non-interest income, and cost reduction/management strategies coupled with decreases/releases in expected credit loss provisions. The top 10 Mutual banks saw PBT increase by 13.5% (2024: 4.7%) which also increased by 17% for Mutual banks outside the top 10 (2024: 0.7% decrease).
Total asset growth
Total assets for the Mutuals increased in 2025 by 5.8% (2024: 10.98%) to $178.4 billion (2024: $168.6 billion) reflective of a competitive lending market that continues to be subject to declining housing affordability, uncertain economic conditions, interest rate pressure, high inflation, tariff uncertainty, digital disruption and an evolving regulatory and compliance landscape.
In 2025, the Australian economy faced continued inflationary challenges, resulting in significant cost-of-living pressures causing an increased number of households to face mortgage stress. The Mutual banks’ structure, ethical banking and member experience including focus on their communities are identified by our survey respondents as key contributors to remaining competitive within the broader banking industry.
The sector outlook remains positive in the face of ongoing market and economic uncertainty, with 79% of survey respondents revealing they feel confident in their three-year growth prospects (compared to 60% in 2024). Total asset growth across the sector was primarily driven by lending growth, with average growth of 5.8% for survey respondents, compared to the Majors who grew 8.8% (2024: 1.6%). The differing levels of asset growth achieved across the sector is reflective of varied strategies adopted by the Mutual banks in addressing market conditions.
Based on APRA data, the Mutual banks comprise 2.7% (2024: 2.7%) of total assets across all authorised deposit-taking institutions (ADIs) in Australia as at 30 June 2025. As customer-owned banks, the sector has a strong focus on supporting members in the current economic environment. 75% of survey responses see this differentiation as a competitive advantage and central to their purpose.
Asset quality
Asset quality has slightly improved during 2025 with the sector observing a provision for doubtful debts to gross receivables ratio of 0.12% in 2025 (2024: 0.13%). The prospect of inflation being outside the target range is expected to cause pressure on asset quality in the medium- to long-term.
Provisioning and asset quality
In addition to any specific provisions, accounting standards require the estimation of a forward-looking general provision called the ‘expected credit loss’ (ECL). In 2025, Mutual banks collectively observed a net decrease in provisions of $6.8 million.
We observed that collective impairment charges continue to be the most significant component of total provisions at approximately 93% at the end of 2025 (2024: 92 %).
Average capital adequacy ratio
The Mutual banks’ average capital adequacy ratio increased by 28bps to 18.31% (2024: 18.03%). Improved interest margins resulting from higher interest rates, combined with asset growth, has acted to stabilise and improve capital positions.
Download report

Watch: KPMG Mutuals Review webinar 2025
The Mutuals Industry Review webinar held on 27 November 2025 is KPMG Australia's annual deep-dive into the performance, challenges, and strategic direction of the customer-owned banking sector.
The KPMG Mutuals Insights Dashboard
The KPMG Mutuals Insights Dashboard contains interactive charts and graphs to accompany this report. Underpinned by publicly available financial data collected from the Mutual banks we surveyed, the dashboard enables you to filter key financial measures based on organisation and year.
Contact KPMG's mutual bank state leaders


- Item 1
- Item 2
- Item 3
- 4
- 6
- 7
Related services and industries


FAQs
The Mutual banking industry in Australia is made up of Australia’s Mutual banks, building societies and credit unions, and are collectively known as the Mutual banking sector. They are regulated by the Australian Prudential Regulation Authority (APRA).
KPMG’s Mutuals Industry review is an annual analysis of Australia’s Mutual banking sector, covering financial performance, strategic trends, digital transformation, and sector challenges, along with insights to help member-owned banks navigate change and support their communities.
Mutuals are merging to gain scale, investing in technology, streamlining operations, and focusing on cost management and resilience to meet rising regulatory demands and margin pressures.
Mutual banks are exploring AI and automation to improve efficiency, compliance, and member services, but efforts are often fragmented. Collaboration could accelerate adoption and deliver sector-wide benefits.
Mutual banks deepen member relationships through personalised products, digital engagement, loyalty-based offers, tailored communications, and community involvement, aiming to boost retention and satisfaction.
KPMG’s Mutuals Insights Dashboard examines the performance and trends of Australia’s Mutual banks, building societies and credit unions.
The dashboard contains interactive charts and graphs that are underpinned by publicly available financial data collected from the Mutual banks surveyed. Users can filter financial data based on preferences and analyse or benchmark the data of the Mutual banking industry participants for specific years or segments.
The top 10 mutual banks by total assets in Australia for 2025 are:
|
Mutuals Industry Review 2025 Interactive Dashboard
Please complete the form to receive access to the Mutuals Industry Review 2025 interactive dashboard.