Headline masks stronger imports
Deficit likely to grow in March.
April 2, 2026
The US trade deficit expanded 4.9% in February to $57.3 billion. Much of the trade conducted during the month of February happened prior to the Supreme Court decision on February 20 overturning emergency tariffs. The AI boom has kept imports afloat.
We expect importers will take advantage of the lower effective tariff rate of under 10% with Section 122 tariffs to stock up. However, the surge in shipping costs due to the war is colliding with those efforts going forward.
Exports increased 4.2% in February while imports rose 4.3%. The trade deficit is down 54.8% from a year ago when importers were scrambling to stock up ahead of Liberation Day.
The headline change in the deficit does not account for shifts in the dollar or trade in gold. We adjust those headline changes for the purposes of GDP calculation. After adjusting for inflation, the real goods deficit increased by less than the headline change: 0.6%.
The softening of the trade deficit due to price changes is swamped by the changes in the gold trade for investment purposes. Exports of nonmonetary gold accounted for $8 billion of the total $11.5 billion increase in exports. Meanwhile, imports were approximately $300 million higher after accounting for gold. After taking out nonmonetary gold, the trade deficit expanded by much more than the headline implies, about 12.1%.
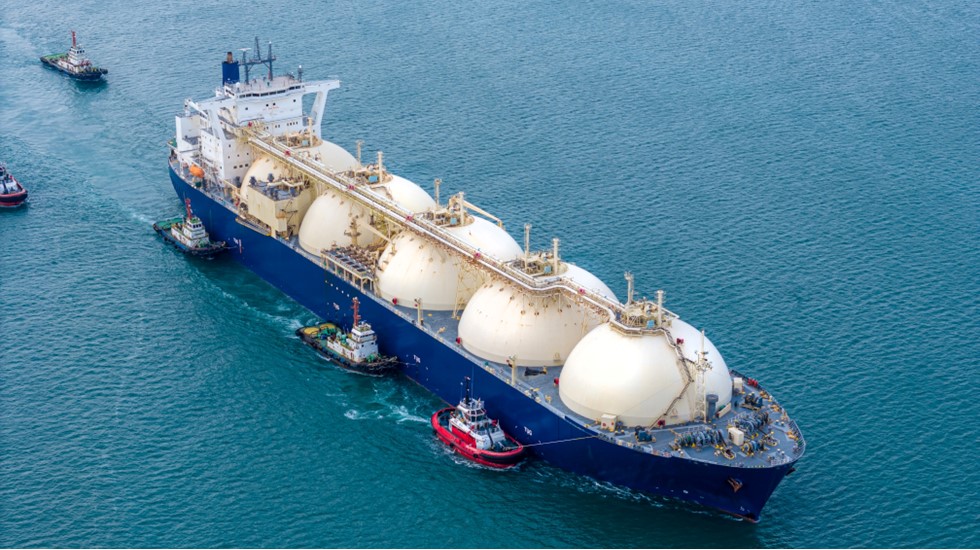
Imports excluding gold increased by $14.3 billion in February. High-tech goods needed for the AI data center buildout, largely exempted from tariffs, drove nearly $8 billion of that increase. Capital goods jumped on a $5.4 billion increase in computers, a $1.5 billion increase in computer accessories and a $1.2 billion increase in semiconductors. Imports of capital goods were followed by industrial supplies, up $3.1 billion. About $1.1 billion of that was crude oil; the remainder was broad-based across industrial materials. Imports of services also increased, up $1.3 billion, mainly on charges for the use of intellectual property.
Consumer-related imports showed weaker gains. Consumer goods overall rose $2.2 billion. About $1 billion of that increase was pharmaceutical. We continued to see strength in higher-end imports like artwork, jewelry and coins. The only major decline showed up in apparel, down $257 million. Automotives increased $1.6 billion with $1.1 billion of that in trucks and buses. Many foreign producers have an advantage over domestic producers given tariffs on inputs at home. We saw smaller increases in auto parts and engines and very small declines in passenger cars and tires. Imports of food fell -$65 million.
Exports increased only $3.5 billion after accounting for nonmonetary gold. Consumer goods exports made up the bulk of that increase, adding $2.9 billion. Pharmaceutical preparations, up $1.6 billion, drove consumer goods gains. We saw a $1.4 billion increase in exports of automotives and parts that was fairly broad-based. Industrial supplies increased $2.2 billion on exports of natural gas and petroleum-related products. Exports of services increased $1.1 billion, spread out across travel, business services, financial services and intellectual property charges.
Exports of certain categories showed declines. Capital goods exports declined -$720 million, against the trend from the end of the year and into January. Computers declined -$3.2 billion alone while civilian aircraft fell -$1.2 billion. Increases in semiconductors, up $1.6 billion, provided an offset. Exports of food declined -$227 million, mainly on corn and meat.
After some volatility toward the end of the year and into January, February restored some of the trends from last year by country of origin. Trade with Europe is still largely driven by the swings in nonmonetary gold. We posted a larger surplus with the Euro area in February but Switzerland (where much of the trade in gold originates) accounted for nearly all of the jump. We recorded smaller deficits with China, Canada and a few Pacific Rim countries along with larger surpluses with Hong Kong and Singapore. The trade deficit was essentially flat with South/Central America, Africa and India.
The larger deficit was mainly driven by countries with lower tariff rates, advantageous exchange rates or third countries that have been deemed less risky for trade overall. For instance, we showed larger deficits in the month of February with Mexico, South Korea, Malaysia and Taiwan.
The Supreme Court ruling... has opened yet another window for a front-running wave in imports.

Meagan Schoenberger
KPMG Senior Economist
Bottom Line
We expected the trade deficit to expand in February given some of the high-frequency supply chain data we saw going into the month. The Supreme Court ruling that the emergency powers the administration used to levy 60% of its tariffs are illegal has opened yet another window for a front-running wave in imports. That means the expansion of the deficit is likely to continue in March and into the second quarter, though the war in Iran could slow buying activity beyond our earlier estimate.
Tailwinds for trade in 2026 include the AI data center buildout buoying import activity, that could be partially offset by dampened demand from higher oil prices. Meanwhile, higher costs for exports could dampen demand in a global economy that is much more exposed to higher oil prices via energy dependence than the United States.
Explore more


Subscribe to insights from KPMG Economics
KPMG Economics distributes a wide selection of insight and analysis to help businesses make informed decisions.
Meet our team