AI’s hidden costs

AI’s building boom squeezes skilled labor pipeline.

November 3, 2026

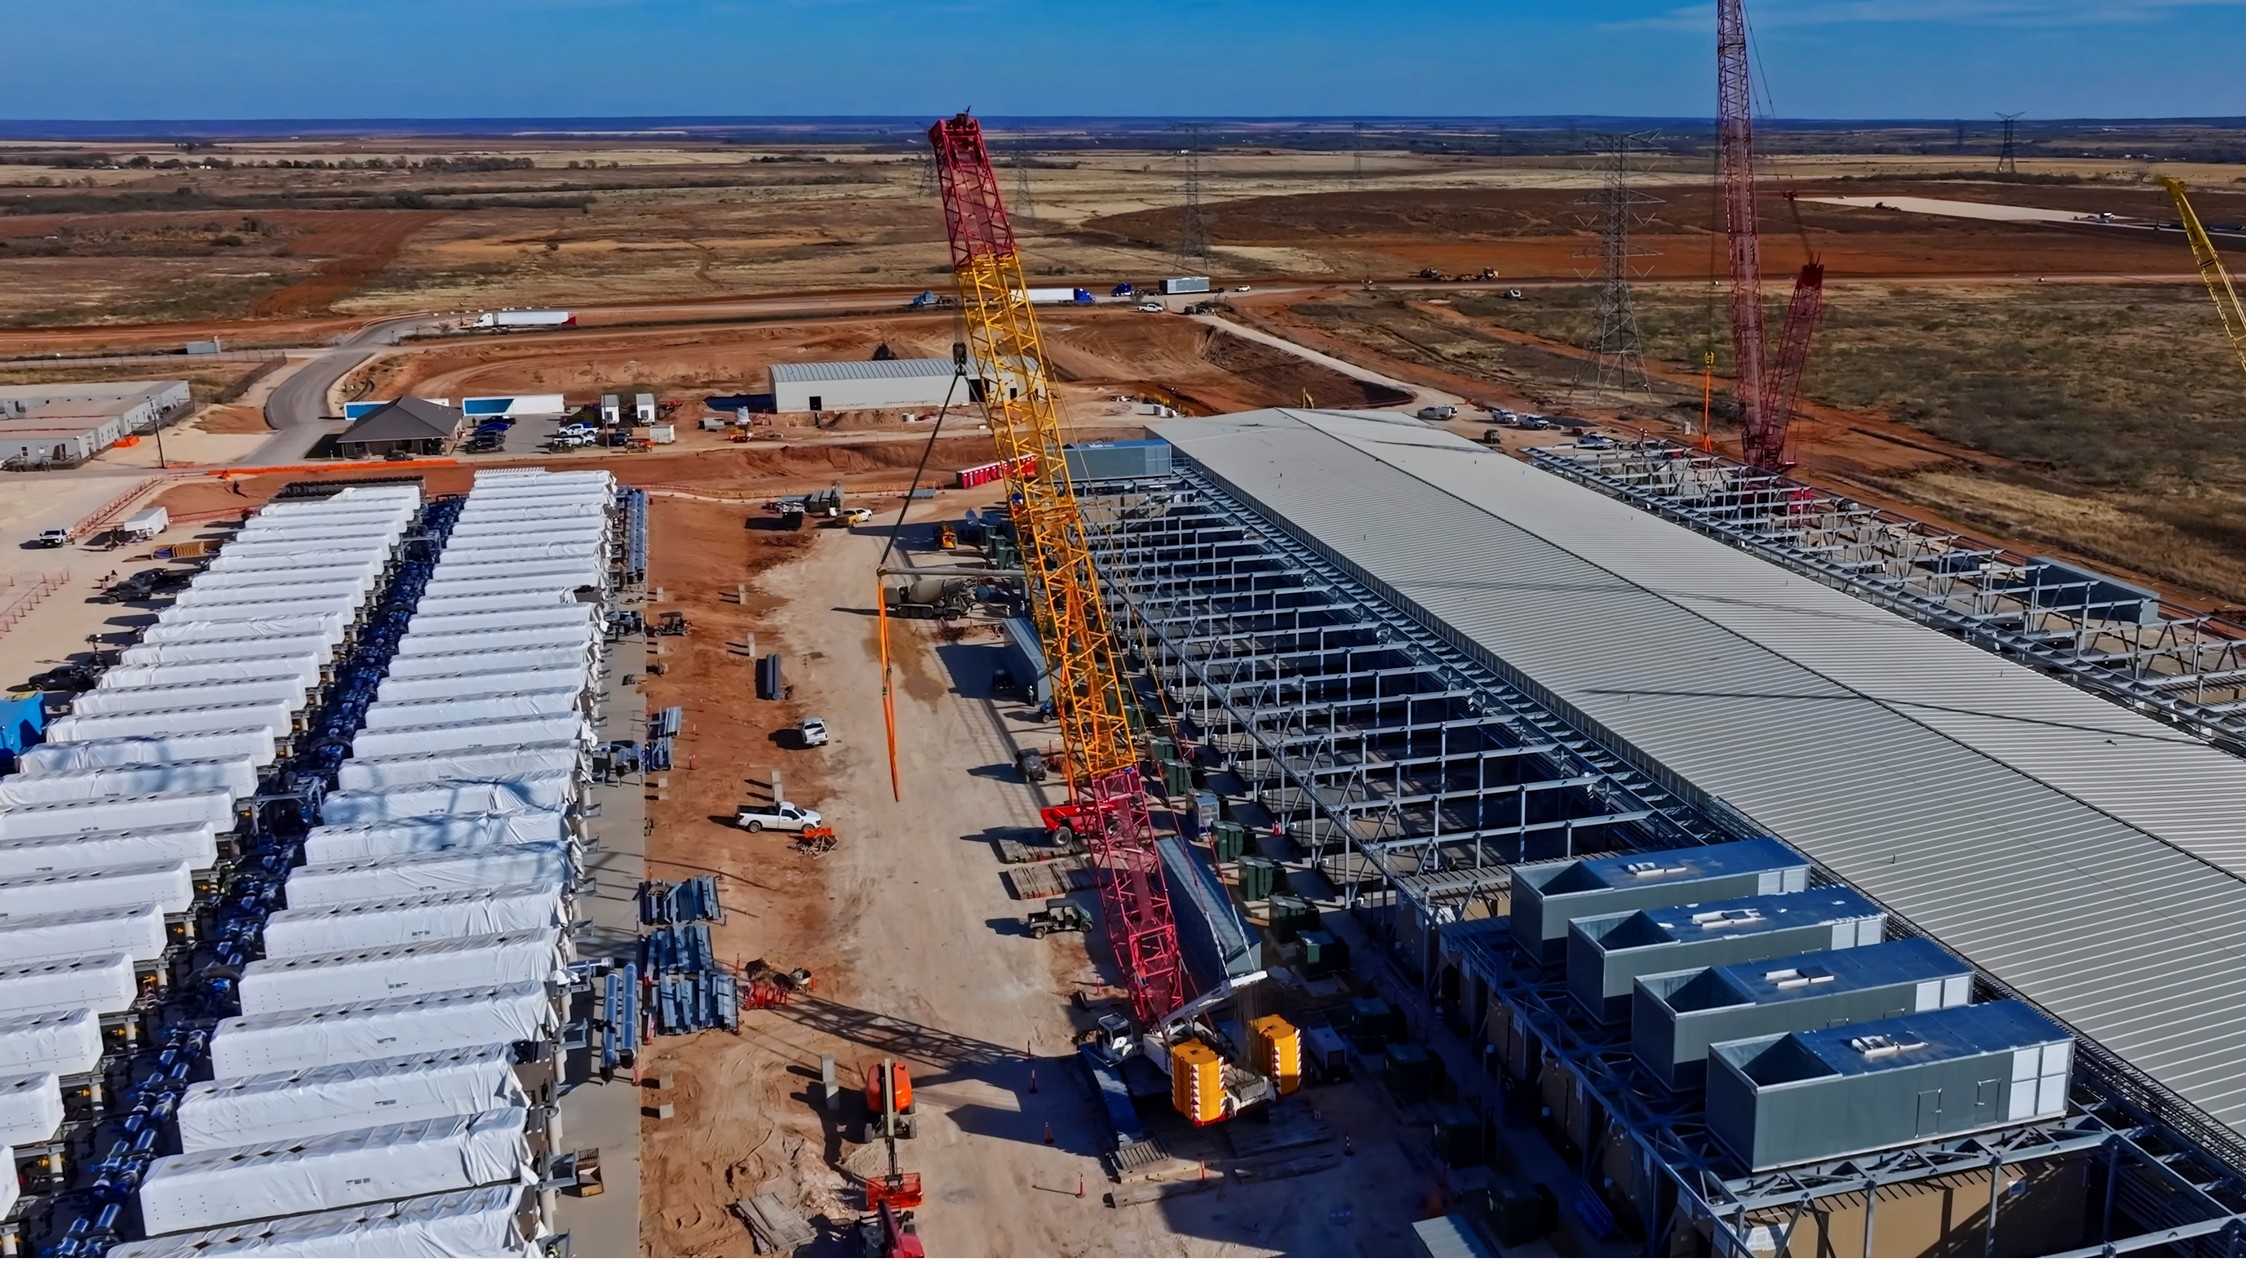
The bills for the AI buildout are arriving before its productivity gains can help cover them. This first piece in a series on data center construction costs focuses on competition for skilled workers. Data centers need the same electricians, plumbers and cooling specialists who help build homes. In the twelve states with the most data center construction, weekly pay in those trades is growing faster than pay in homebuilding. For homebuilders, more competition for workers and higher material costs make homes more expensive to build.

Distortions of local labor markets

November 3, 2026

The AI boom is driving a surge in data center construction. Most discussions focus on access to capital, power and land, but finding skilled workers is a major challenge. Building a data center is largely an electrical and mechanical project. Electrical, plumbing, mechanical and cooling systems account for most of the cost.1 The electricians, pipe fitters and cooling specialists who install these systems are also needed for homebuilding, manufacturing, utilities and other infrastructure.

There are not enough of those specialized workers to meet the surge in demand generated by data center construction, let alone other major projects. Foreign-born workers play an outsized role in construction.2 A sharp drop in immigration amidst stricter enforcement has further reduced the ranks of those workers in recent years. 

Data center developers tend to have deep pockets and thus far, are less sensitive to higher interest rates and escalating costs than other real estate developers. They can pay to lock in the crews they need years in advance, which adds to the margin pressure other real estate developers and builders are seeing due to rising costs via tariffs, energy prices and chip shortages. 

National pay data show the broader pressure. Pay at nonresidential electrical contractors, which wire data centers, factories and offices, rose 6.7 percent in the year to the first quarter of 2026, compared with 2.6 percent at residential electrical contractors. Averaged over the past year, the pay-growth gap was the widest since at least 2000.

Methodology

This analysis uses the Quarterly Census of Employment and Wages (QCEW), which covers nearly every employer in the country. It provides a snapshot of pay and jobs by state and industry. The focus is on building equipment contractors, or the firms that install electrical, plumbing, heating and cooling systems; they employ electricians, plumbers, pipe fitters and heating and cooling installers. Those are the trades where worker shortages are now common. They are compared with residential builders in the same state. The data run from 2000 through the first quarter of 2026, the most recent available.

Measuring exposure

Each state’s exposure is measured by the number of data centers under construction, as of June 2026. Aterio tracks 789 facilities under construction across 38 states. The analysis counts projects that have broken ground rather than those announced. 

The analysis counts facilities rather than megawatts because each site needs electrical, plumbing and cooling contractors. The count measures how many data center projects are under construction in each state, not how many workers or crews they require. It is a snapshot of where construction stood in mid-2026, not when each project broke ground.

The twelve states with the most facilities under construction make up the “high-exposure” group, which are outlined in red. (See Chart 1.) Together, those states alone account for nearly 80 percent of the facilities under construction. The remaining 38 states and the District of Columbia make up the low-exposure group. Alternative rankings by megawatts and other cutoffs give similar results. (See appendix.)

Chart 1: Data center construction is concentrated in a dozen states

Number of data center facilities under construction, by state, June 2026

Source: KPMG Economics analysis of Aterio US Data Centers Dashboard, facilities at the Construction stage, vintage June 2026.

How the comparison works

The analysis builds the comparison in three steps:

  1. Trades versus homebuilders. Within each state, we subtract pay growth for homebuilders from pay growth for the building equipment trades. The result is the gap in pay growth.
  2. Busiest data center states versus the rest. We compare that gap in the twelve high-exposure states with the gap in the rest of the country.
  3. Since 2022 versus the 2010s. We compare how the gap has behaved since 2022 with the decade before the pandemic, 2010 to 2019.

Comparing trades with homebuilders in the same state helps account for shared pressures from population growth, building booms and living costs. Comparing with the 2010s helps account for longstanding state differences. The remaining gap points to pressure on trades that data centers, chip plants and battery plants compete for.

Two checks support a link to the data center buildout. First, the pay-growth gap followed similar trends in both groups of states during the 2010s, then diverged in mid-2024 as construction accelerated. (See Chart 2.) Second, the estimate exceeded 99 percent of results from 20,000 random groupings of twelve states. The same test found no effect before the buildout. Details are in the appendix.

Chart 2: Today's wage gap differs from housing bust

Wage growth gap btwn equipment trades and home builders, percentage points, yr/yr, 4-qtr avg

Source: KPMG Economics analysis of BLS data

Where pay pressure is showing up

In the states with the most data center construction, pay for electricians, plumbers and other equipment trades is growing faster than pay for homebuilders. Since 2022, that pay-growth gap has widened by an additional 1.4 percentage points a year in the twelve high-exposure states, compared with the rest of the country and measured against the 2010s. It is not a fixed annual raise.

The extra widening reaches 2.5 percentage points a year in the five states with the most construction. It stays around 1.2 to 1.6 points as the group expands to include nearly every state with construction under way. (See Chart 3.)

The recent pay increases are substantial. From early 2024 to early 2026, weekly pay in equipment trades in high-exposure states rose nearly 7 percent a year, compared with about 4 percent across all industries nationwide.

Weekly pay reflects hours and overtime as well as pay rates. Hiring less-experienced workers and crews crossing state lines can make the measured gap look smaller.

Chip plants and other advanced factories draw on the same trades in some of the same states. Leaving out the seven states with major chip plant construction lowers the estimate to 1.1 points, which remains statistically significant. Excluding a separate group of five states with large chip and clean energy projects lowers it to 0.7 points, which is no longer significant. Some pressure likely reflects the broader buildout of advanced facilities, not data centers alone.

This is not a repeat of the 2007 to 2009 housing bust. The pay-growth gap was just as wide then, but homebuilders’ pay collapsed while pay in the equipment trades held flat. (See Chart 4.) 

From 2022 to early 2026, faster pay growth in trades and slower growth in homebuilding each account for roughly half of the extra widening in the high-exposure states. Since the start of 2025, faster equipment-trade pay growth accounts for about 60 percent. Compared with the same trades in the rest of the country, equipment-trade pay growth in the high-exposure states is now further ahead than at any time since at least 2000; it is nearly double the previous high in 2005 on a four-quarter average.

Data from Indeed’s Hiring Lab underscore the wage pressures. Data center postings have roughly tripled as a share of US job postings since mid-2023, to about 6 in every 1,000, despite a drop in overall postings. Hourly data center installation and maintenance jobs advertise median pay about 42 percent higher than comparable jobs elsewhere – roughly $10 more an hour.

Employment shows a similar pattern: since the first quarter of 2022, jobs in the building equipment trades have grown about 23 percent in high-exposure states, compared with 13 percent in low-exposure states. (See Chart 5.)

The gains extend beyond the construction site: the larger payroll comes from building and supplying data centers, not running them. A finished data center employs about 50 workers for every 250,000 square feet. In Virginia, construction accounts for about 80 percent of the jobs tied to the industry, with thousands more at suppliers, including factories making cooling systems, switchgear and transformers.3 

Chart 3: The tighter the definition of exposure, the bigger the wage effect

Extra annual wage growth in high-exposure states (percentage points)

Source: KPMG Economics analysis of BLS data

Chart 4: Equipment trades wages pulling ahead of home builder wages

Wage growth, high minus low exposure states, percentage points, 4-qtr avg

Source: KPMG Economics analysis of BLS data

Chart 5: Employment growth since Q1 2022

Percent change

Source: KPMG Economics analysis of BLS data

Evidence of crowding out

Where data center construction is most concentrated, projects with less pricing power are more likely to be delayed, downsized or abandoned. That can mean lost investment in housing, factories and equipment upgrades. In a recent contractor survey, more than half of firms reported a non-data-center project canceled, postponed or scaled back over the past six months. The most cited reason for all project delays was worker shortages.4

Nonresidential building accounts for all net gains in construction jobs over the past year, while residential construction is still shedding jobs. (See Chart 6.) Weak housing demand explains much of the slide in residential construction jobs; another portion is the costs that data center construction is adding to materials and labor.

What past booms tell us

Crowding out usually refers to heavy borrowing that raises the cost of capital for everyone else. A boom can also absorb workers and resources. That is what economists have dubbed the “resource movement” effect.5 

Australia’s mining boom in the 2000s is a useful modern parallel. Mining companies raised pay to attract workers, and other industries lost ground as costs rose. When the investment phase ended, homebuilding absorbed some of the workers laid off from mining projects.6 The squeeze eased as the investment ended.

The US shale boom offers a caution. Local incomes rose well beyond the drilling sites,7 but manufacturing overall was not crowded out. Only factories selling into national markets, likely unable to pass on higher costs, shrank.8 Our view is that vulnerability today extends to homebuilders and many public infrastructure projects. 

When stricter immigration enforcement shrank the construction workforce between 2008 and 2013, affected counties built fewer homes. Quality-adjusted prices of new homes rose 12 to 17 percent within three years, depending on the sample, while construction wages did not rise.9  

The moral of the story: homebuilders built fewer homes and sold them for more rather than raise pay to replace workers. The drought in homebuilding had spillover effects, which are showing up as fewer skilled trades people today; people who would have been trained on residential construction sites were not.

Chart 6: Nonresidential only source of construction job growth

Change in number of payrolls, year/year, thousands

Source: KPMG Economics analysis of BLS data

Data center developers can outbid other employers for skilled trades and lock in crews in advance.

photo of Yelena Maleyev

Yelena Maleyev

KPMG Senior Economist

Bottom Line

The AI buildout’s costs are arriving before its productivity gains. Data center developers can outbid other employers for skilled trades and lock in crews in advance. Homebuilders are falling further behind on pay in the busiest states, with chip plants adding to that pressure. That is early evidence of crowding out. Higher pay benefits the affected workers, but the competition is raising costs and delaying much-needed investments in housing, factories and public infrastructure.

The wage data end in early 2026. Data center construction has accelerated since, so the measured pressure only captures the buildout’s early stage. AI’s promise lies ahead. The competition for workers, and the bill associated with it, is already here. 

Technical appendix

Measuring exposure by megawatts

States rank in almost the same order whether measured by facilities or by megawatts: the rank correlation is 0.95 across all states and 0.88 across the 38 with construction under way, where 1 would mean identical rankings. Ten of the twelve high-exposure states make the list either way. Louisiana and Pennsylvania move in because they are building a few very large campuses: 13 facilities each, totaling 2.76 and 1.86 gigawatts. Iowa and Illinois drop out because they are building more, smaller ones: 15 and 22 facilities, totaling 1.24 and 0.89 gigawatts. Using the megawatt ranking, the estimate is 1.8 percentage points a year instead of 1.4.

Estimates and statistical tests

Wages are QCEW average weekly wages by state for building equipment contractors (NAICS 2382) and residential building construction (NAICS 2361), converted to year-over-year growth rates. They measure pay per worker, so they reflect hours, overtime and the mix of workers as well as pay rates. Two of these features could pull the measured gap toward zero: rapid hiring of less experienced workers holds down average pay, and crews who cross state lines blur which state their wages are counted in.  

For each state, we take the gap between equipment and residential wage growth, average it over the pre-period (2010Q1 to 2019Q4) and the post-period (2022Q2 to 2026Q1), and take the change. Group results are simple averages across states, not weighted by employment.

Relative to the 2010s, the gap widened by an average of 2.55 percentage points a year in the 12 high-exposure states and 1.14 points in the 38 low-exposure states and the District of Columbia. The difference, 1.41 points, is the headline estimate.

We measure from 2022 rather than from 2024, when the gap visibly widened, so the start date isn’t chosen after looking at the results. Starting in 2024 would raise the estimate to 2.3 points. Exposure is based on where data centers were under construction in June 2026, applied to the whole period, because earlier state-by-state data are not available.

Three checks support the result. Timing: over the decade before the pandemic, the gap averaged just 0.1 point lower in the high-exposure states, essentially zero and the two groups separated only from mid-2024. Luck: we picked 12 states at random 20,000 times and redid the calculation; only about 1 in 70 random picks produced a gap as large as the real one (two-sided p-value of 0.014). Placebo: rerunning the analysis on the 2010s and pretending the buildout began in 2015 finds no effect (-0.2 point), so the method isn’t simply picking up states that were already drifting apart. The result is statistically significant at every cutoff in Table 1, and the placebo is not significant at any. 

Because any single dividing line is a judgment call, the analysis is repeated at every cutoff from the five most exposed states to nearly every state with construction under way (Table 1). The estimate is largest at five states, 2.5 points a year, and holds between about 1.2 and 1.6 points as the group broadens.

Appendix: Sensitivity of the estimate to the exposure cutoff

Footnote

  1. Turner & Townsend, Data Centre Construction Cost Index 2025–2026: electrical systems account for 48 to 54 percent of construction costs and mechanical systems 22 to 33 percent. See also Cushman & Wakefield, 2026 Data Center Development Cost Guide, September 2026.
  2. National Association of Home Builders, “Which States and Construction Trades Depend the Most on Immigrant Workers,” Eye on Housing, April 2026. Immigrants made up a record 26.3 percent of the construction workforce in 2024, compared with 19.1 percent of the overall civilian labor force (Bureau of Labor Statistics, Labor Force Characteristics of Foreign-born Workers, 2025, May 19, 2026).
  3. Joint Legislative Audit and Review Commission, Data Centers in Virginia, Report 598, December 9, 2024. JLARC estimates the industry supports about 74,000 jobs in Virginia, including roughly 59,000 tied to construction and 24,000 in supporting sectors such as materials suppliers. Direct operations employment is about 4,400. A typical 250,000-square-foot data center has about 50 full-time workers, about half of them contractors.
  4. Associated General Contractors of America and NCCER, 2026 Workforce Survey, September 3, 2026. 1,830 respondents, surveyed in July and August 2026. 55 percent of respondents reported a non-data-center project canceled, postponed or scaled back in the prior six months, most often because of rising costs (34 percent) or financing (27 percent). Among firms doing data center work, 58 percent reported increased competition for skilled workers and 49 percent increased wage pressure. Shortages of their own or subcontractors’ workers were the most cited cause of project delays (42 percent.)
  5. W. Max Corden and J. Peter Neary, “Booming Sector and De-industrialisation in a Small Open Economy,” Economic Journal 92, no. 368 (1982): 825–848.
  6. Kathryn Davis, Martin McCarthy and Jonathan Bridges, “The Labour Market during and after the Terms of Trade Boom,” Reserve Bank of Australia Bulletin, March Quarter 2016.
  7. James Feyrer, Erin T. Mansur and Bruce Sacerdote, “Geographic Dispersion of Economic Shocks: Evidence from the Fracking Revolution,” American Economic Review 107, no. 4 (2017): 1313–1334.
  8. Hunt Allcott and Daniel Keniston, “Dutch Disease or Agglomeration? The Local Economic Effects of Natural Resource Booms in Modern America,” Review of Economic Studies 85, no. 2 (2018): 695–731.
  9. Troup Howard, Mengqi Wang and Dayin Zhang, “How Do Labor Shortages Affect Residential Construction and Housing Affordability?” working paper, 2024.

Subscribe to insights from KPMG Economics

KPMG Economics distributes a wide selection of insight and analysis to help businesses make informed decisions.

Meet our team

Image of Yelena Maleyev
Yelena Maleyev
Senior Economist, KPMG Economics, KPMG US

Thank you

Thank you for subscribing. You should receive a confirmation e-mail soon.

Subscribe to insights from KPMG Economics

Now more than ever, companies are using data to make informed decisions about the future of their business. KPMG Economics is continuously monitoring and analyzing economic and geopolitical data so we can provide business leaders with reliable and timely insight and analysis.

To receive our Economic Updates and other relevant content published by the KPMG Economics as soon as it is released, please provide the following details:
All fields with an asterisk (*) are required.
Please check at least one checkbox.

By submitting, you agree that KPMG LLP may process any personal information you provide pursuant to KPMG LLP's . Privacy Statement

An error occurred.

Thank you!

Thank you for contacting KPMG. We will respond to you as soon as possible.

Contact KPMG

Use this form to submit general inquiries to KPMG. We will respond to you as soon as possible.
All fields with an asterisk (*) are required.

Job seekers

Visit our careers section or search our jobs database.

Submit RFP

Use the RFP submission form to detail the services KPMG can help assist you with.

Office locations

International hotline

You can confidentially report concerns to the KPMG International hotline

Press contacts

Do you need to speak with our Press Office? Here's how to get in touch.

Headline