
It was the best of times, it was the worst of times
November 9, 2026
“It was the best of times, it was the worst of times, it was the age of wisdom, it was the age of foolishness, it was the epoch of belief, it was the epoch of incredulity, it was the season of Light, it was the season of Darkness, it was the spring of hope, it was the winter of despair.”
- Charles Dickens, A Tale of Two Cities
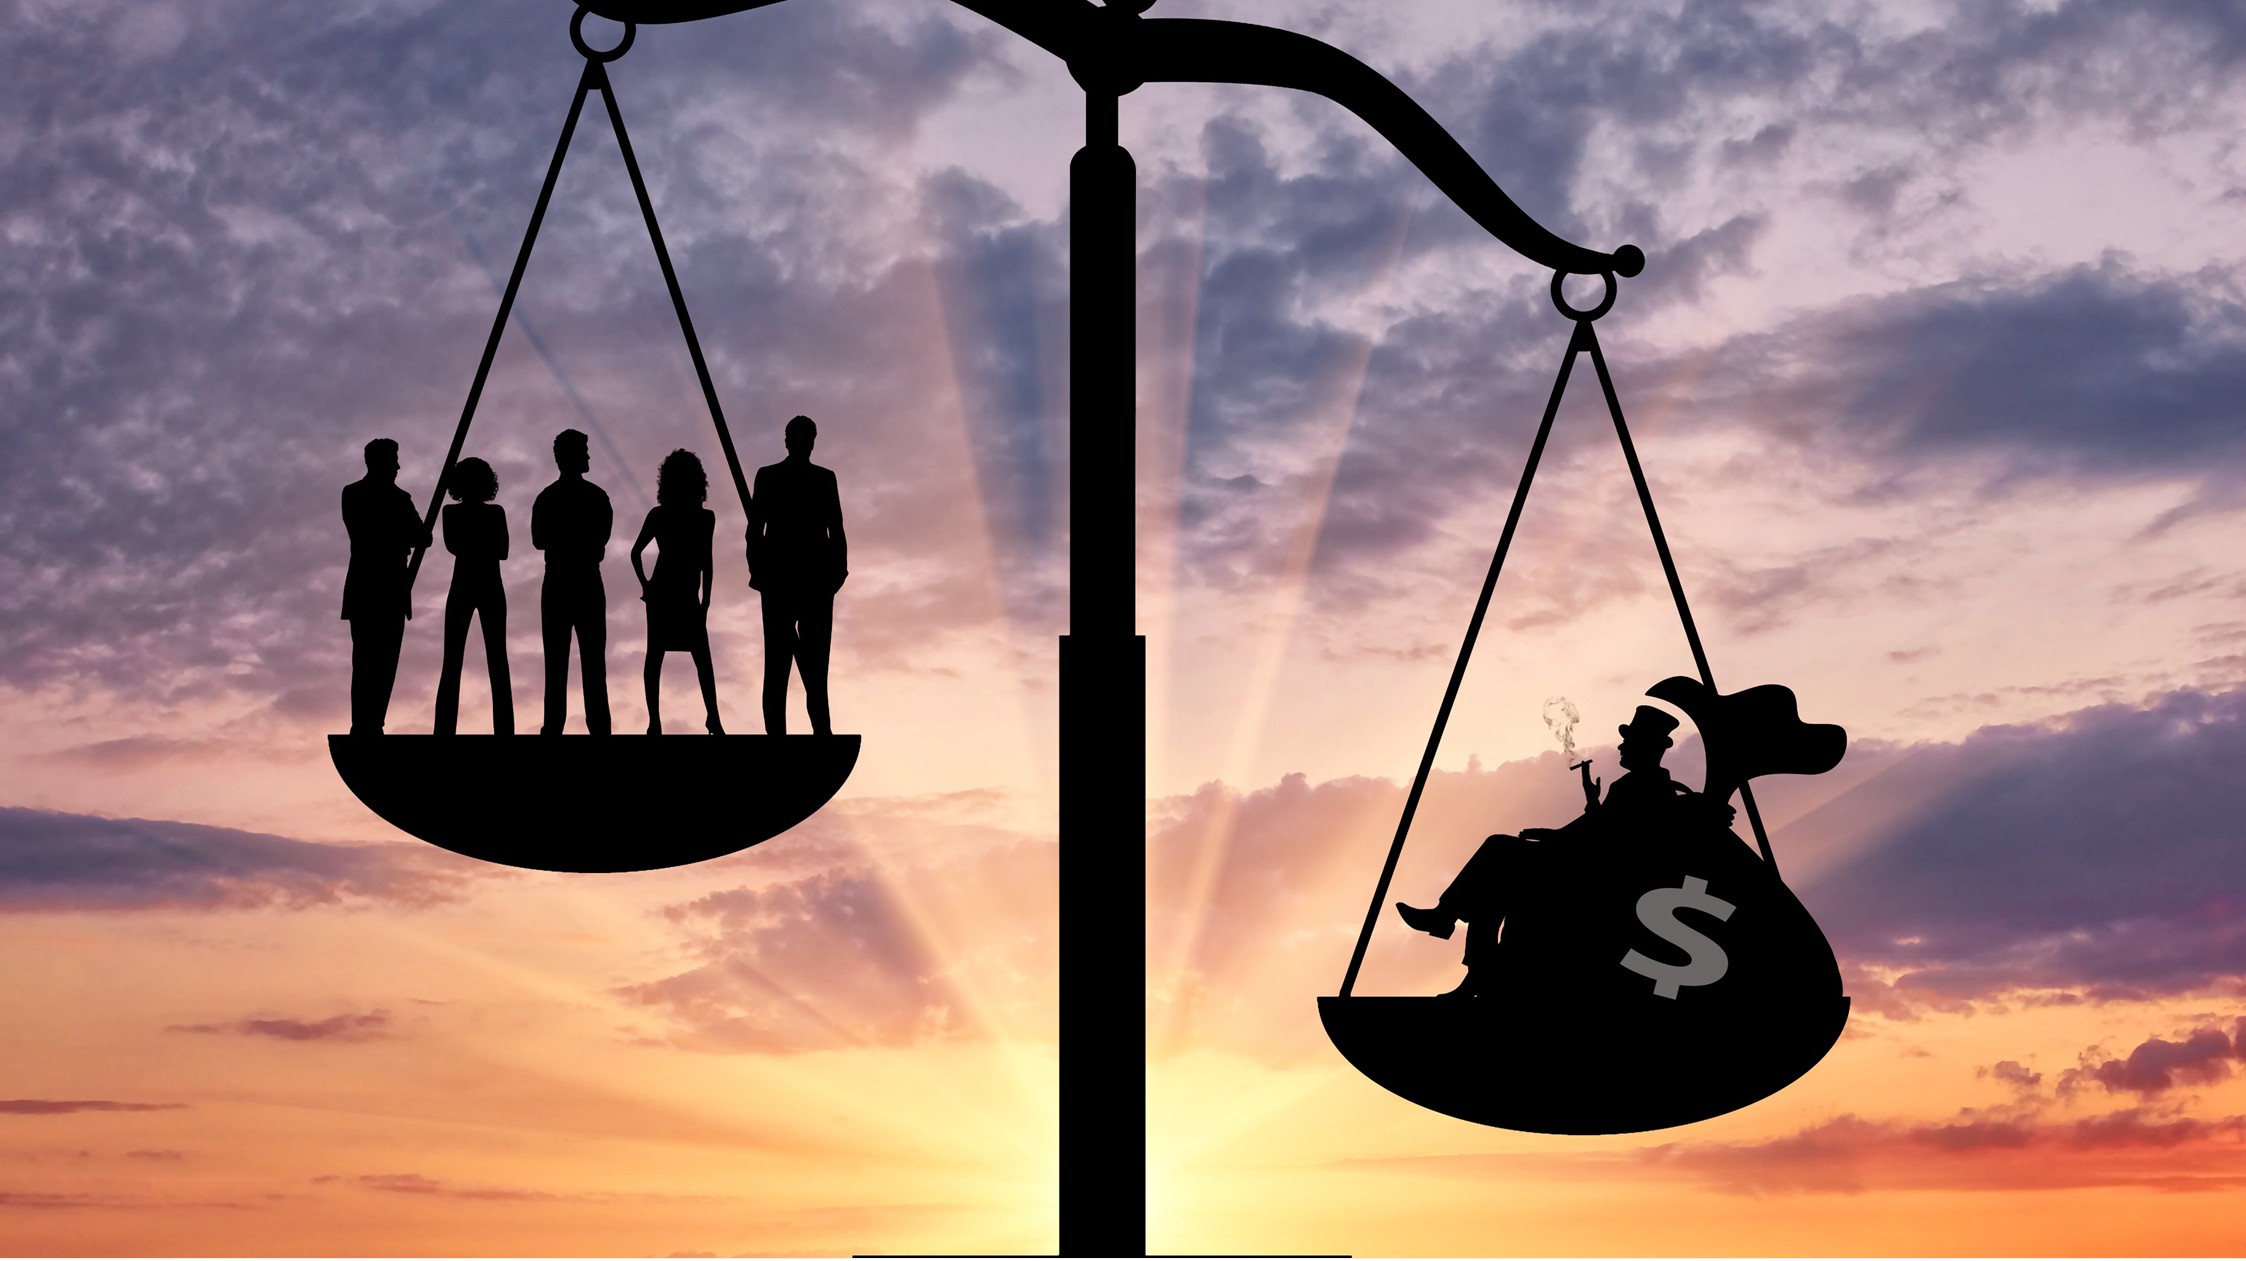
I keep returning to Charles Dickens’ A Tale of Two Cities to make sense of the paradox we are living. His famous opening captures the uneven impact of the AI boom on the economy. In one city, households with big stock portfolios are toasting record wealth. In the other, households that live on wages are enduring a winter of despair.
Rising wealth is propping up the economy, but is lopsided. Since 2020, net worth is up 80% and has reached a record 8.3 times the level of disposable incomes.
Inflation is a regressive tax, plain and simple. The longest bout since the 1970s hits hardest those who spend most of their income on necessities like food, energy and shelter; the prices they pay rise faster than the average.
Wage earners bridge the gap between pay and prices with credit and savings. The bill is coming due. The Federal Reserve’s Survey of Consumer Finances (SCF) revealed that 20% of families were behind on debt payments in 2025, the highest share since 2010. The survey predates the recent jump in energy prices.
Oil splits the pain. The US has gone from net importer to net exporter, so energy producers and their shareholders gain, while wage earners pay at the gas pump and the checkout line.
The AI trade turbocharged stock gains, concentrated wealth and galvanized a backlash that crosses every age, income bracket and party affiliation. The midterm elections did not create the issue; it just made it impossible to ignore.
Big technological leaps are often accompanied by bubbles. Canals, railroads, electrification and the internet all paid off, but only after a financial reckoning. The tech selloff that began in October offered a preview. Fears about data center costs started it; the midterms amplified the results.
Timing a bubble’s burst is a fool’s errand. Who gets hurt is the better question. Pay for the buildout from cash flow: shareholders take the losses. Pay with debt: the losses reach lenders and spread.
This edition of Economic Compass looks at two scenarios:
- Our base case, the economy stays resilient but gains flow mostly to the top while inflation lingers.
- Our bear market scenario, a stock market rout triggers a recession.
The Fed raises rates in December under both scenarios. The course for monetary policy thereafter depends on whether the economy continues to power forward or falters.
2026–2028: Boom or bust?
Chart 1 shows two scenarios for the economy over the next three years:
- Base case. Real GDP rises at a 2.6% pace in 2027, close to 2026’s pace, and slows in 2028. The expansion stretches into its eighth year, but that won’t be long enough for those who are losing ground to inflation to catch up. Unemployment stays low by historical standards.
- Bear market. Real GDP shrinks at a 0.5% annualized pace in the second quarter and 1.2% in the third, then flatlines in the fourth. The S&P 500 drops 25% in the first quarter and another 10% in the second. We see the correction as milder than the last tech bust, which may be optimistic. Unemployment jumps from a low of 4.1% in October to 5.4% by year-end 2027; it peaks with a lag at 6% in 2028, as workers sidelined by the recession rush back faster than jobs can be created.
Chart 1: Real GDP diverges
Divergent paths: Boom or bust?
Wages no longer share in the productivity gains the way they did in the 1990s. Back then, tight labor markets gave workers leverage and cooling inflation lifted purchasing power. It is no coincidence that consumer sentiment hit a record high in January 2000, riding the high of the tech bubble, narrowing inequality and relief over the Y2K scare. (Look it up it if you’re too young to remember it.)
Since the pandemic, wages have struggled to keep up with prices. The labor share of income dropped to 52.9% in the second quarter, a post-WWII low; profits hit a record high despite higher costs and interest rates. Consumer attitudes are hovering at multi-decade lows.
Government surpluses are a distant memory – the last one was in fiscal 2001. The deficit is on track to surpass the $2 trillion we saw in fiscal 2025, or more than 6% of GDP; that is double the pace needed to hold debt as a share of GDP in check.
The Fed is charged with carrying the load in both scenarios. It tames inflation in one and stimulates growth in the other.
Base case: Resilience fails to resonate
Consumer spending holds up. Wealth is top-heavy. The Fed’s SCF shows that the top 10% of earners hold nearly 75% of aggregate wealth and 46% of income; they account for 32% of total spending and an even larger share of discretionary purchases. The data predate the squeeze at the gas pump. Spending is likely tilted even further toward the top today.
Banks are more cautious, favoring applicants with high credit scores and widening the spending divide. A boutique industry has emerged that enables wealthier households to leverage their financial assets. All-cash purchases of vehicles and homes have become more common, further separating the haves from the have-nots.
Housing remains frozen. Higher mortgage rates, escalating construction costs and competition for skilled tradespeople take a further toll on the housing market in 2027. Home builder sentiment recently plummeted to the lowest level since 2012, when the economy was still emerging from the housing bust. Green shoots emerge in response to lower rates in 2028.
Investment is fueled by data center backlogs in 2027 but slows in 2028. Financial markets began pushing back on the debt needed to finance data centers well ahead of the midterms. Governors-elect who pledged to pause or restrict new data centers face pressure to deliver. Power, not politics, is a larger near-term constraint; wait times for grid connections have ballooned. Moratoriums and stricter ratepayer rules will increase delays.
Inventories rebuild. Hyperscalers are stockpiling equipment for data centers, which is adding to inventories. Oil is another big mover: record low reserves need to be replenished.
Government spending edges higher. Republicans are racing to lock in their priorities before Democrats take control of Congress. At a minimum, they must pass a continuing resolution to avoid a government shutdown on December 11. The president has asked for more defense funding and farm aid.
A sleeper issue is the debt ceiling, which has become a political football since the debt crisis of 2011. It is expected to be breached in 2027. Threats to default on existing debt would roil financial markets - the debt ceiling was never intended as a curb on outstanding debt.
Democrats will push to restore Medicaid cuts, along with SNAP benefits and Affordable Care Act subsidies. They will have Republican allies on some of those initiatives, along with efforts to amend unpopular tariff laws. AI is another hot-button issue. Reaching a veto-proof majority is a heavy lift. Gridlock is the base case.
State and local budgets are more limited, especially if the additional cuts to Medicaid and SNAP hold. The loss in funding for higher education and research, along with recently enacted tax holidays on gas prices, adds to budget woes.
The trade deficit widens. The AI buildout is highly dependent on imported inputs, many of which have received tariff waivers. Strong imports combined with weak exports are expected to keep the trade deficit widening in 2027 and 2028.
Bear market: Drivers of gains reverse
Consumer spending contracts from the second quarter through year-end. Wealth effects are asymmetric; they hurt more on the way down than help on the way up. Margin calls on the debt backed by lofty stock valuations could accelerate the selloff. A drop in employment intensifies the pain. Lower interest rates and a moderate rebound in equities and employment fuel a recovery in spending in 2028.
Housing weakens, but leads recovery. A blow to equities and employment hits both existing home sales and new construction. Home values decline, but the cushion on housing equity is solid – this is not a repeat of the housing bust. A drop in mortgage rates, easing of material costs and worker shortages puts housing back in the driver’s seat. First-time buyers get another shot at home ownership.
Investment buoyed by data center backlogs. Large backlogs blunt the initial blow to data center construction; speculators are the first to abandon projects. A loss in equity valuations and tighter credit conditions prompt a larger correction in 2028.
Inventories are drained. Stockpiling ceases as demand falters. The drawdown is blunted by the need to replenish oil inventories, which occurs faster at lower prices.
Government stimulus is limited. Deficits widen in recessions as tax revenues fall and political pressure to stimulate the economy mounts; the space to respond is limited. States administer unemployment insurance, which lapses after 27 weeks. A shortfall in tax revenues will prompt budget cuts in other state and local services.
The trade deficit slowly narrows. Recessions narrow the trade deficit, as the blow to imports is larger than the blow to exports. This time is different due to data center backlogs and their heavy reliance on imported components. That is before the spillover effects a bear market would have on growth abroad. There is no Las Vegas in the global economy; what happens here will not stay here.
Risks. Government spending could come in stronger than currently forecast under both scenarios, given the desire to spend more by both parties and the political pressure to stimulate economic growth in a recession.
The wild card is private debt, which is set to be repriced in 2027 and 2028. The market is large but opaque. No one knows where losses might show up. A recession saps revenues and compound debt servicing costs for firms that are already highly leveraged.
Two scenarios, two inflation rates
Chart 2 shows the personal consumption expenditures (PCE) price index, the Fed’s preferred gauge. The trajectory on inflation differs dramatically under the two scenarios:
- Base case. Inflation has persisted for more than five years and is showing signs of accelerating. We could top 4% on the PCE index by the year-end.
- Bear market. Demand does the Fed’s job for it. Inflation dips below the Fed’s 2% target in the fourth quarter of 2027. Oil leads the descent.
Risks. The recent acceleration in inflation could persist longer and peak higher than forecast. The tail on energy prices is long. Stagflation is a worst of all worlds scenario.
Chart 2: Two paths to price stability
Fed hits a fork in the road
The Fed is boxed in. It follows the economy; it does not steer it. Chart 3 shows the fed funds rate in each case:
- Base case. The Fed hikes another one-half percent by early 2027, which lifts the fed funds target range to 4.25%–4.50%. It then holds rates higher for longer to cool inflation. Hawks are eyeing the December meeting.
- Bear market. The Fed hikes in December, then makes a U-turn and cuts two full percentage points, starting in the second quarter and finishing in the third. The fed funds target bottoms at 2.0%–2.25% in late 2027 and stays there through 2028.
Risks. A more persistent bout of inflation could push rates higher in both scenarios. A half percent hike is on the table for December, either way.
Chart 3: Fed hits fork in the road
Bond yields: Rout or rally?
Chart 4 shows the 10-year Treasury yield in each case. In the base case bond market rout pushes interest rates higher; in the bear market case, a rally pulls them lower:
- Base case. Yields peak at 5.4% in the second quarter of 2027 and stay above 5% through 2027. Yields fall to a low of 3% in 2028, with cooling inflation. That is still more than one percent above pre-pandemic norms.
- Bear market. Yields fall below 4% by year-end 2027 and below 3% in 2028, as growth slows, inflation drops sharply and the Fed cuts rates. The US remains a safe haven; Treasuries rally as stocks sell off.
Risks. Stickier inflation limits the Fed’s options, which ups the compensation that investors require to absorb a surge in global bond issuances. The bond vigilantes took a break in recent weeks; they could return, with a vengeance.
Chart 4: Bond rout or rally?
Bottom Line
Wall Street priced in the best of times. Main Street got the bill. Under both scenarios, the stock market boom has left the economy more vulnerable than it was when the last tech bubble burst; wage earners are the most exposed. They have drained their savings and taken on more debt, with little leverage to ask for a raise.
Voters noticed. The backlash to AI and its costs, which the midterm elections sharpened, shows how little patience is left. If the bubble bursts, already stretched families have the least cushion. Until wages outrun prices and the gains reach more than a few households, the boom will feel like someone else’s.
Dickens did not leave us in despair. His story turns on redemption: its unlikeliest hero, Sydney Carton, gives his wasted life to save another. Economies are made of people; people choose which city they build. Make room at the table, set another place. Thanksgiving is upon us. Break bread, not ties. Be kind; pay it forward.
Gains fail to resonate at polls
AI boom masks unease, stokes bear market fears Real GDP rose at a 3.4% pace over the summer, the strongest in a year. Gains were broad-based. Consumer spending, business investment and government spending all soared. Federal spending alone jumped at a double-digit pace and offset a modest drop in state and local spending. Housing further contracted. The trade deficit widened at its fastest pace since early 2025 when firms were front-running Liberation Day tariffs.
Prospects for the fourth quarter remain solid if not spectacular. Real GDP is forecast to rise at a 2.5% annualized pace. Consumer spending moderates a bit but remains on solid ground, albeit uneven. Business investment remains buoyed by the AI buildout, along with inventories. Government spending becomes a drag on growth, due to a continuing resolution, which holds federal spending at fiscal 2026 levels until a new budget is passed. The trade deficit is poised to further widen on the surge in inputs to data centers.
Real GDP is on track to accelerate 2.6% on a fourth-quarter-to-fourth-quarter basis in 2026, which better captures momentum than annual averages. That compares to a tepid 2% rise in 2025. Consumer attitudes bucked that trend and deteriorated due to the burn of inflation and worsening inequality.
The Fed hikes in December. The Fed skipped an October hike, but support for a a half percent hike in December is intensifying. Hawks have begun to weigh more aggressive hikes. The concern is service sector inflation, which is starting to look like it is becoming entrenched.
Economic Forecast — November 2026
Dive into our thinking:
Explore more


Subscribe to insights from KPMG Economics
KPMG Economics distributes a wide selection of insight and analysis to help businesses make informed decisions.
Meet our team