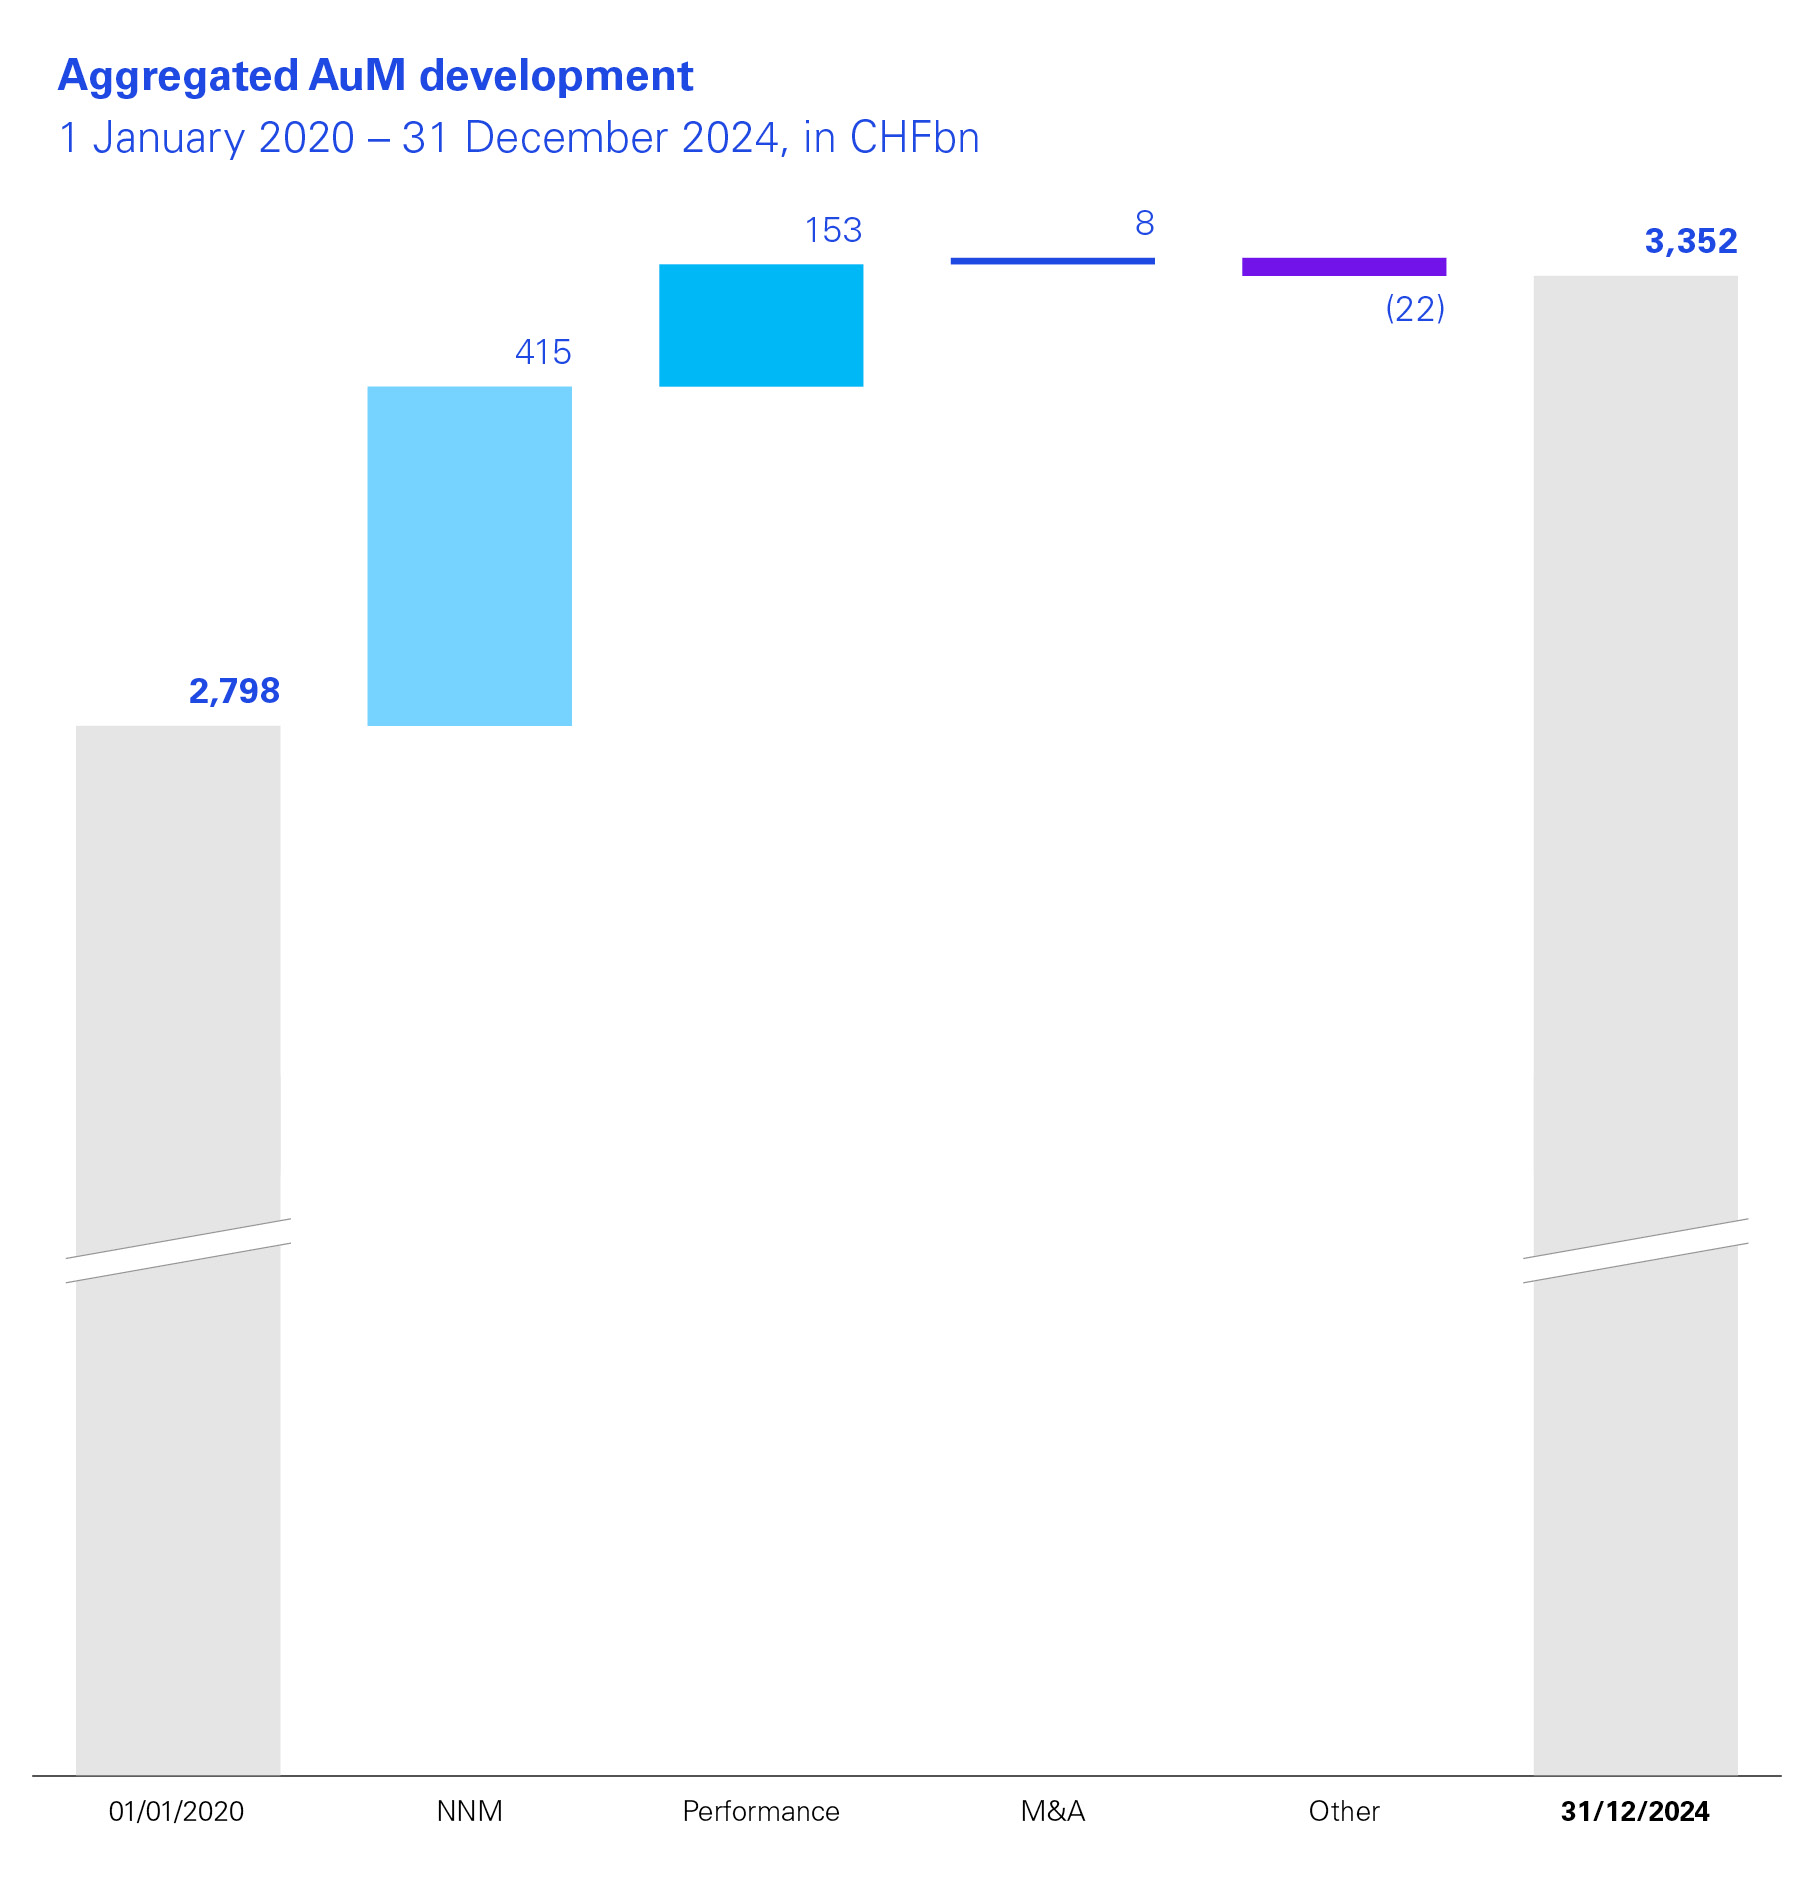
The high interest rate environment since 2022 has boosted profits, and strong financial markets in 2024 boosted assets under management (AuM). This enabled Swiss private banks to generate the highest level of AuM since we began our study. Below the surface is a number of sustained challenges, however.
As the boom from interest income declined significantly in mid-2024, banks were able to replace lower interest income with higher commission income on the back of strong markets. Looking ahead, it is this core commission income business where they must focus their efforts.
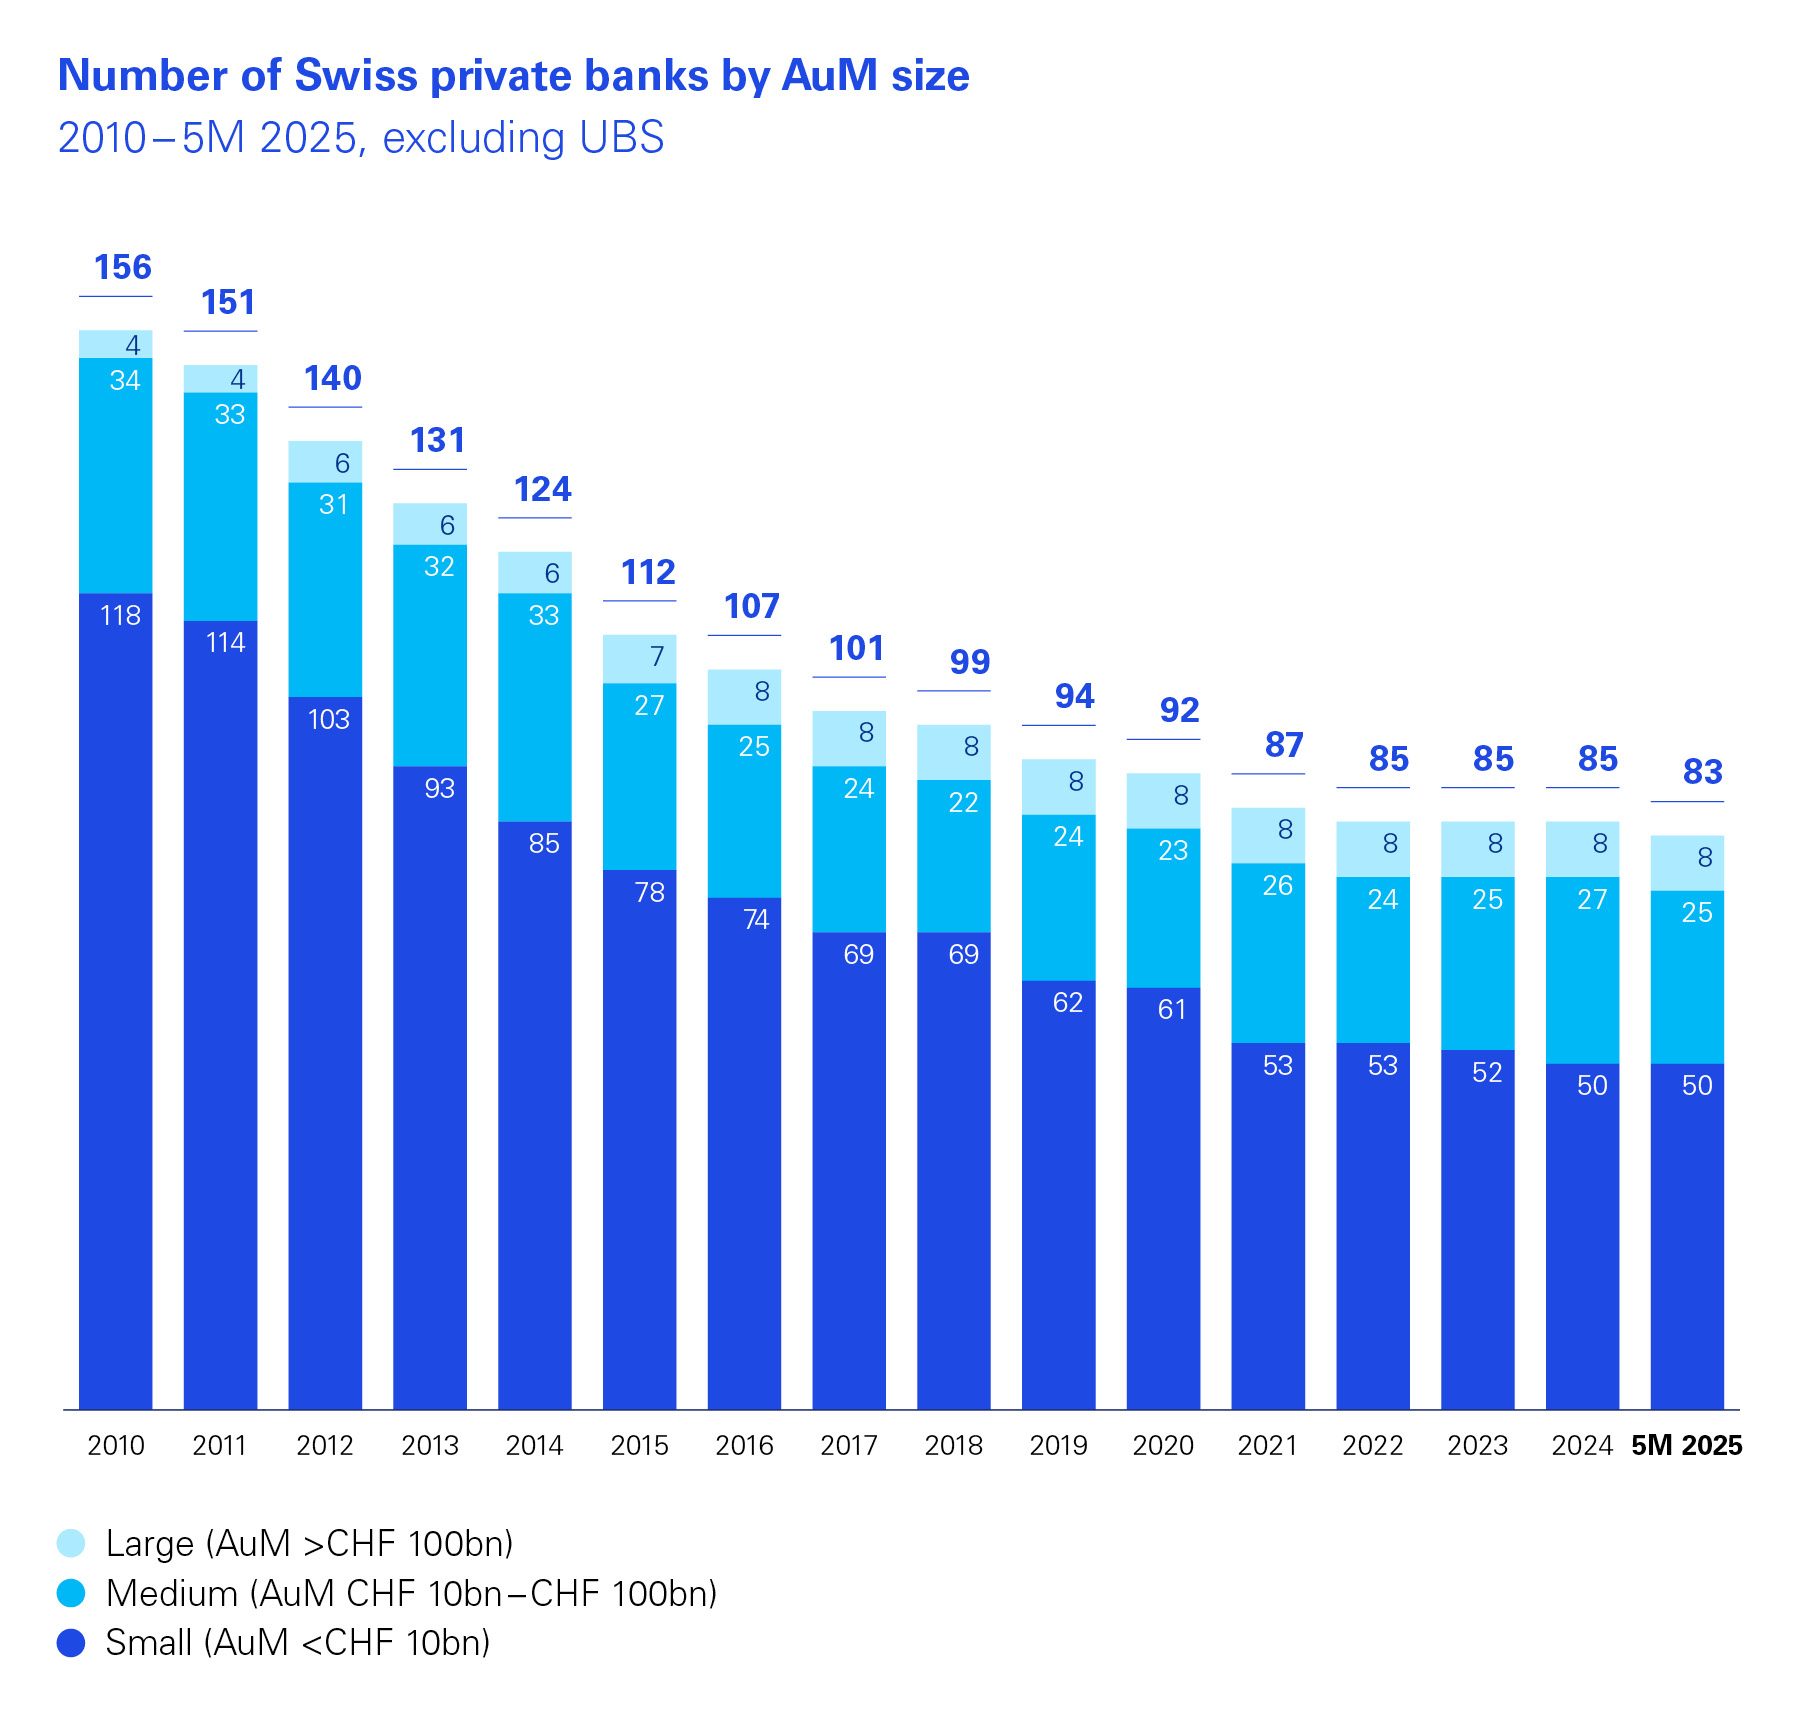
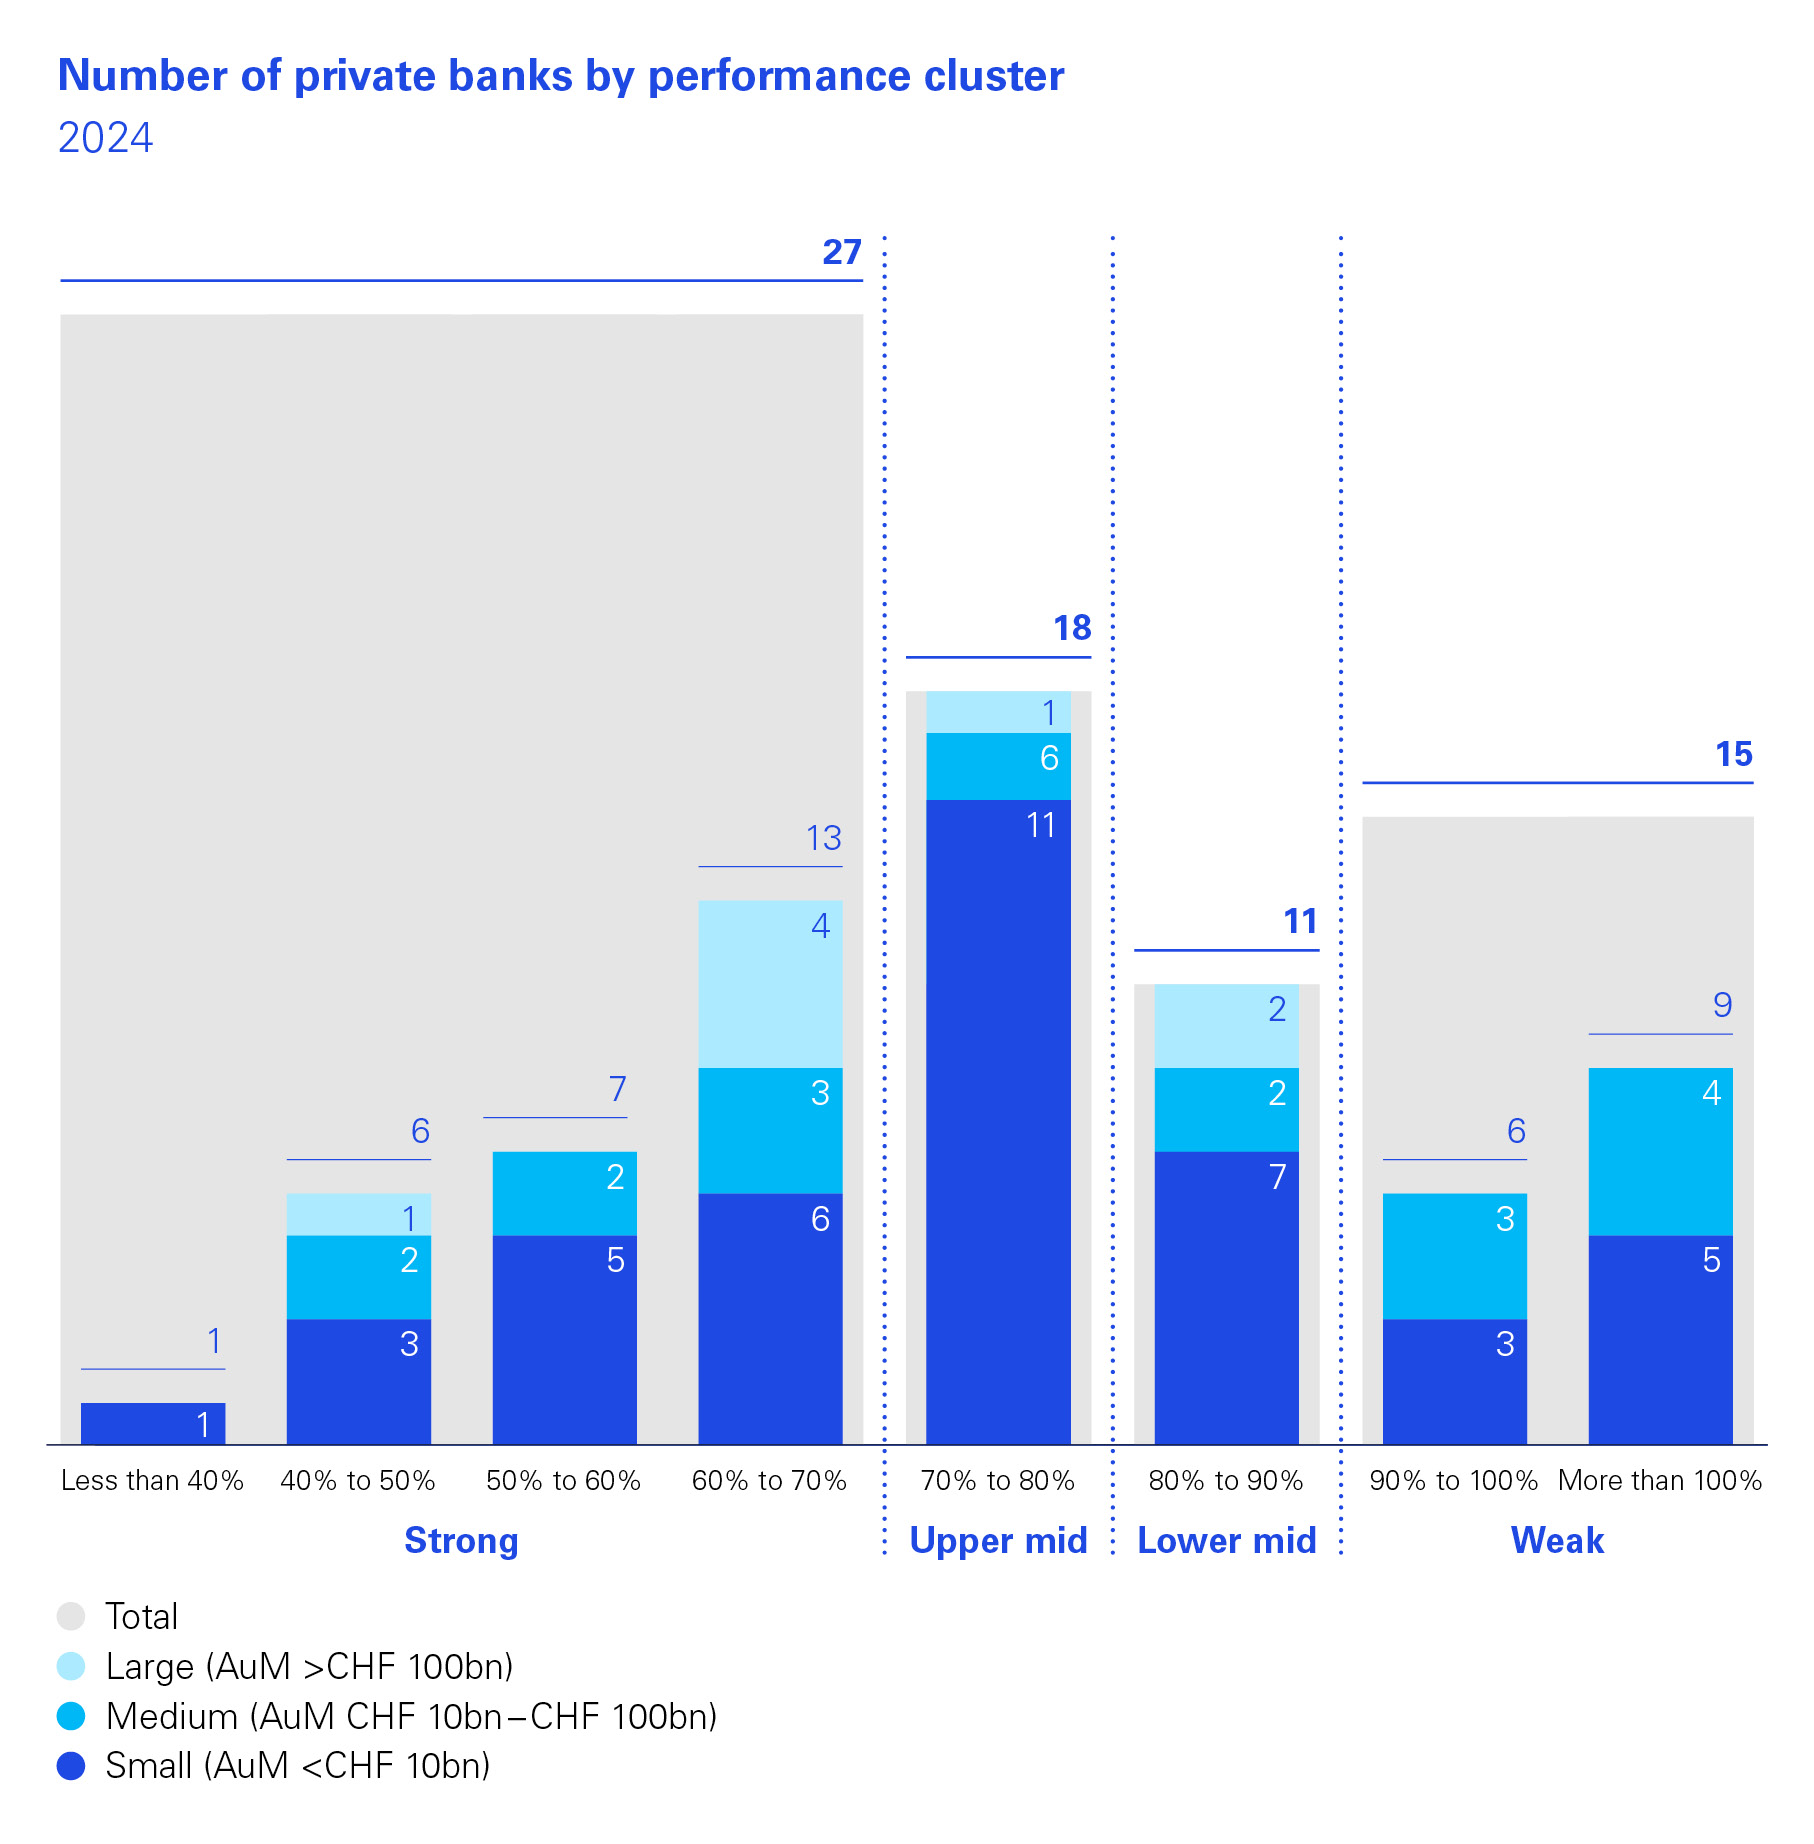
The HSG undertook an analysis of Swiss private banking business models for our study, and found two clearly successful models for higher and sustained profitability.
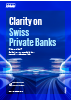
At the same time, consolidation has picked up. From 85 Swiss private banks at the start of 2024, we expect fewer than 80 to remain by the end of 2025. Last year also saw the largest Swiss private banking deal for more than a decade as Safra Sarasin acquired Saxo Bank.