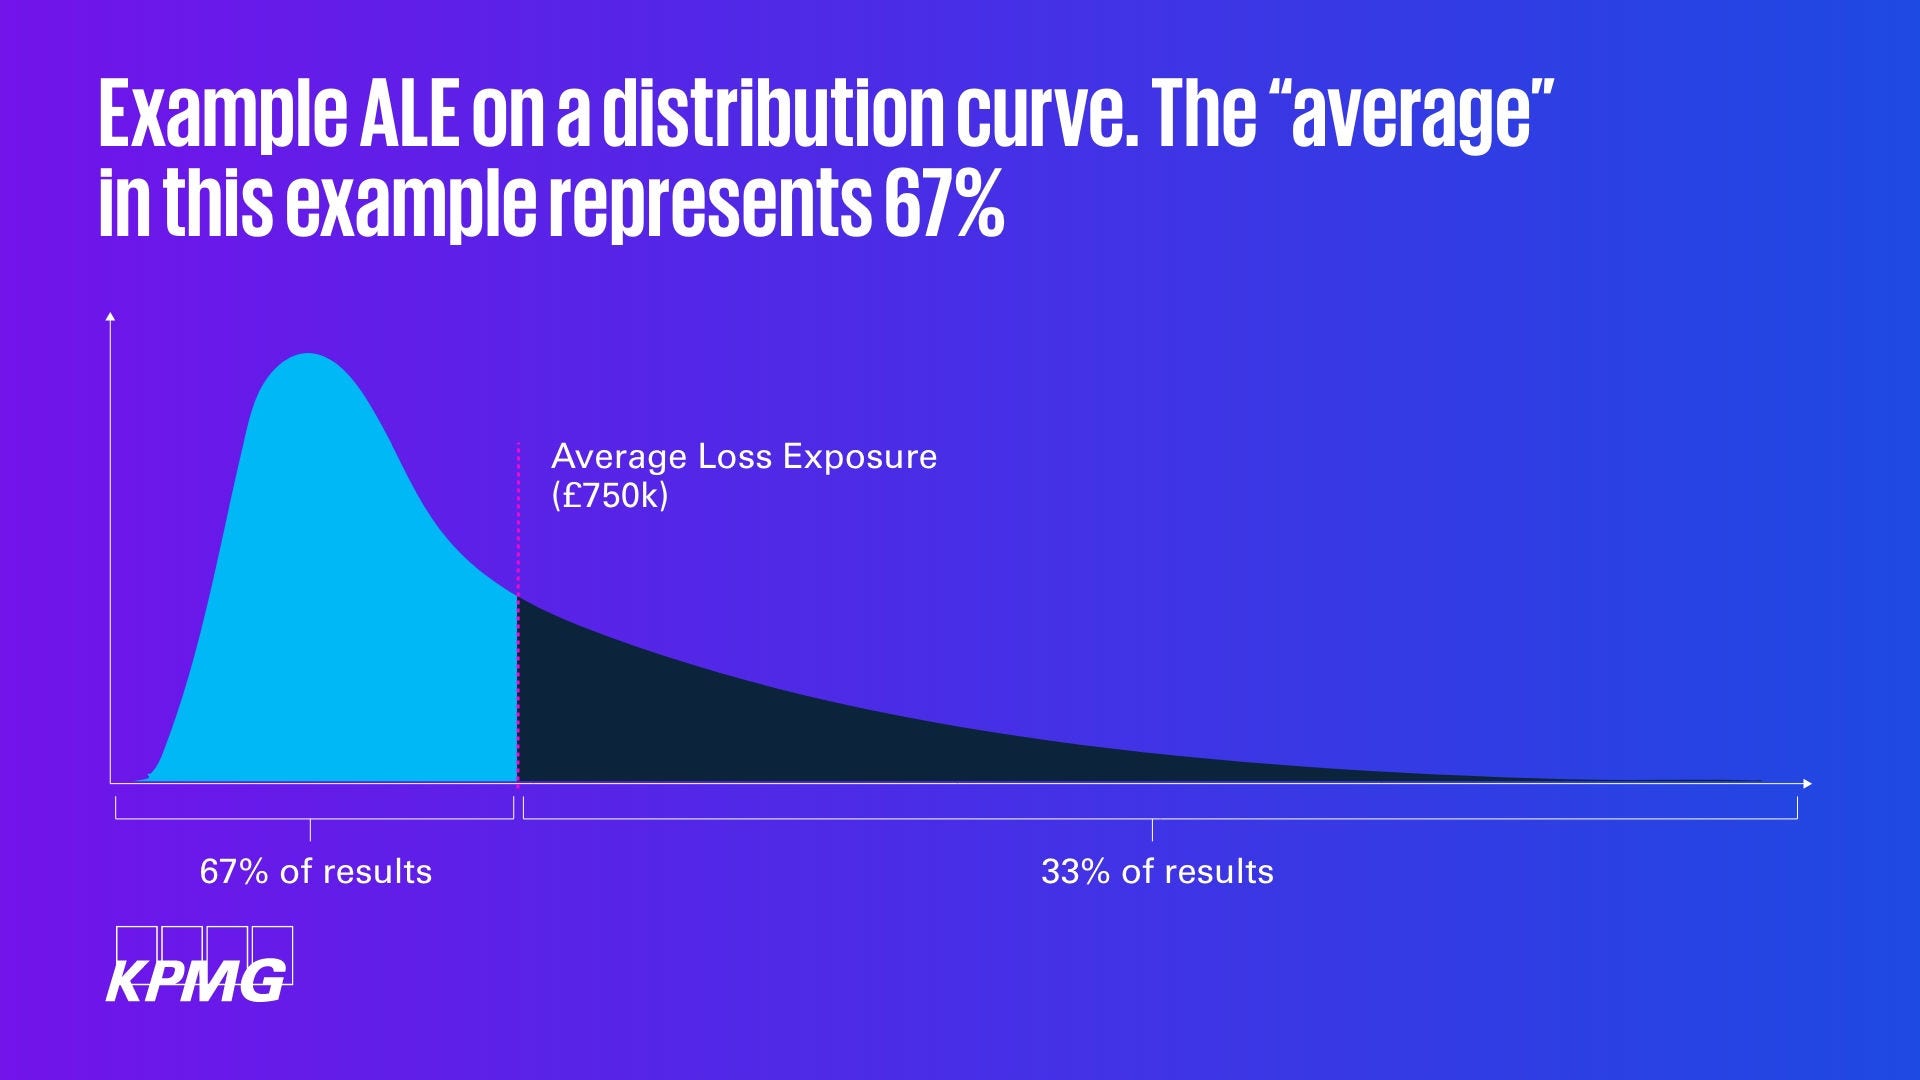
i ALE goes by many names, including average expected loss (AEL), average annual loss (AAL), and value at risk (VaR)
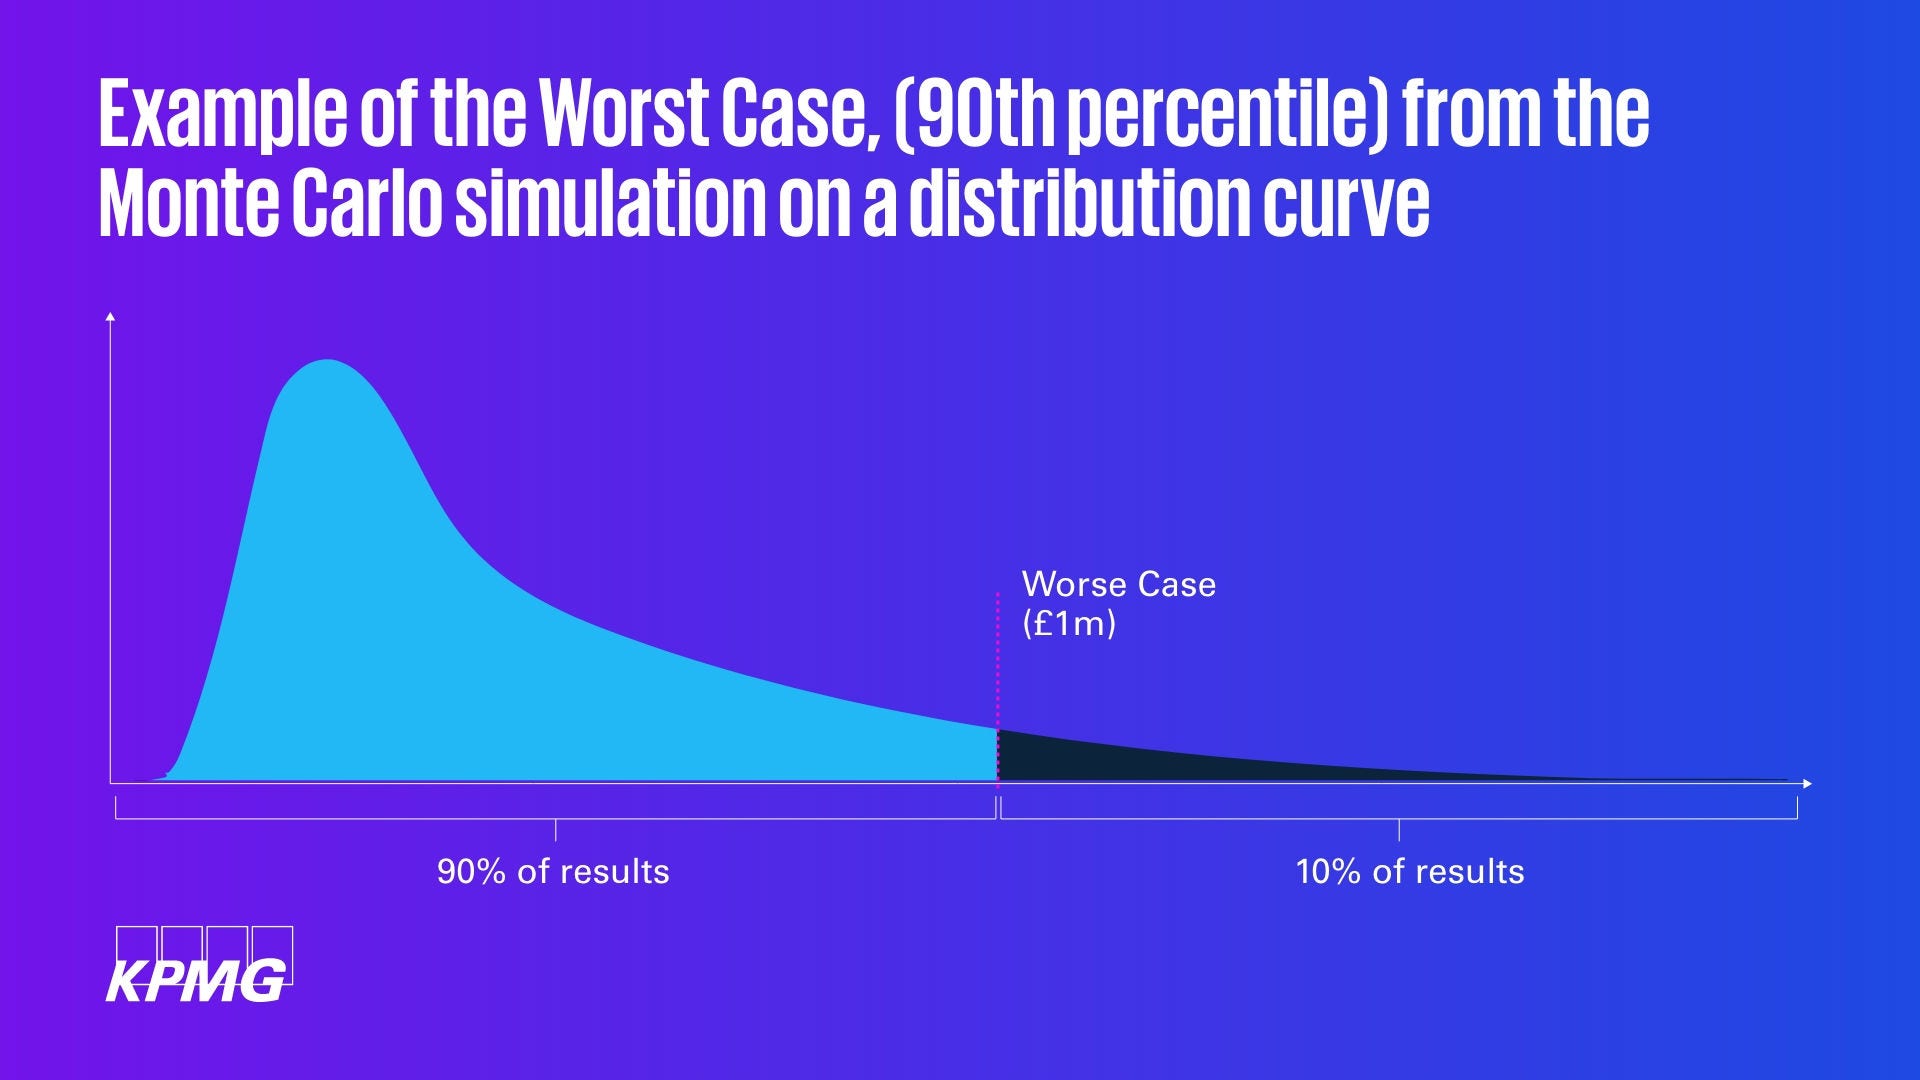
ii While the 90th percentile is often used, it’s choice is wholly arbitrary. Other values often used include the 95th, and 99.997th percentiles. These are again arbitrary, but importantly, they meet the needs of your audience, so understand what they expect the ‘worst case’ to mean when selecting the right figure to show. A limit such as 90% rather than using the absolute worst case of a simulation, because results still want to be plausible and conceivable – there is no value in describing a scenario that will never occur, because it will discredit both message and messenger, impairing communication, and stopping the effective management of risk.
iii Some caveats apply. The likelihood of the risk could change over time and there may be other, external impacts to consider as well
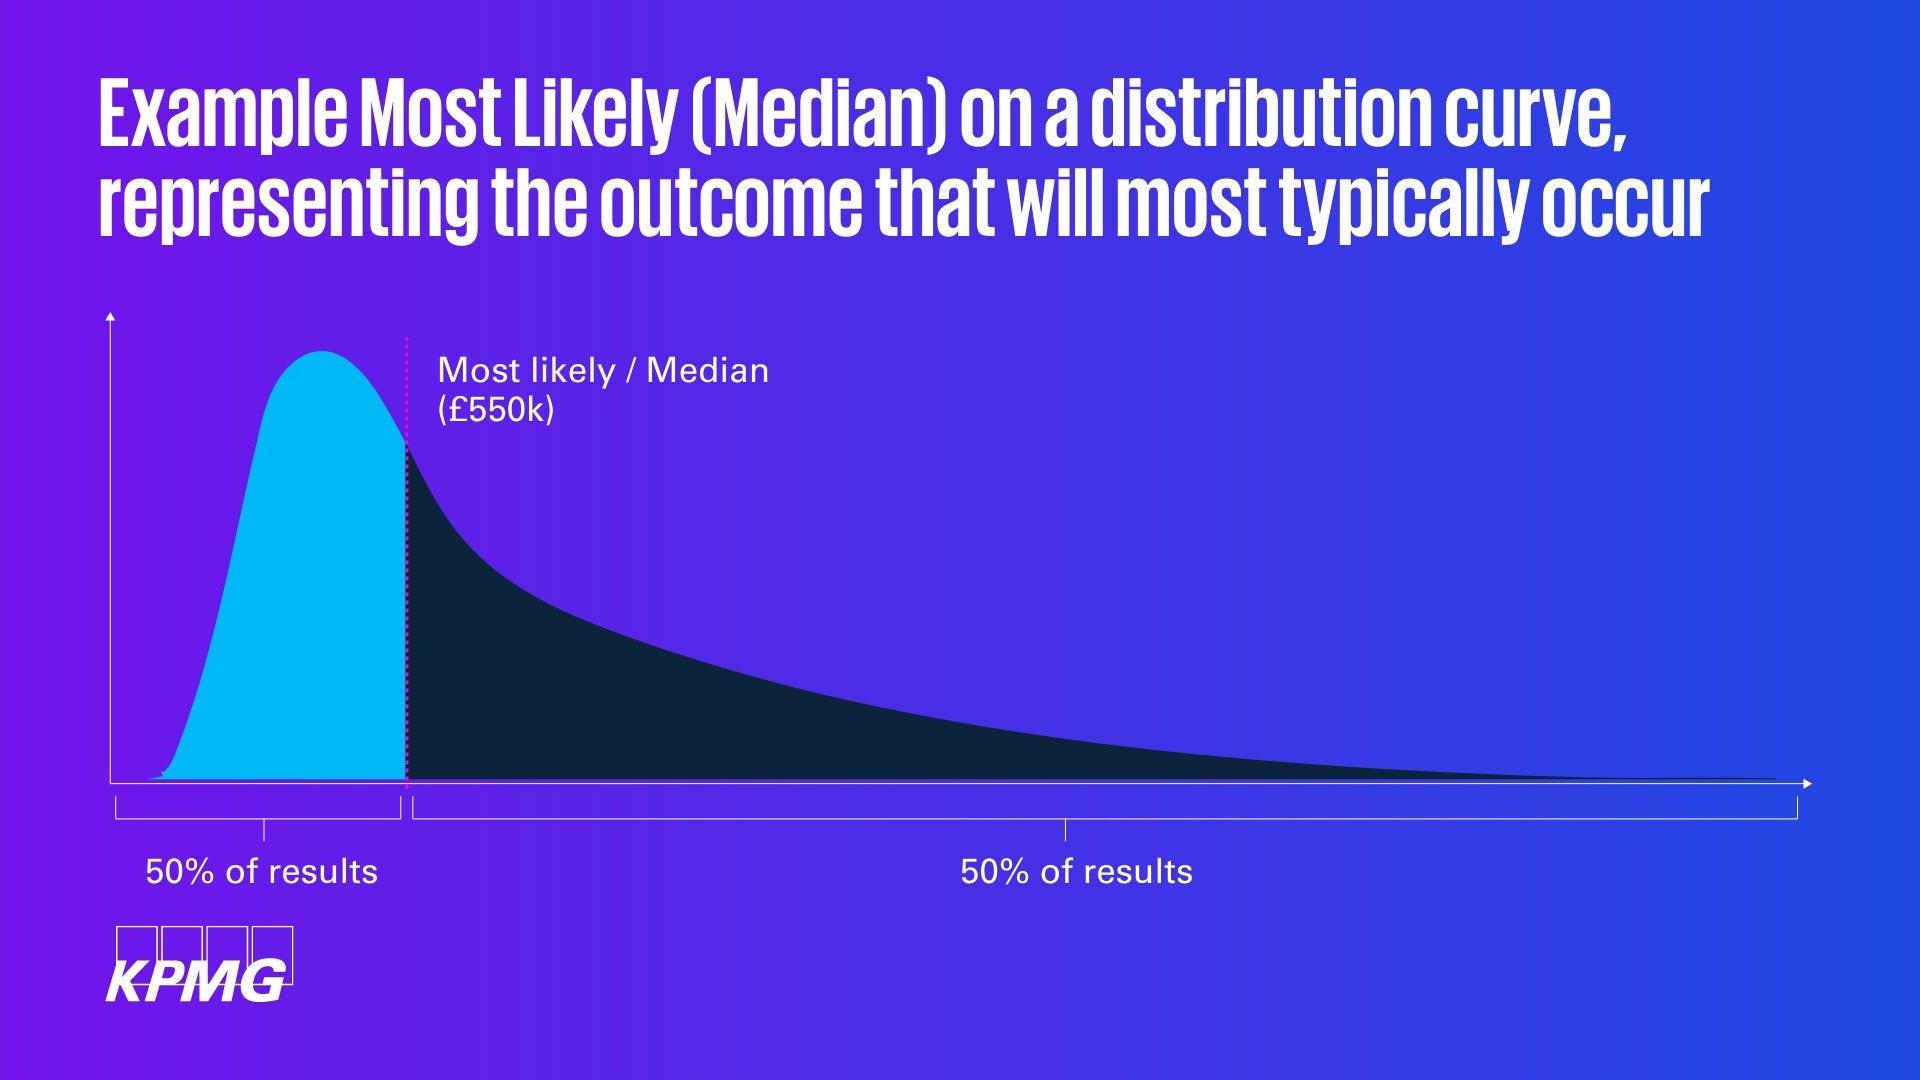
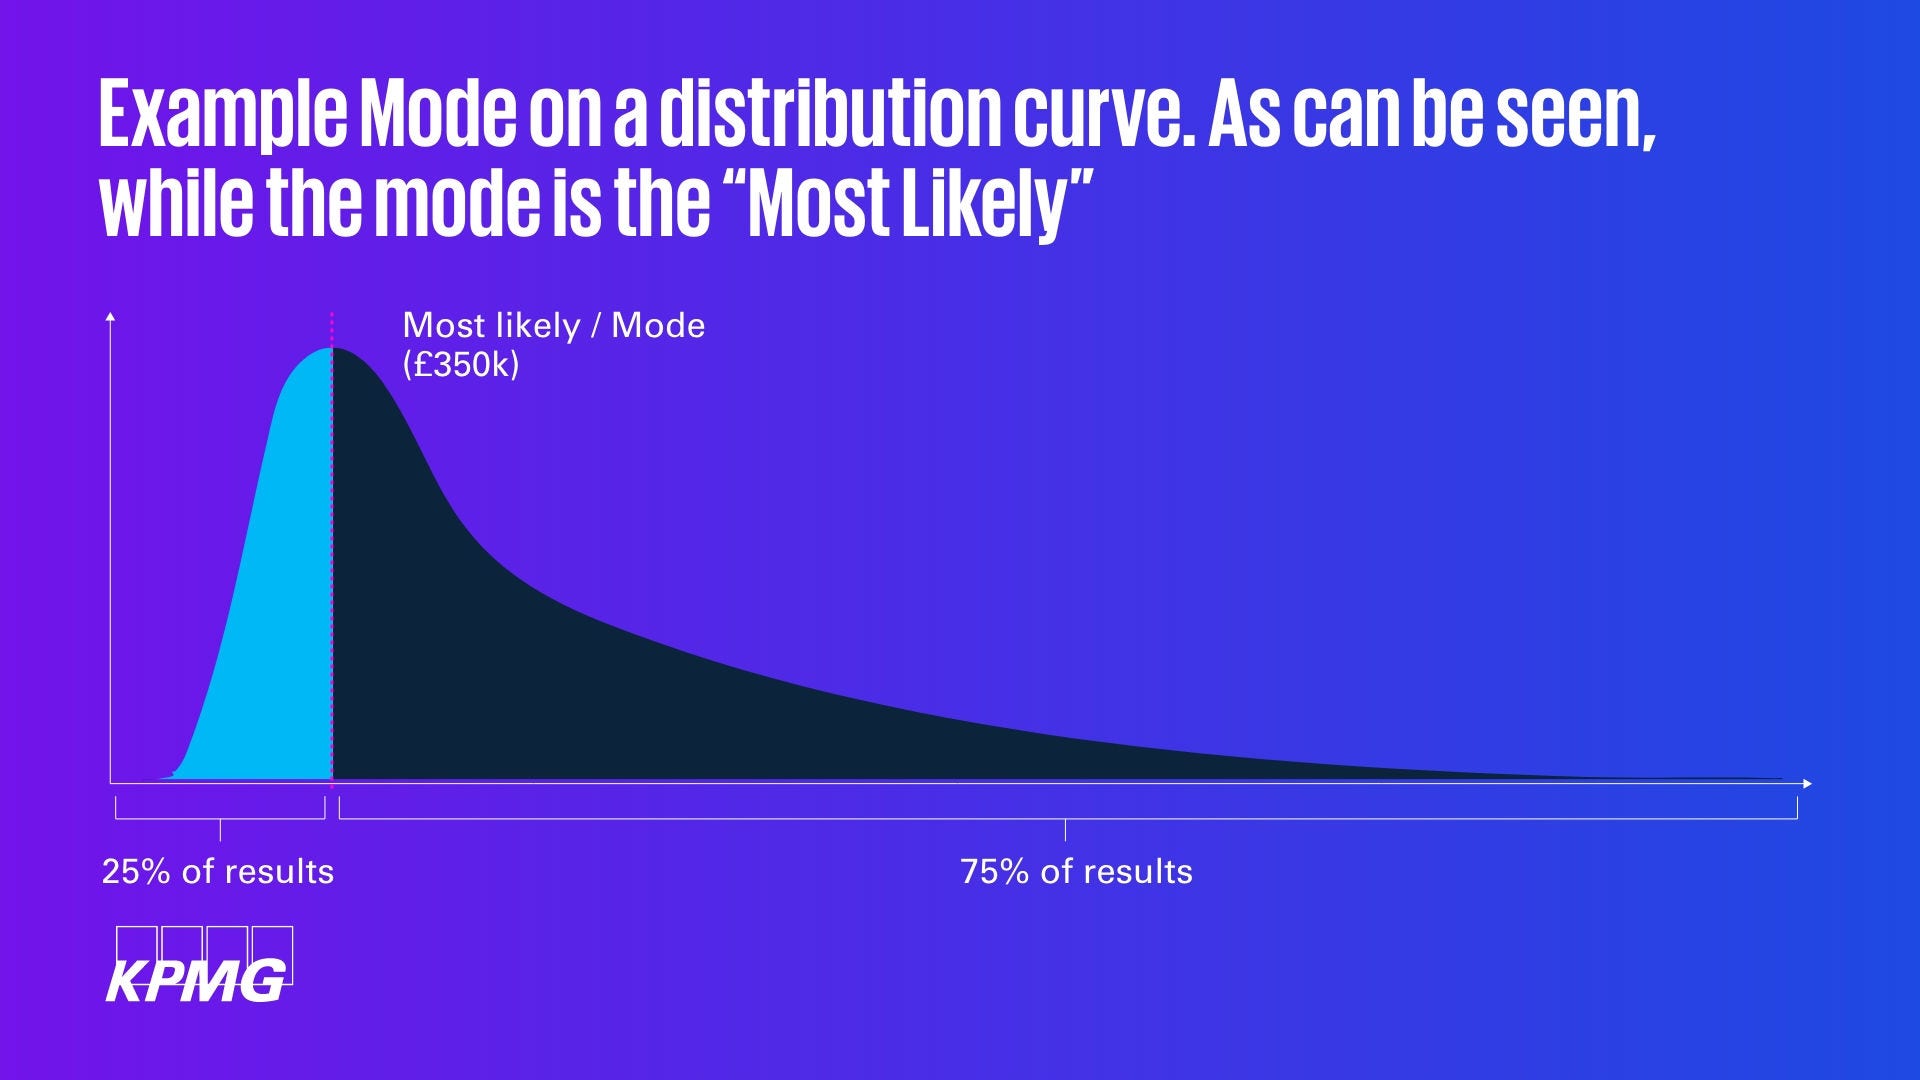
iv Strictly speaking the mode is the most likely in mathematical terms. However, when analysing the results of a Monte Carlo simulation (or a large sample of data), the Median will practically provide that for you. The mode won’t work as it’s all but impossible to have the same result multiple times in truly random (or stochastic) data. The Cyentia Institute uses the Geometric mean, but acknowledges that it is essentially the same as the Median from a skewed distribution (a Monte Carlo simulation will produce a skewed distribution due to using lognormal functions).
v Gambling, quantitative finance, and high frequency trading
vi See: “The flaw of averages”


