To help us achieve this, we’ve outlined bold ambitions and set long-term targets to 2030 as part of our Inclusion, Diversity and Equity (IDE) plan – Our KPMG: A fairer future for all. Our plan is designed to create an inclusive environment, equitable experiences and accountable leaders, which will in turn help improve the representation of historically underrepresented groups at our most senior levels of the business. It is why we don’t just focus on getting into our profession, but also how you get on and progress within our firm.
It marks an ambitious but evolutionary chapter as part of our long-standing commitment to change. We know we need to continue to challenge ourselves, confront biases and listen and learn from each other, and this marks the next step in our journey towards a fairer future for all.
Watch this video to hear from leaders on our IDE Council reflecting on how to drive inclusion in the workplace.
Our 2030 leadership ambitions
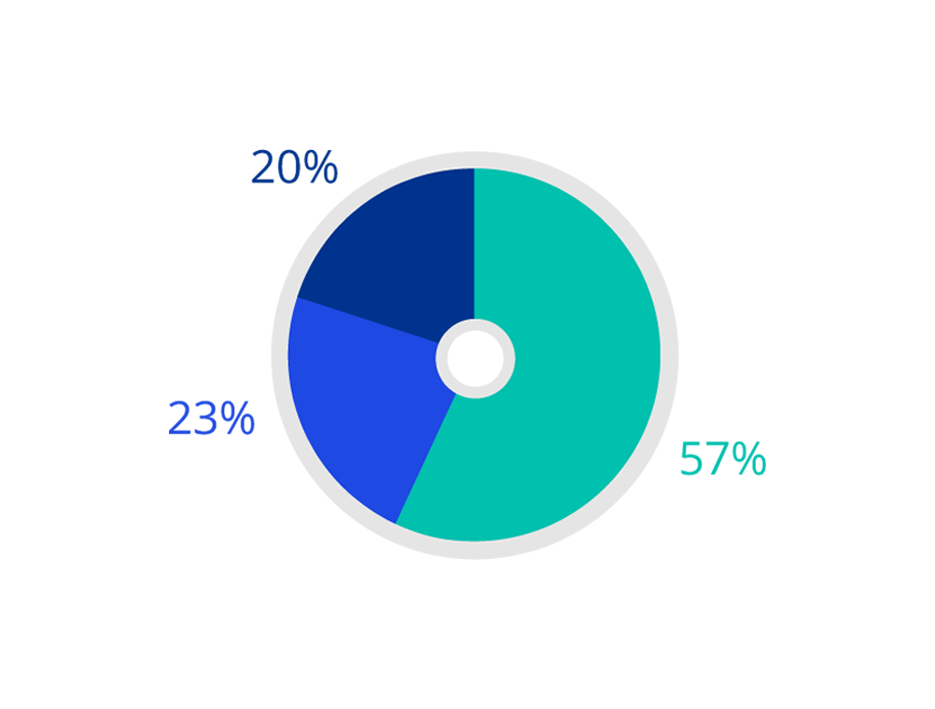
Inclusion, diversity and equity is at the heart of our business strategy. We know that we need to see better representation at senior levels of our firm, so we’ve set long-term targets as part of our 2030 commitments.
40:40:20*
Female (minimum 40% female)
20%
Ethnic minority
15%
Disabled
6%
Sexual orientation
5%
Black heritage
29%
Lower socio-economic background
For the purposes of our inclusion, diversity and equity targets, we define leadership as our partners.
*40:40:20 requires us to have a minimum of 40% female colleagues and 40% male colleagues in the relevant population. 20% is flexible and recognises the moving nature of our firm, while setting parameters for us to meet and stay within
Inclusion, diversity and equity is at the heart of our business strategy. We know that we need to see better representation at senior levels of our firm, so we’ve set long-term aspirational targets to 2030. You can explore firm wide representation and progress towards targets in the Diversity explorer tool below.
Diversity explorer tool
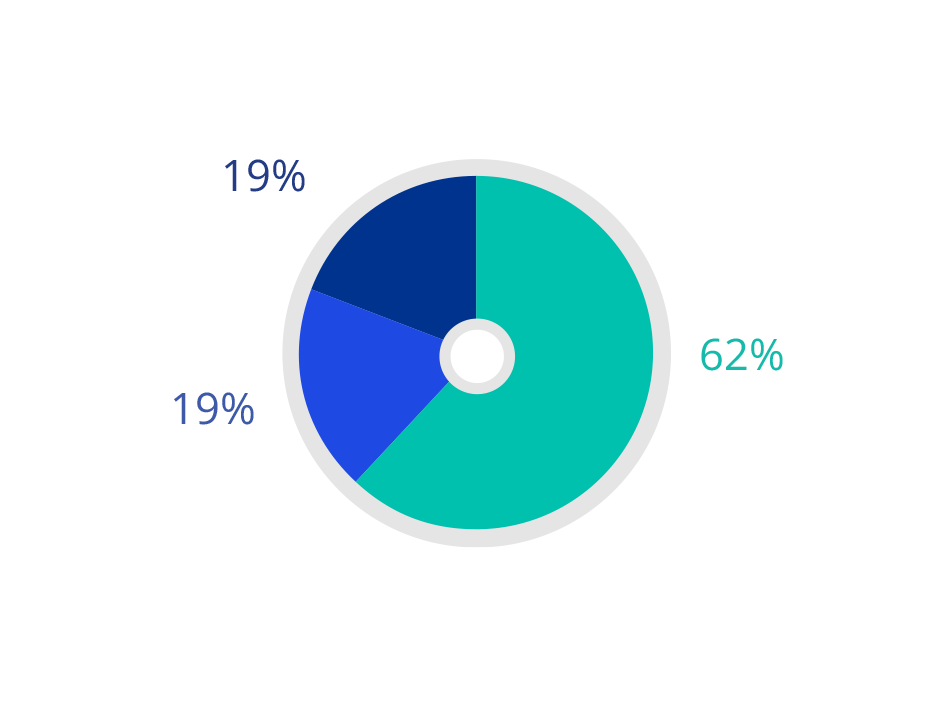
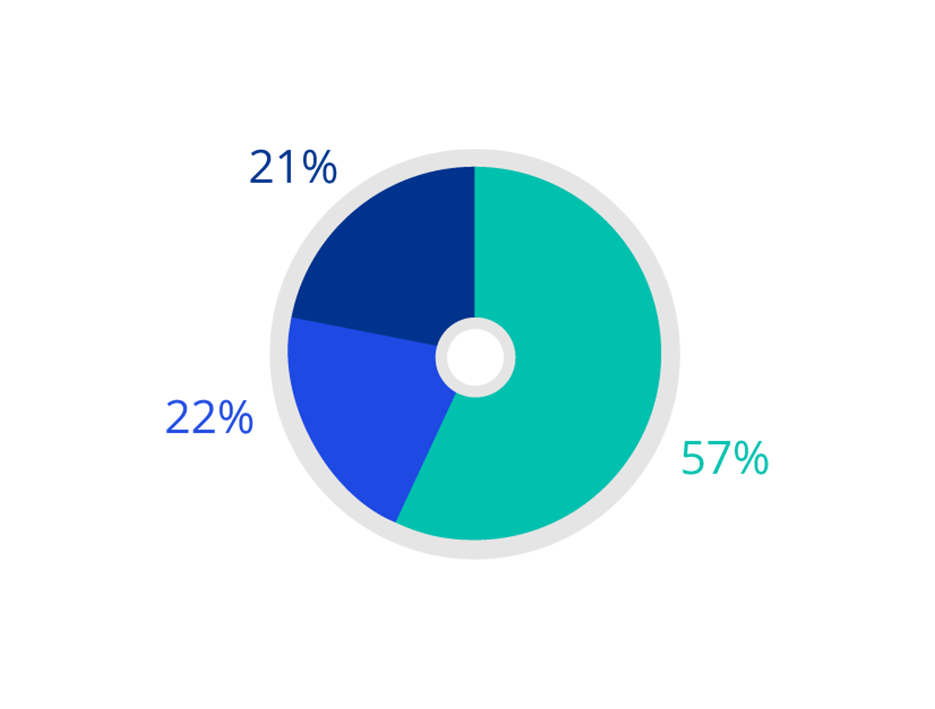
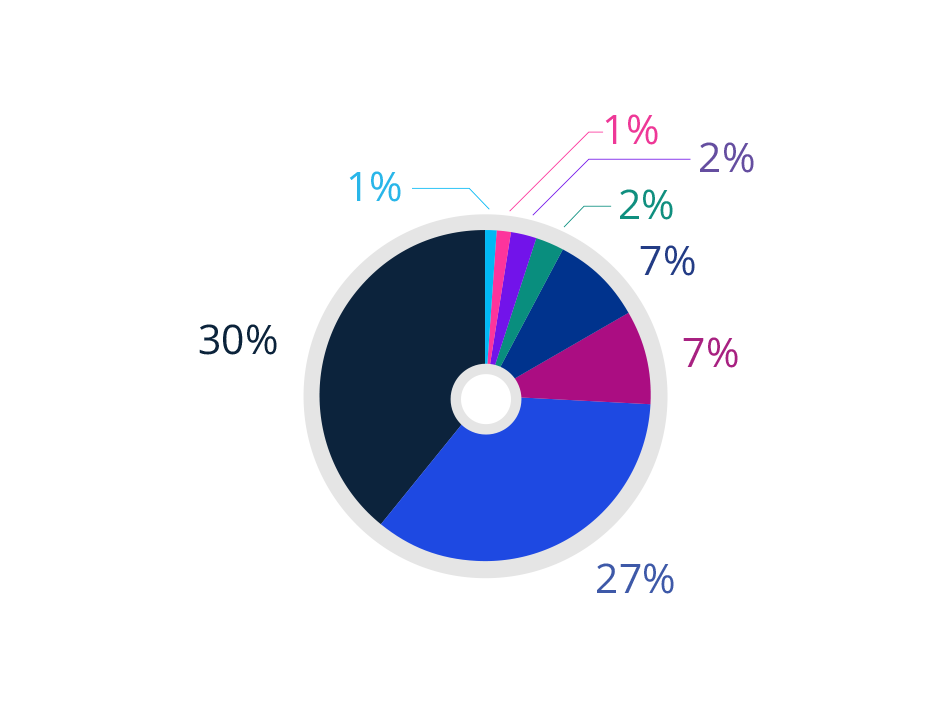
Gender / Firm-wide
40:40:20 requires us to have a minimum of 40% female colleagues and 40% male colleagues in the relevant population. 20% is flexible and recognises the moving nature of our firm, while setting parameters for us to meet and stay within.
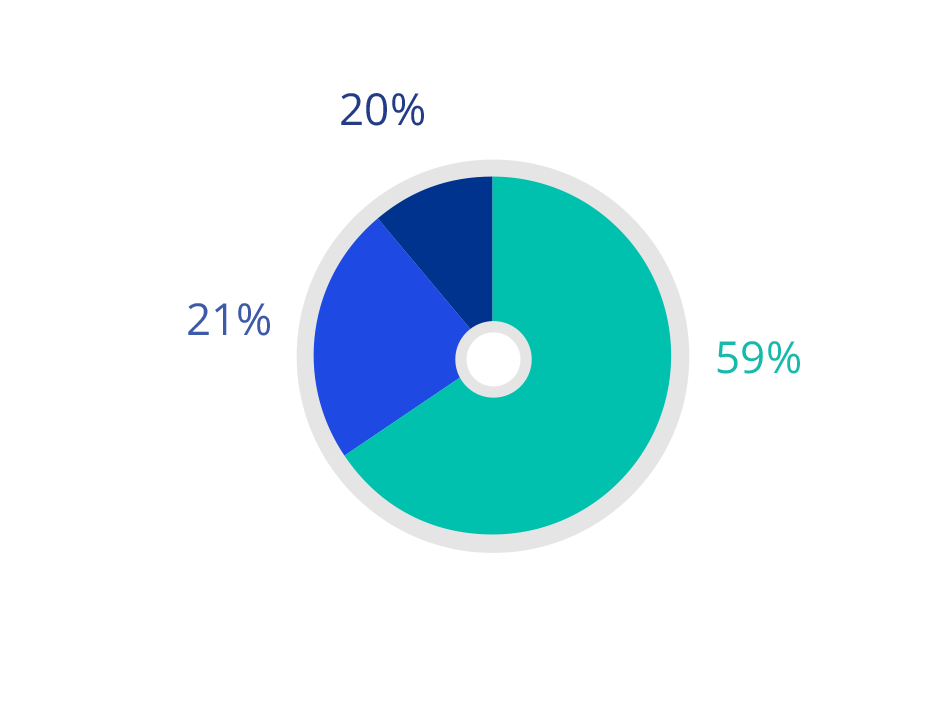
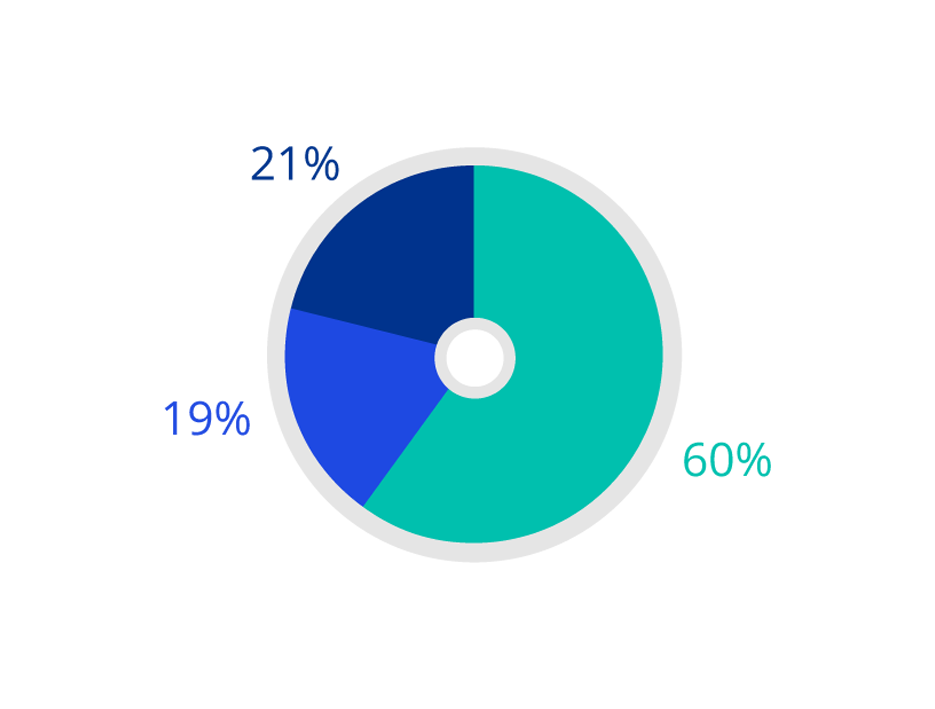
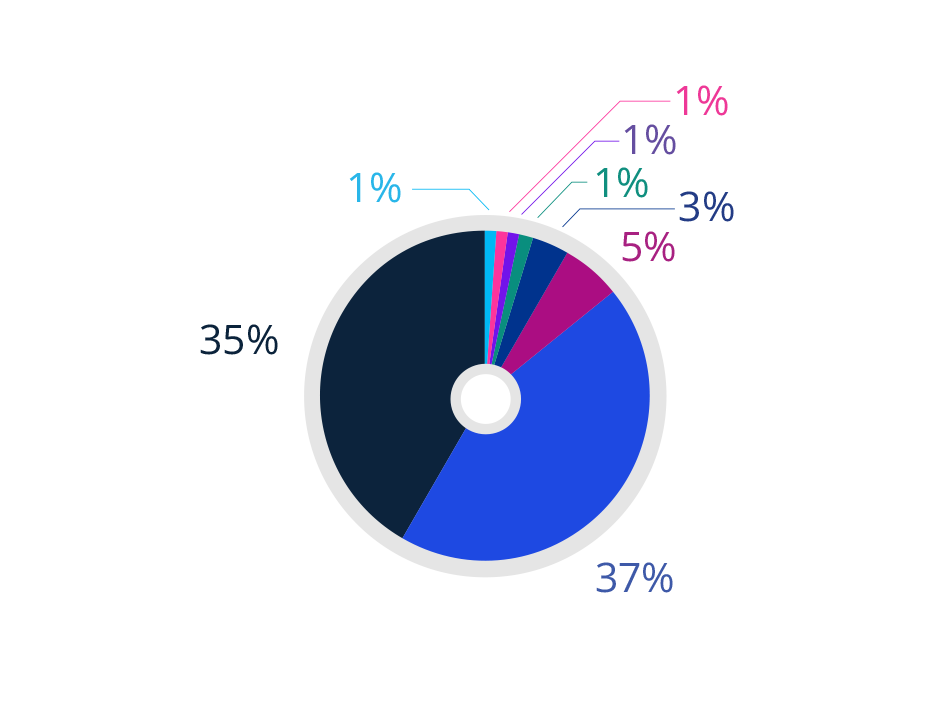
Gender / Partner
40:40:20 requires us to have a minimum of 40% female colleagues and 40% male colleagues in the relevant population. 20% is flexible and recognises the moving nature of our firm, while setting parameters for us to meet and stay within.
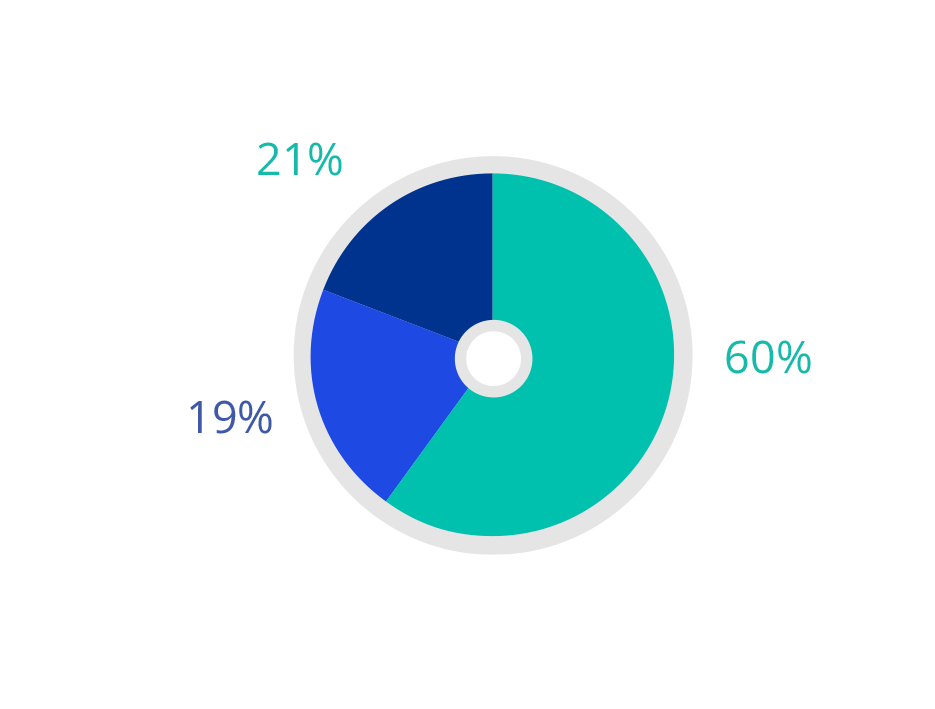
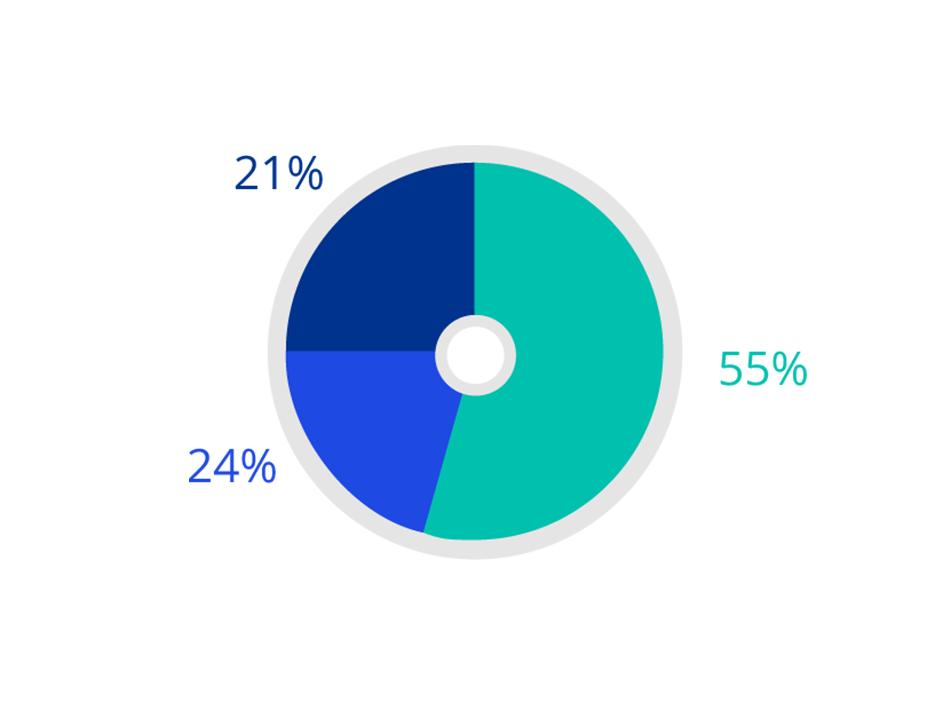
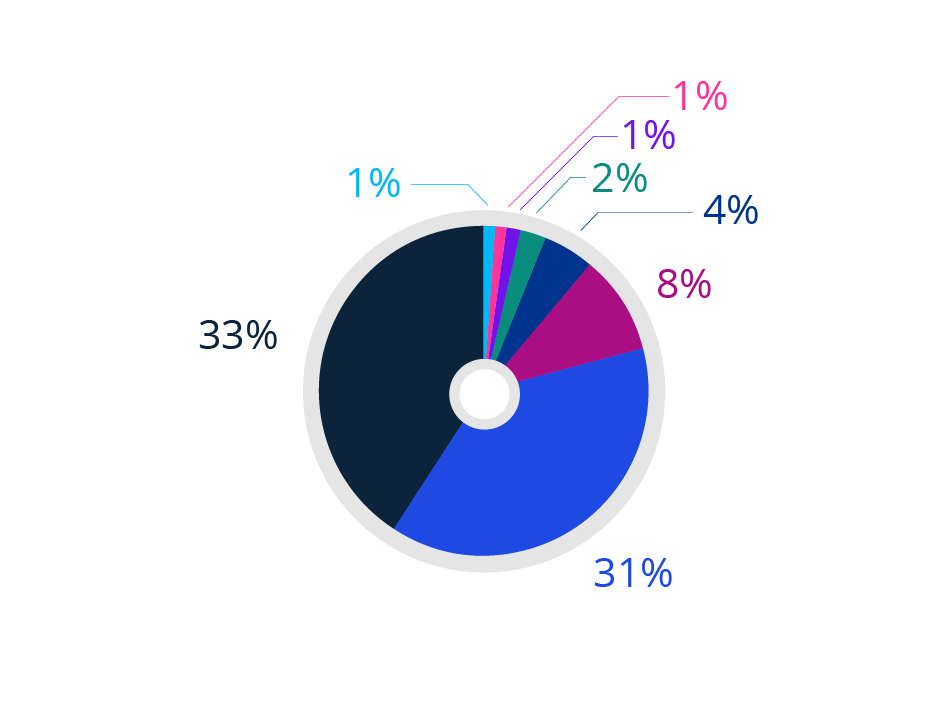
Gender / Director
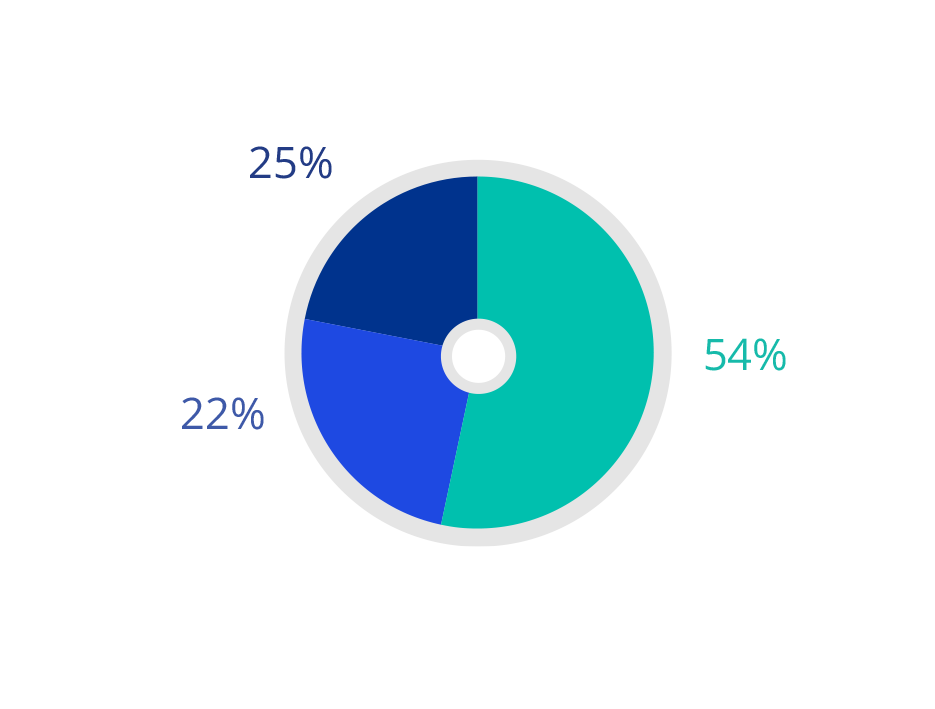
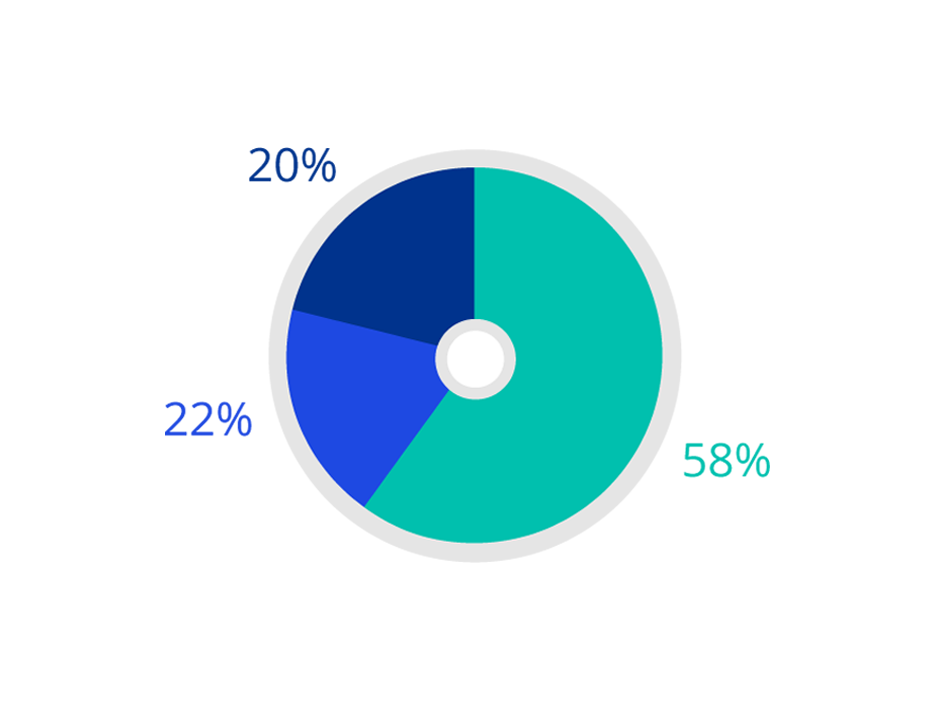
Gender / Senior manager
Gender / Senior representation
Gender / Junior representation
Junior representation includes Manager level and below, as well as our Graduates and Apprentices.
Associate Partners are included in our Partner Diversity reporting. Please see Partner Diversity Report for further detail.
Due to rounding, there may be some instances where not all values total 100.
Data is as at 1 October 2025
Gender / Firm-wide
40:40:20 requires us to have a minimum of 40% female colleagues and 40% male colleagues in the relevant population. 20% is flexible and recognises the moving nature of our firm, while setting parameters for us to meet and stay within.
Gender / Partner
40:40:20 requires us to have a minimum of 40% female colleagues and 40% male colleagues in the relevant population. 20% is flexible and recognises the moving nature of our firm, while setting parameters for us to meet and stay within.
As of FY24, we now include Associate Partners in our Partner diversity reporting.
Gender / Director
Gender / Senior manager
Gender / Senior representation
Senior representation includes Partners, Directors and Senior Managers.
Gender / Junior representation
Junior representation includes Manager level and below, as well as our Graduates and Apprentices.
Associate Partners are included in our Partner Diversity reporting. Please see Partner Diversity Report for further detail.
Due to rounding, there may be some instances where not all values total 100.
Data is as at 1 October 2024
Gender / Firm-wide
40:40:20 requires us to have a minimum of 40% female colleagues and 40% male colleagues in the relevant population. 20% is flexible and recognises the moving nature of our firm, while setting parameters for us to meet and stay within.
Gender / Partner
40:40:20 requires us to have a minimum of 40% female colleagues and 40% male colleagues in the relevant population. 20% is flexible and recognises the moving nature of our firm, while setting parameters for us to meet and stay within.
Gender / Director
Gender / Senior manager
Gender / Senior representation
Senior representation includes Partners, Directors and Senior Managers.
Gender / Junior representation
Junior representation includes Manager level and below, as well as our Graduates and Apprentices.
Associate Partners are included in our Partner Diversity reporting. Please see Partner Diversity Report for further detail.
Due to rounding, there may be some instances where not all values total 100.
Data is as at 1 October 2023
Average age Firm-wide / 34.7
Average age Partner / 47.7
Average age Director / 43.4
Average age Senior manager / 40
Average age Senior representation / 42.2
Average age Junior representation / 31.2
Data is as at 1 October 2025
Average age Firm-wide / 34.5
Average age Partner / 47.4
Average age Director / 43.3
Average age Senior manager / 39.8
Average age Senior representation / 42
Average age Junior representation / 31.1
Data is as at 1 October 2024
Average age Firm-wide / 33.9
Average age Partner / 47.3
Average age Director / 43
Average age Senior manager / 39.6
Average age Senior representation / 41.8
Average age Junior representation / 30.8
Data is as at 1 October 2023
Ethnic minority / Firm-wide
Ethnic minority / Partner
Ethnic minority / Director
Ethnic minority / Senior manager
Ethnic minority / Senior representation
Ethnic minority / Junior representation
Data is as at 1 October 2025
Ethnic minority / Firm-wide
Ethnic minority / Partner
Ethnic minority / Director
Ethnic minority / Senior manager
Ethnic minority / Senior representation
Senior representation includes Partners, Directors and Senior Managers.
Ethnic minority / Junior representation
Junior representation includes Manager level and below, as well as our Graduates and Apprentices.
Data is as at 1 October 2024
Ethnic minority / Firm-wide
Ethnic minority / Partner
Ethnic minority / Director
Ethnic minority / Senior manager
Ethnic minority / Senior representation
Senior representation includes Partners, Directors and Senior Managers.
Ethnic minority / Junior representation
Junior representation includes Manager level and below, as well as our Graduates and Apprentices.
Data is as at 1 October 2023
Associate Partners are included in our Partner Diversity reporting. Please see Partner Diversity Report for further detail.
Due to rounding, there may be some instances where not all values total 100.
Black Heritage / Firm-wide
Black Heritage / Partner
Black Heritage / Director
Black Heritage / Senior Manager
Black Heritage / Senior representation
Senior representation includes Partners, Directors and Senior Managers.
Black Heritage / Junior representation
Junior representation includes Manager level and below, as well as our Graduates and Apprentices.
Black Heritage / Not disclosed (including prefer not to say and no declaration made)
Data is as at 1 October 2025
Black Heritage / Firm-wide
Black Heritage / Partner
Historic data not available.
Historic data not available.
Black Heritage / Senior representation
Senior representation includes Partners, Directors and Senior Managers.
Black Heritage / Junior representation
Junior representation includes Manager level and below, as well as our Graduates and Apprentices.
Data is as at 1 October 2024
Black Heritage / Firm-wide
Black Heritage / Partner
Historic data not available.
Historic data not available.
Black Heritage / Senior representation
Senior representation includes Partners, Directors and Senior Managers.
Black Heritage / Junior representation
Junior representation includes Manager level and below, as well as our Graduates and Apprentices.
Not disclosed data for 2023 is now included alongisde black and non-black heritage for each group.
Data is as at 1 October 2023
Associate Partners are included in our Partner Diversity reporting. Please see Partner Diversity Report for further detail.
Due to rounding, there may be some instances where not all values total 100.
Lesbian, Gay & Bisexual / Firm-wide
Lesbian, Gay & Bisexual / Partner
Lesbian, Gay & Bisexual / Director
Lesbian, Gay & Bisexual / Senior Manager
Lesbian, Gay & Bisexual / Senior representation
Senior representation includes Partners, Directors and Senior Managers.
Lesbian, Gay & Bisexual / Junior representation
Junior representation includes Manager level and below, as well as our Graduates and Apprentices.
Lesbian, Gay & Bisexual / Not disclosed (including prefer not to say and no declaration made)
Data is as at 1 October 2025
Lesbian, Gay & Bisexual / Firm-wide
Due to rounding, percentages may not add up to 100%
Lesbian, Gay & Bisexual / Partner
Historic data not available.
Historic data not available.
Lesbian, Gay & Bisexual / Senior representation
Senior representation includes Partners, Directors and Senior Managers.
Lesbian, Gay & Bisexual / Junior representation
Junior representation includes Manager level and below, as well as our Graduates and Apprentices.
Data is as at 1 October 2024
Lesbian, Gay & Bisexual / Firm-wide
Lesbian, Gay & Bisexual / Partner
Historic data not available.
Historic data not available.
Lesbian, Gay & Bisexual / Senior representation
Senior representation includes Partners, Directors and Senior Managers.
Lesbian, Gay & Bisexual / Junior representation
Junior representation includes Manager level and below, as well as our Graduates and Apprentices.
Not disclosed data for 2023 is now included alongisde Lesbian, Gay and Bisexual and Non-Lesbian, Gay and Bisexual for each group.
Data is as at 1 October 2023
Associate Partners are included in our Partner Diversity reporting. Please see Partner Diversity Report for further detail.
Due to rounding, there may be some instances where not all values total 100.
Disability / Firm-wide
Disability / Partner
Disability / Director
Disability / Senior manager
Disability / Senior representation
Senior representation includes Partners, Directors and Senior Managers.
Disability / Junior representation
Junior representation includes Manager level and below, as well as our Graduates and Apprentices.
Disability / Not disclosed (including prefer not to say and no declaration made)
Data is as at 1 October 2025
Disability / Firm-wide
Due to rounding, percentages may not add up to 100%
Disability / Partner
Historic data not available.
Historic data not available.
Disability / Senior representation
Senior representation includes Partners, Directors and Senior Managers.
Disability / Junior representation
Junior representation includes Manager level and below, as well as our Graduates and Apprentices.
Data is as at 1 October 2024
Disability / Firm-wide
Disability / Partner
Historic data not available.
Historic data not available.
Disability / Senior representation
Senior representation includes Partners, Directors and Senior Managers.
Disability / Junior representation
Junior representation includes Manager level and below, as well as our Graduates and Apprentices.
Not disclosed data for 2023 is now included alongside Disabled or long-term condition and non-disabled or long-term condition for each group
Data is as at 1 October 2023
Associate Partners are included in our Partner Diversity reporting. Please see Partner Diversity Report for further detail.
Due to rounding, there may be some instances where not all values total 100.
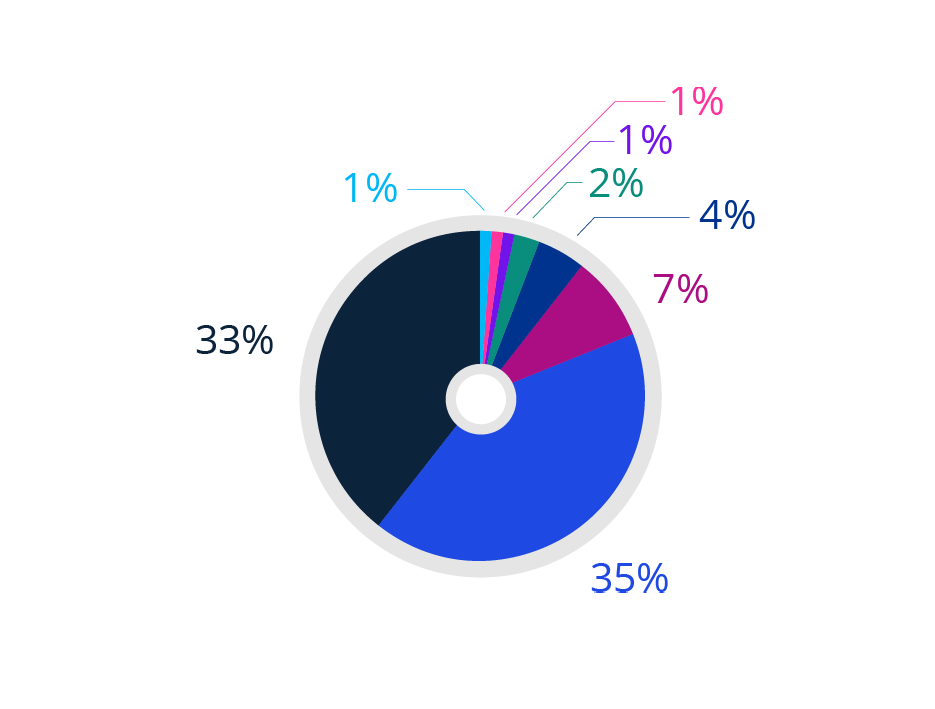
Representation by socio-economic background category FY25
Higher
Intermediate
Lower
Representation by socio-economic background category FY25
Higher
Intermediate
Lower
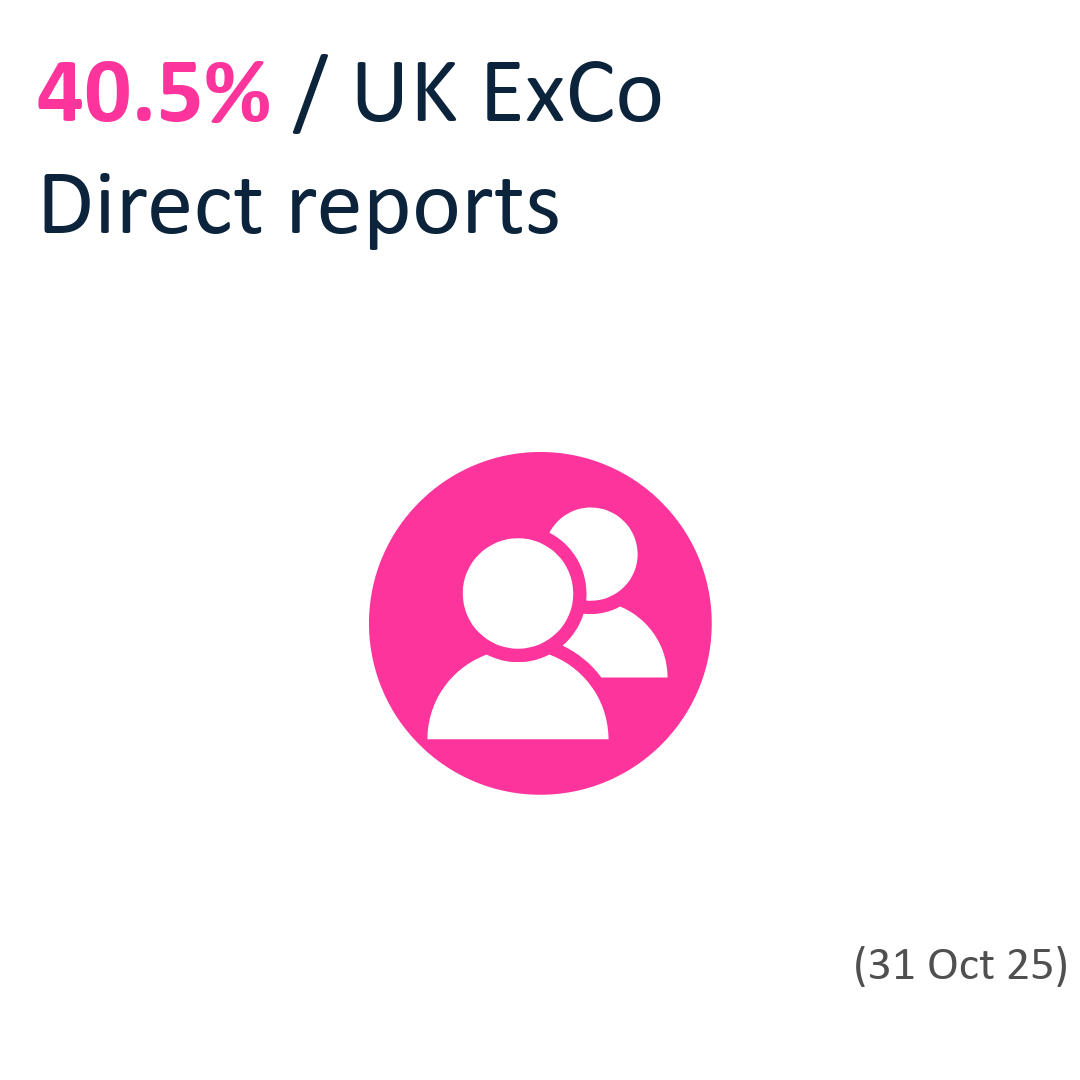
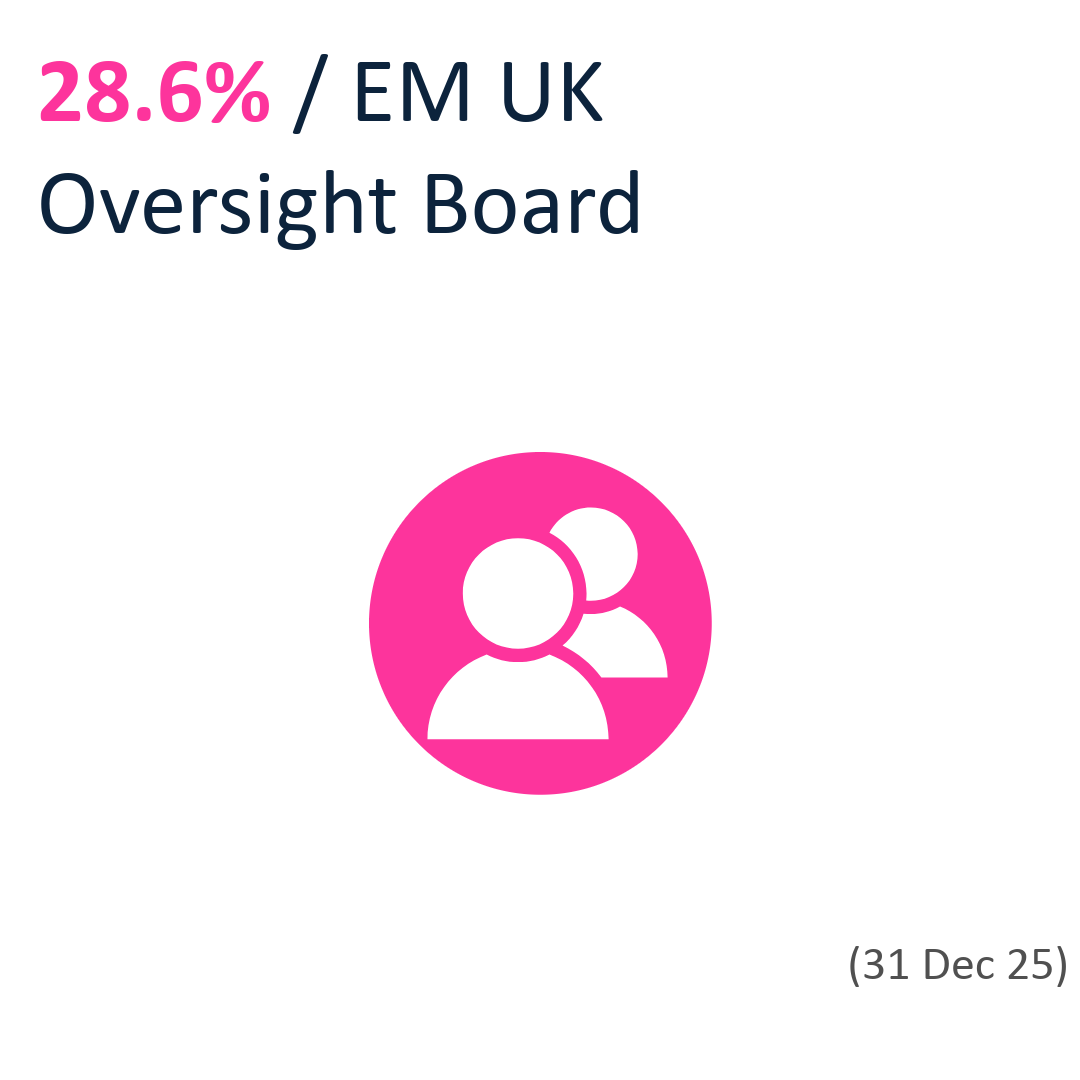
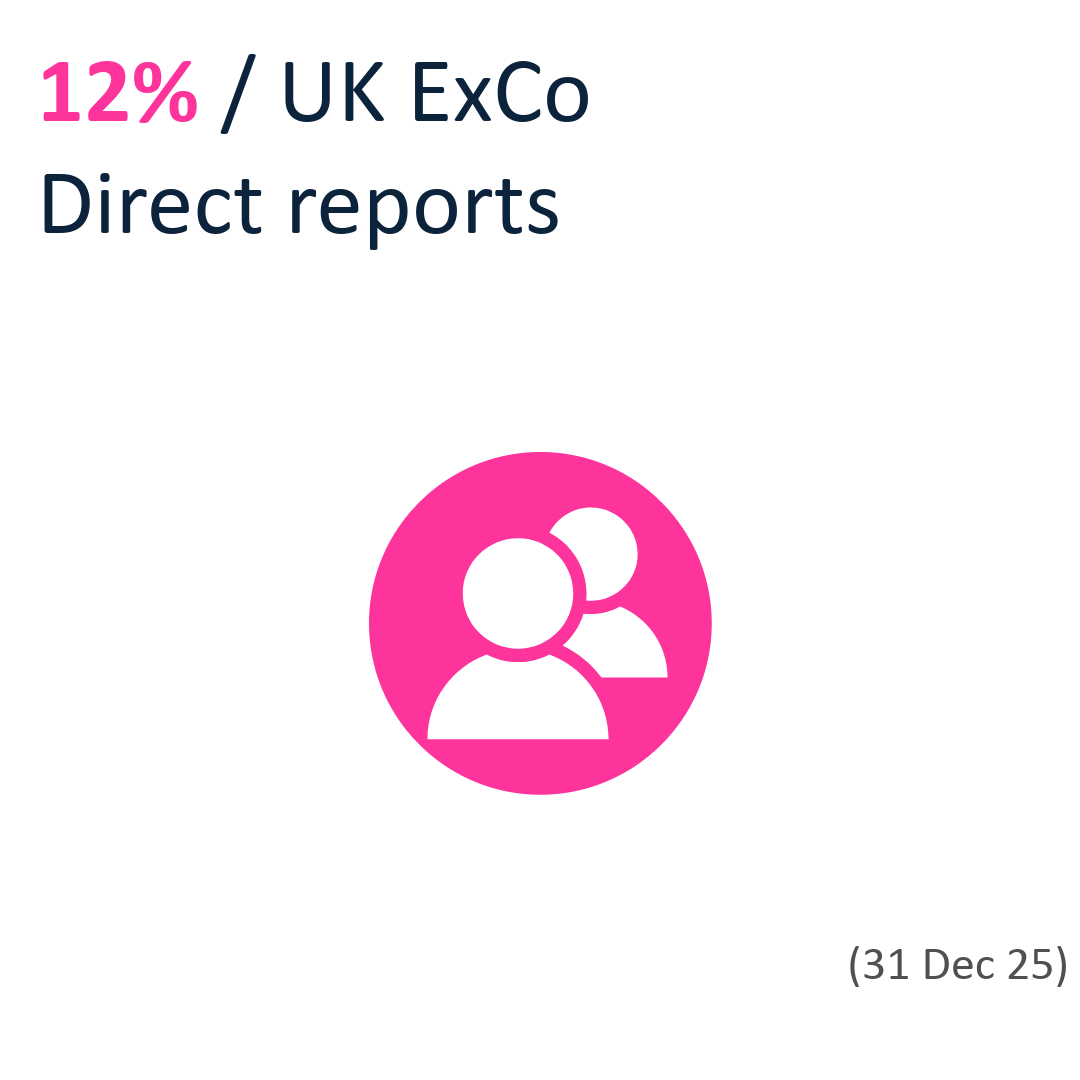
2030 target: 29% lower socio-economic background
Representation by socio-economic background category FY25
Higher
Intermediate
Lower
Representation by socio-economic background category FY25
Higher
Intermediate
Lower
Representation by socio-economic background category FY25
Higher
Intermediate
Lower
Senior representation includes Partners, Directors and Senior Managers.
Representation by socio-economic background category FY25
Higher
Intermediate
Lower
Junior representation includes Manager level and below, as well as our Graduates and Apprentices.
Data is as at 1 October 2025
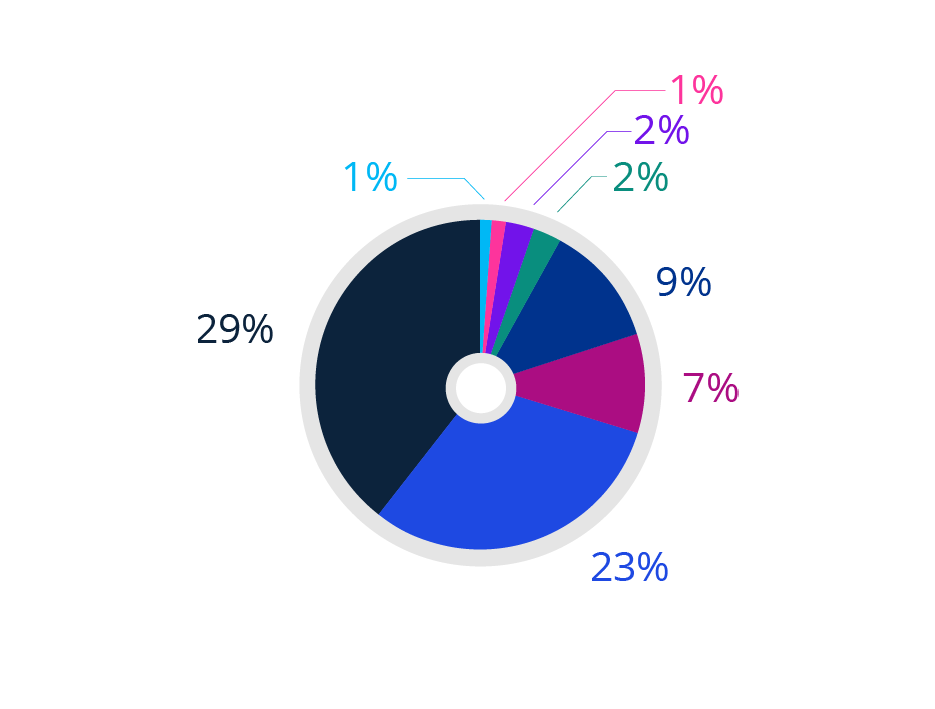
Representation by socio-economic background category FY24
Higher
Intermediate
Lower
Representation by socio-economic background category FY24

Higher
Intermediate
Lower
2030 target: 29% lower socio-economic background
As of FY24, we now include Associate Partners in our Partner diversity reporting.
Historic data not available.
Historic data not available.
Representation by socio-economic background category FY24
Higher
Intermediate
Lower
Senior representation includes Partners, Directors and Senior Managers.
Representation by socio-economic background category FY24
Higher
Intermediate
Lower
Junior representation includes Manager level and below, as well as our Graduates and Apprentices.
Data is as at 1 October 2024
Representation by socio-economic background category FY23
Higher
Intermediate
Lower
Representation by socio-economic background category FY23
Higher
Intermediate
Lower
2030 target: 29% lower socio-economic background
Historic data not available.
Historic data not available.
Representation by socio-economic background category FY23
Higher
Intermediate
Lower
Senior representation includes Partners, Directors and Senior Managers.
Representation by socio-economic background category FY23
Higher
Intermediate
Lower
Junior representation includes Manager level and below, as well as our Graduates and Apprentices.
Data is as at 1 October 2023
Our reporting descriptions and methodology is based on guidance from social equality experts, the Bridge Group. We use parental occupation as our measure of socio-economic background. This is based on The National Statistics Socio-Economic classification, which identifies the occupation of the highest earner in your household at age 14 as the most robust indicator of socio-economic background. Low socio-economic backgrounds are defined as NS-SEC 5, 6 and 7 occupations. Examples include receptionists, electricians, plumbers, butchers and van drivers.
Associate Partners are included in our Partner Diversity reporting. Please see Partner Diversity Report for further detail.
Due to rounding, there may be some instances where not all values total 100.
Representation religion background category FY25
Other
Christian
No Religion
Sikh
Jewish
Muslim
Hindu
Buddhist
Representation religion background category FY25

Other
Christian
No Religion
Sikh
Jewish
Muslim
Hindu
Buddhist
Representation religion background category FY25
Other
Christian
No Religion
Sikh
Jewish
Muslim
Hindu
Buddhist
Representation religion background category FY25
Other
Christian
No Religion
Sikh
Jewish
Muslim
Hindu
Buddhist
Representation religion background category FY25
Other
Christian
No Religion
Sikh
Jewish
Muslim
Hindu
Buddhist
Senior representation includes Partners, Directors and Senior Managers.
Representation religion background category FY25
Other
Christian
No Religion
Sikh
Jewish
Muslim
Hindu
Buddhist
Data is as at 1 October 2025
Historic data not available.
Historic data not available.
Associate Partners are included in our Partner Diversity reporting. Please see Partner Diversity Report for further detail.
Due to rounding, there may be some instances where not all values total 100.
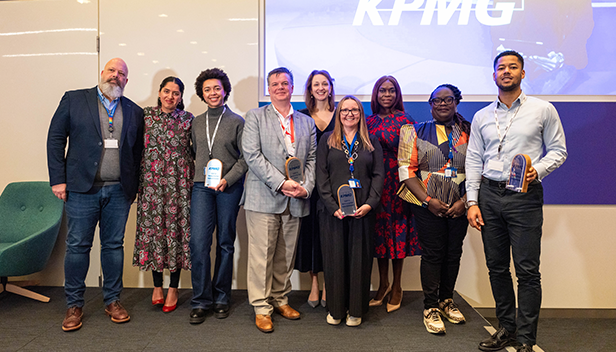
Awards and accreditations
Our Inclusion, Diversity and Equity plan
Our IDE plan - Our KPMG: A fairer future for all, is designed to create accountable leaders, an inclusive environment and equitable experiences. Explore more on our activities below.
Accountable leaders
Our leaders are committed to driving change and are held accountable with set targets and action plans for their respective areas, which they’re measured against regularly. We’ve continued to enhance how we embed IDE metrics into leadership scorecards driving further accountability for all leaders.
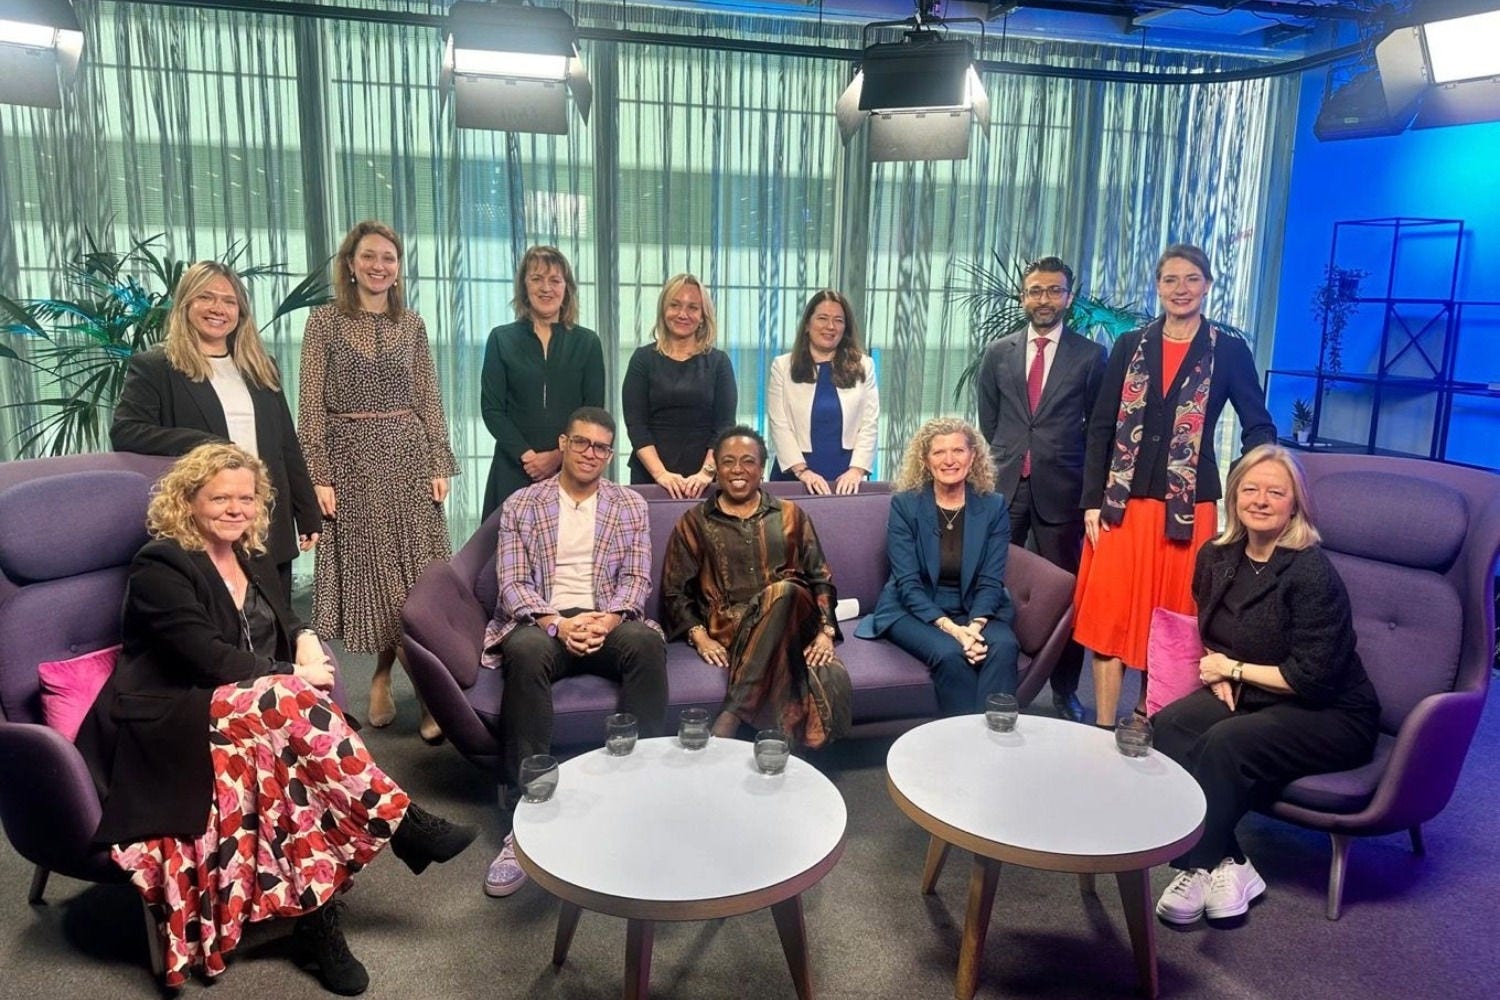
Our IDE Council launched in October 2024. It consolidates leaders driving IDE activity across our business areas and through our employee networks into a centrally governed group. The Council acts as a vital business consultation forum, providing input on IDE initiatives to ensure they meet the needs of all colleagues across all business areas.
At partner level, we are investing in inclusive leadership learning, to help drive visible allyship, authentic leadership and to support them to build a sense of belonging across their teams. And we’re driving greater leadership engagement with our Employee Networks, to enhance their understanding and support of historically underrepresented groups’ lived experience. This has been important throughout 2025 as we continue to navigate complex events across the UK and globally together, with understanding, care and empathy, providing community and safe spaces for everyone.
Many of our leaders are also involved with charitable foundations, mentoring initiatives and education programmes to support communities on this agenda.
Find out more about our specific activities below in the sections below.
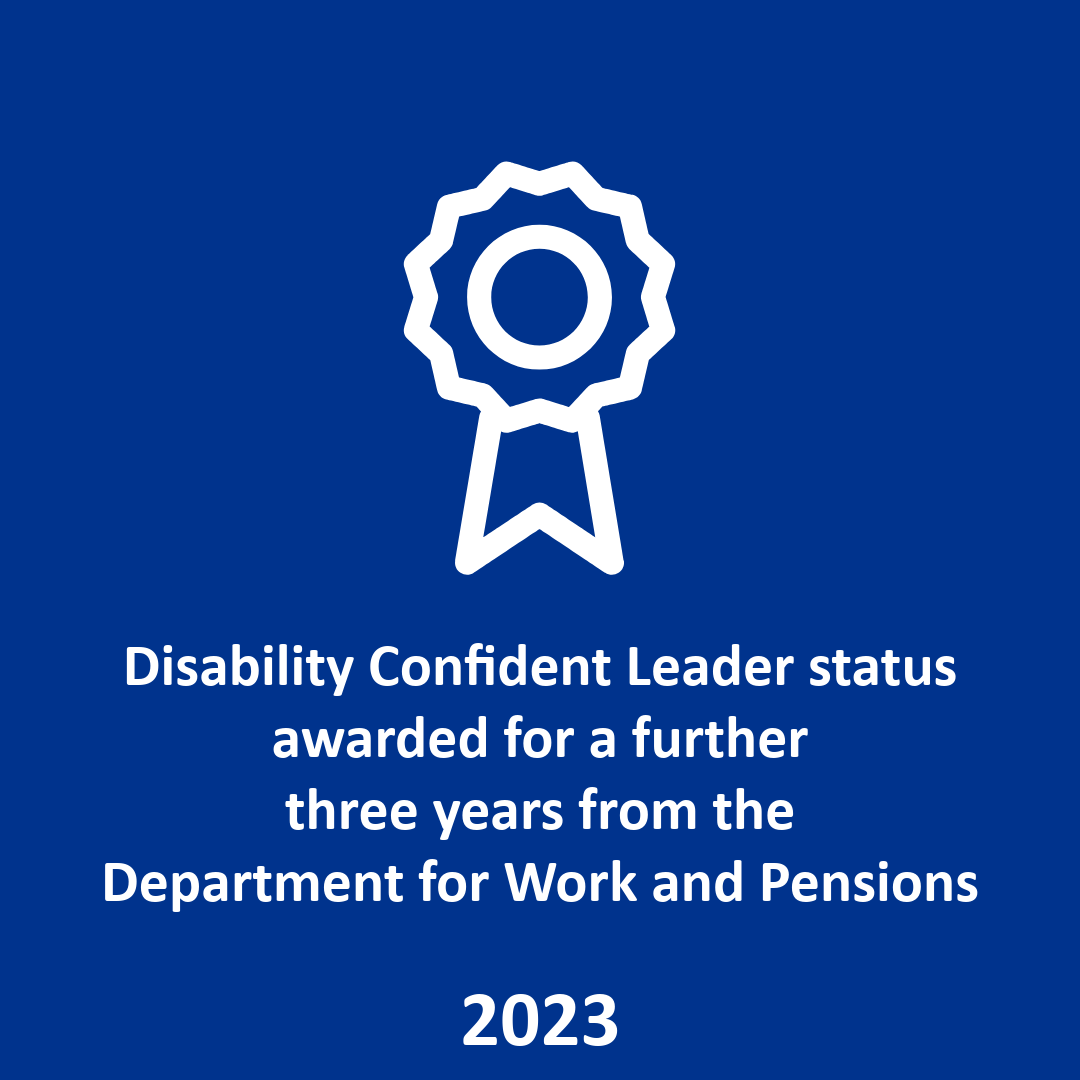
We're a Disability Confident Leader, partner member of the Business Disability Forum, founding members of the Mind Forward Alliance and Neurodiversity in Business, Signatory to the Working with Cancer pledge, RNIB Visibly Better employer and global signatory to the Valuable 500.
One of our Partners is a senior representative on the Department for Work and Pensions (DWP) Disability Confident Business Leaders Group and our colleagues’ leadership has been recognised externally with Emily Carlson and Neil Eustice winning awards for their work on digital accessibility.
You can hear more about the Visibly Better standard from our colleagues here:
We’re a signatory of the Business in the Community (BITC) Race at Work Charter, Change the Race Ratio and Black Talent Charter.
Our leaders have been recognised externally for their role in supporting and championing Ethnic minority inclusion.
In 2025 Richard Iferenta, Vice Chair and sponsor of KPMG’s African and Caribbean Network, and Inderpal Dhami, Partner and sponsor of our Sikh Network, were listed in the EMpower Top 100 Ethnic Minority Executive Role Models; Our Group Chief Executive and UK Senior Partner, Jon Holt, was recognised in the advocates list, while Ugochi Onwuanibe was recognised in the Top 100 Future Leaders list. In 2023, UK Chair Bina Mehta was listed in the EMpower Hall of Fame. Richard Iferenta and John McCalla-Leacy have been listed in the Black Powerlist, and Harold Memela Senior Manager – Transformation & Change, won rising star in the Professional Services categories at the 2023 Black British Business Awards.
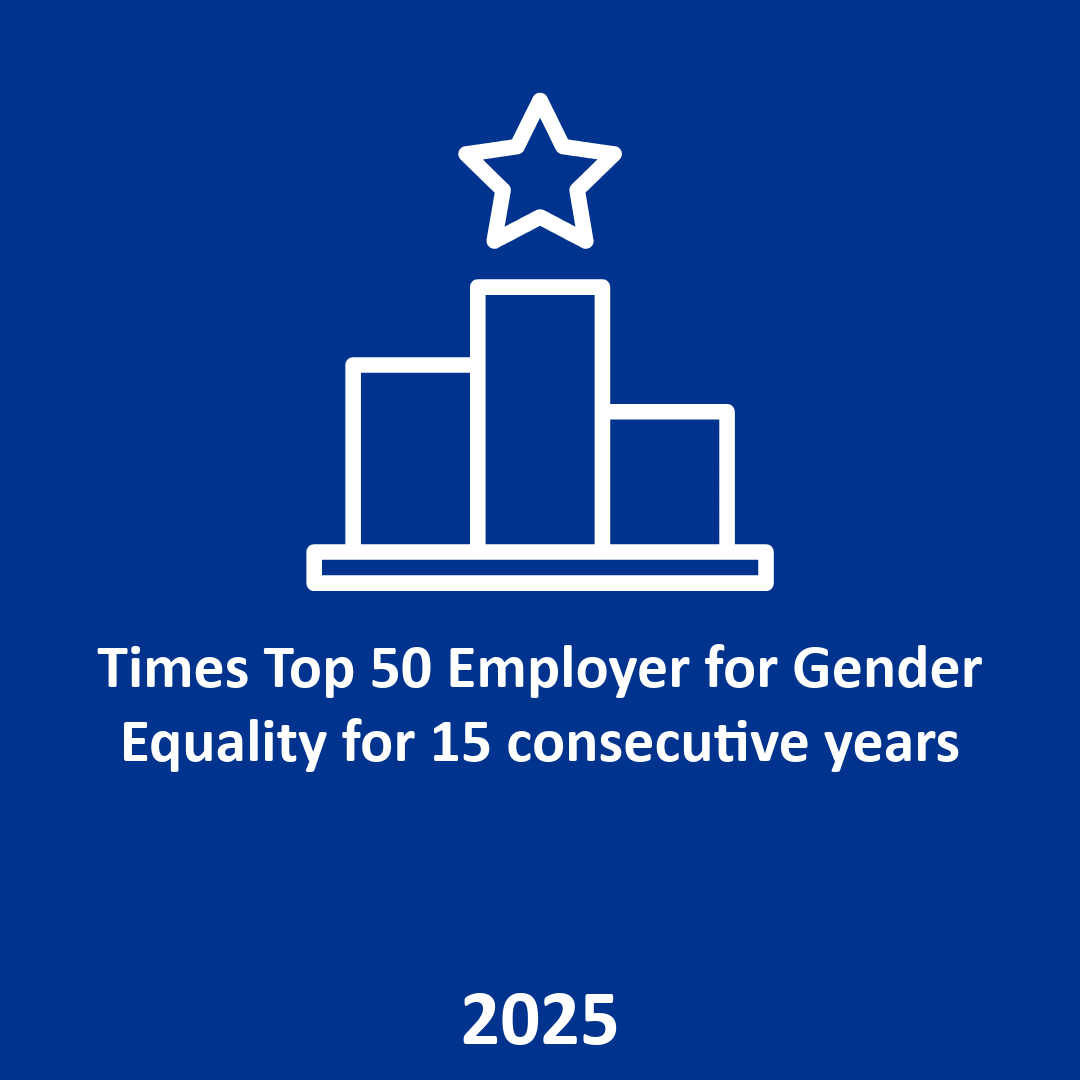
We’re a Times Top 50 Employer for Gender Equality, longstanding co-sponsors of the FTSE Women Leaders Review and a signatory to the HM Treasury Women in Finance Charter.
We signed up to the HM Treasury Women in Finance Charter in September 2017 – a commitment by HM Treasury and signatory firms to promote gender diversity and work together to build a more balanced and fair industry. We publish our progress annually and you can see more about how we are tracking towards our targets in our diversity explorer tool.
Our colleagues have been recognised externally for their leadership in the workplace. In 2025, our Group Chief Executive and UK Senior Partner, Jon Holt, was recognised in the HERoes Advocates list and Anna Purchas, London Office Senior Partner and Vice Chair was named in the 100 Executives list. Jody Zhou was listed in the HERoes Top 100 Future Leaders. In 2024, our Chief People Officer, Karl Edge was recognised in the HERoes Advocates list and Maya Prentis was listed in the HERoes Top 100 Future Leaders.
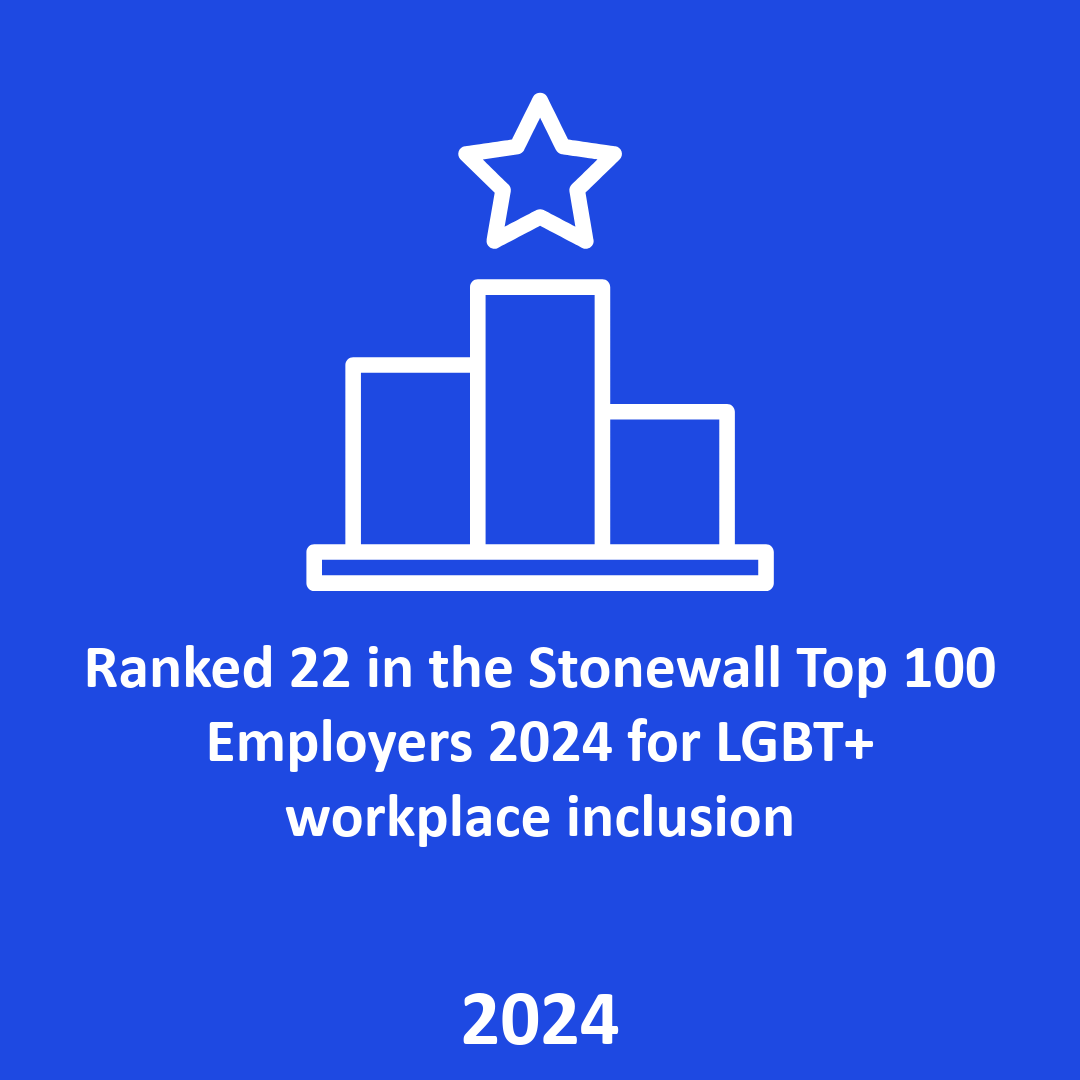
We’re members of the Stonewall Proud Employers scheme and placed in the Workplace Equality Index Top 100 Employers in 2024. Globally we are a signatory to the UN Human Rights Office Standards of Conduct for Business in 2017, tackling discrimination against Lesbian, Gay, Bi, Trans, and Intersex People.
We join forces with LGBT+ networks in other organisations to strengthen our work in this area. We also team up with leading LGBT+ charities, and engage in thought leadership, to help improve the workplace for everyone and the experience for LGBT+ people throughout the UK and beyond.
Our colleagues have been recognised externally for their leadership in the workplace. In 2025 Mel Knight, Partner and allyship sponsor for our Breathe network and IDE Council member was recognised in the Top 5 OUTstanding Advocates Role Model List. In 2024 Kristina Martirosjana and Rachel Bleetman were recognised in the OUTstanding Top 100 Future Leaders list. In 2023 Mel Knight, was awarded ‘LGBT+ Ally’ and Mariana Ceccotti our Breathe network co-chair received an ‘Inspirational Leader’ award at the British LGBT+ awards.
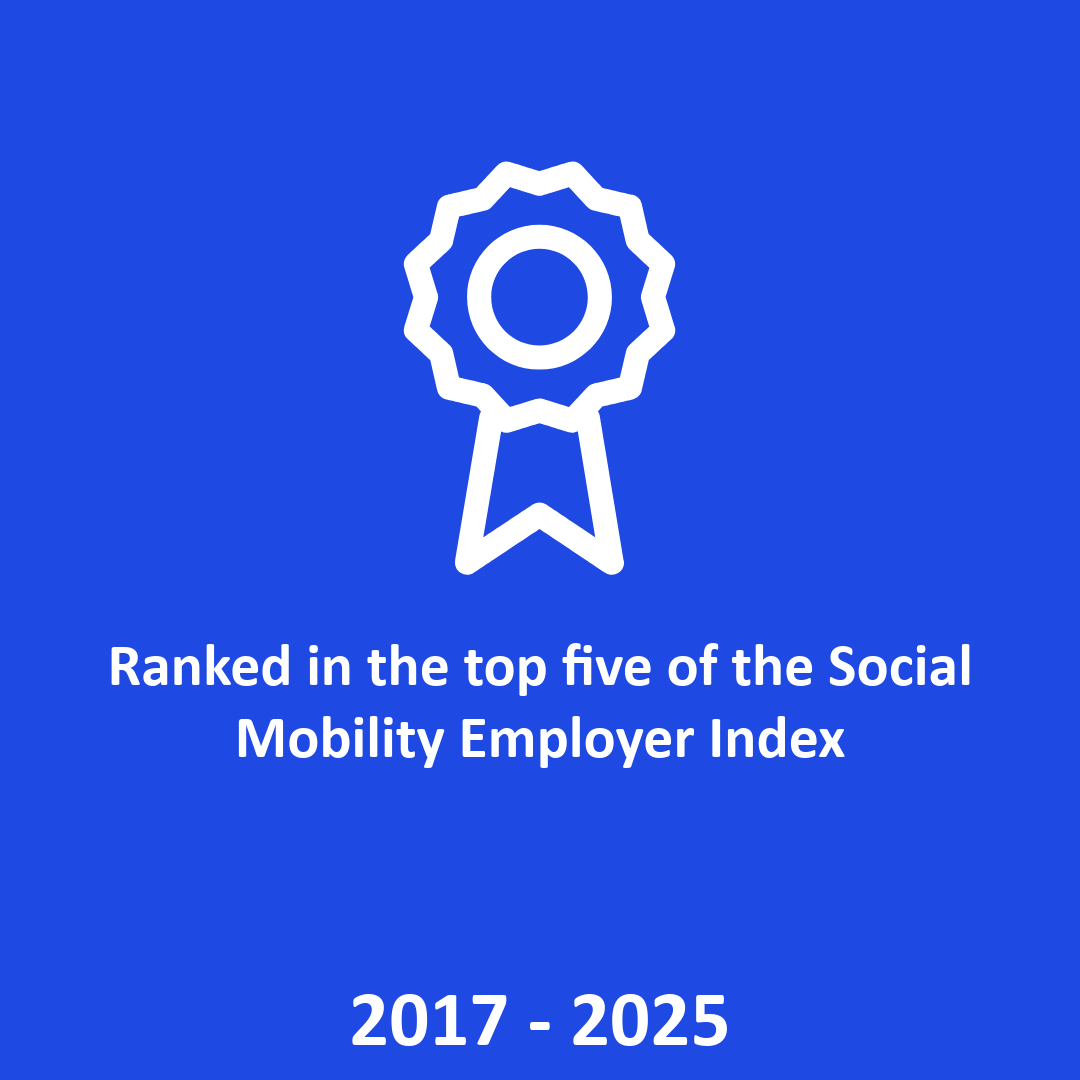
We’re a Social Mobility Employer Index Top 75 Employer, a founding member of Access Accountancy, and a principal partner of the Living Wage Foundation.
Our colleagues have been recognised externally for their leadership in the workplace. Our UK Chair Bina Mehta, Social Mobility Network Partner Sponsor, Jennifer Lee and Network co-chair and founder, David McIntosh, amongst others, have featured in the UK Social Mobility Awards and the Social Mobility List, across several years.
Gender representation
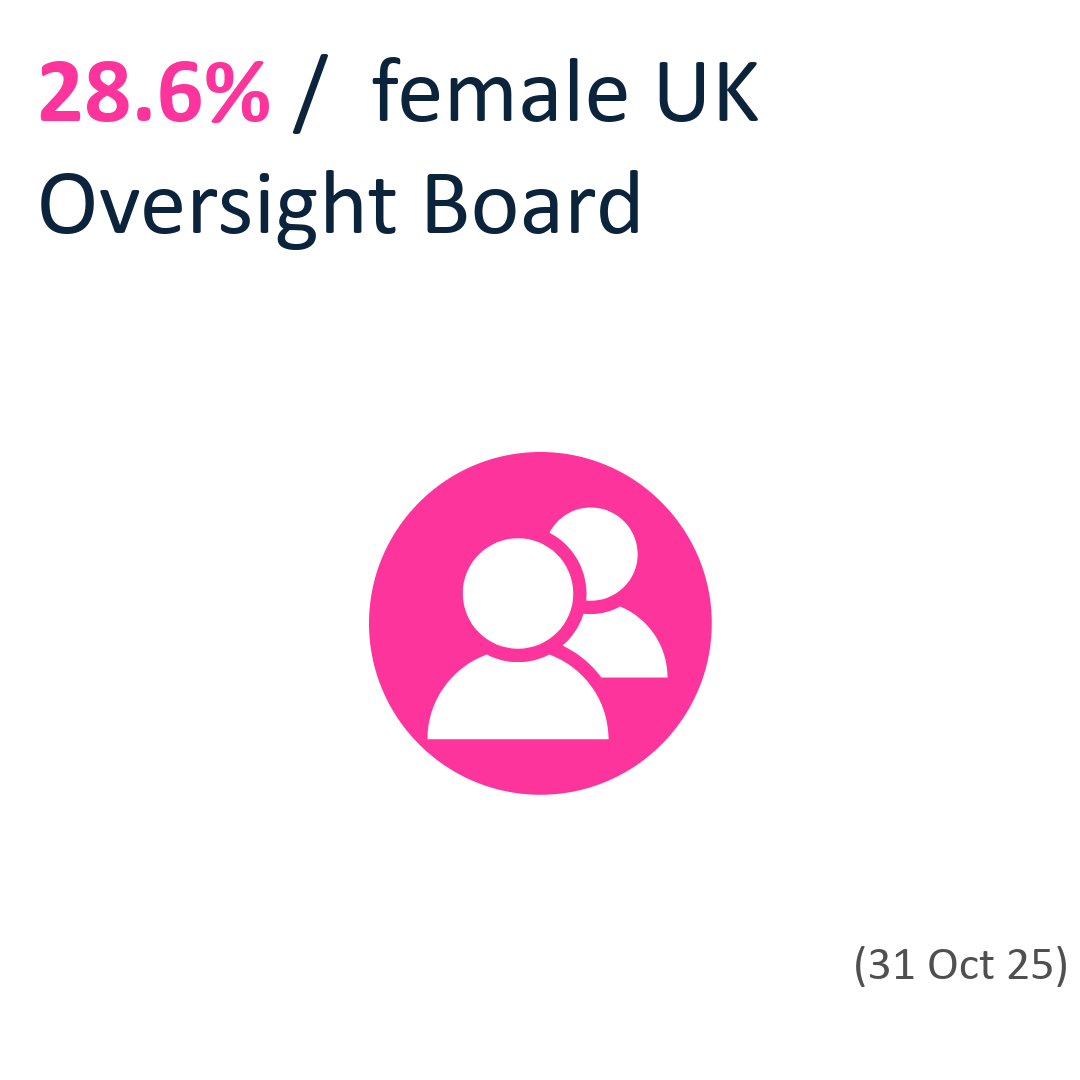
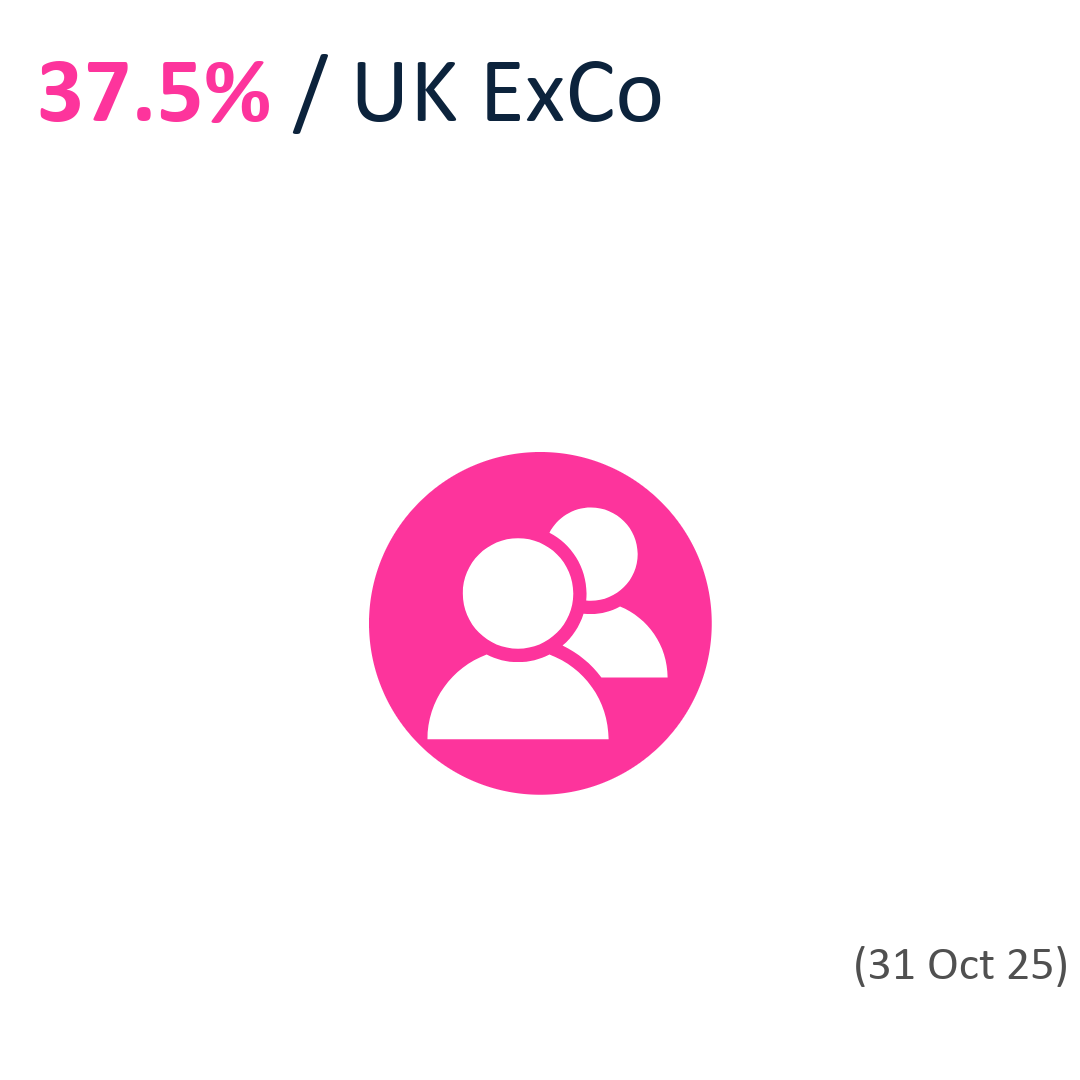
As submitted to the FTSE Women Leaders Review 2025
Ethnic minority representation

As submitted to the Parker Review 2025
Inclusive environment
Our 16 Employee Networks are open to all, providing a sense of community and learning experiences for those who want to enhance their own cultural awareness or become an ally.
We recognise the importance of having champions at a leadership level for historically underrepresented groups. That’s why each of our Employee Networks has at least one KPMG Partner Sponsor.
Throughout the year they host inspirational and educational events helping to raise awareness for, and to celebrate, key moments in the calendar. They also provide us with vital feedback and insight, by representing and voicing our colleagues’ lived experiences.
This year we launched our IDE ambassador community, bringing together colleagues across the business who have taken on informal roles in their local teams on IDE. They act as a vital connection between central teams and colleagues across the UK. They are advocates for change, role models for inclusion and bring our IDE strategy to life.
Our firmwide mandatory IDE training for employees and Partners is built around our colleagues’ lived experience. It is designed to challenge how we see and perceive the world around us, supporting the development of an open, safe and inclusive culture. Our inclusive language guide and agile working and workplace adjustment hubs support our colleagues in our continually evolving workplace. And our IDE policy landscape provide the framework to ensure our people receive fair and equitable treatment where they can come as they are and thrive.
Find out more about our specific activities below in the sections below.
Our Inclusion ID is a living record of adjustments agreed between an employee and their manager and / or required team, to support colleagues in how, when and where they want to work. We have a library of anonymised personal perspectives called “This is me” designed to help colleagues understand the variety of conditions and impairments colleagues have and the different adjustments they require.
From a recruitment perspective, we ensure that candidates requiring additional support or an adjustment have access to specific guidance, via our careers website. Our external recruitment efforts are supported by dedicated disability-focused partnerships with organisations such as MyPlus Consulting, Auticon and Blind in Business.
While we’re committed to creating an inclusive culture within our firm, racial discrimination is sadly something many of our ethnic minority colleagues still face in their everyday lives. We actively listen to their experiences both inside and outside the workplace to help shape our approach and action in this area. We host events that encourage open conversations on this topic, challenge misconceptions and educate colleagues on the actions they can all take to support in this area. This has been particularly important throughout 2025 as we navigate unsettling events in the UK, and more widely across the world, putting colleague safety and wellbeing at the centre of our approach.
Allyship is critically important to this
Over 1,000 people in KPMG have participated in our Black Heritage Allyship Programme – across four cohorts - which pairs people together to mentor, sponsor and learn from each other.
Our Cross-Company Allyship Programme, with a focus on supporting Ethnic Minority talent, has had over 800 participants across 55 organisations. You can learn more about this programme below.
In 2024 we refreshed our IDE mandatory training and launched a new mandatory module on preventing sexual harassment, highlighting the important role we can all play as active bystanders. We have also developed targeted training on domestic abuse, establishing three cohorts of Safety Champions to support colleagues that may be impacted by, or experience, domestic abuse in their lifetime.
Our gender equity plan is supporting us to build an inclusive and supportive culture for women, as well as empowering our people to drive change in our business. Our families policy continues to evolve with enhancements to our maternity, paternity and carers leave provisions. Our tailored approach to wellbeing in the workplace considers our multi-generational workforce with free menstrual products across our UK offices, our menopause support and our range of benefits are all designed to support women at various life stages.
We also offer coaching and resources to support parents before and after returning to work, and throughout their child's life. We also offer enhanced pay for those taking shared parental leave and time off for parents undertaking fertility treatment, or adopting via surrogacy.
We’ve put processes in place to support colleagues who wish to change their name, gender marker and/or title on KPMG systems. We have also provided more guidance for colleagues on adding their pronouns to email signatures and on Teams. Our firm-wide policy documents are inclusive to all and our diversity monitoring questionnaire includes questions that enable our colleagues to disclose their LGBT+ status if they wish, and to help us better understand the diversity make-up of our firm.
From a recruitment perspective, the Student Recruitment team attend Student Pride, supported by our LGBT+ network, to speak with students about the opportunities available at KPMG. The team also run a flagship Pride event in June. This is a virtual event designed for a school and university student audience where attendees hear directly from our people as they share their stories, experiences and insights.
We've provided training to all of our colleagues on socio-economic background and the invisible barriers that exist, to help raise awareness of unconscious bias on an aspect of diversity that is less frequently talked about.
By improving our data insight through new tools and technology and working with a diverse range of suppliers, we’re able to take a more holistic approach to IDE and better consider the impact and access for those from lower socio-economic backgrounds through the intersections of gender, ethnicity and disability. And through pioneering programmes such as New Futures and the opening of the “Redemption Roasters” café in our London office – which provide opportunities to prison leavers – we are supporting some of the hardest to reach and least socially mobile communities.
Across our recruitment processes, we’ve made a number of changes, for example, we use contextual recruitment methods for our graduate and apprentice hiring. This approach places greater focus on an individual’s overall potential and considers academic results in the context in which they were achieved, looking at both socio-economic background as well as any extenuating circumstances.
As part of this, we’ve broadened entry requirements for specific programmes, such as our Technology graduate programmes and are working with a broader range of universities, schools and colleges to widen access.

Our employee networks
Click through to see all 16 of our IDE employee networks.
-

ACN (African and Caribbean Network)
-

BeMindful (Mental Health & Men’s Wellbeing)
-
Breathe (LGBT+)
-

China Club
-

CKPMG (Christians in KPMG)
-

Families Network
-
Forces in the Firm
-

Hindu Network
-

Jewish Network
-

KNOW (KPMG Network of Women)
-

Muslim Network
-

Neurodiversity Network
-
Purple Circle (Disability, long-term conditions, Cancer community)
-
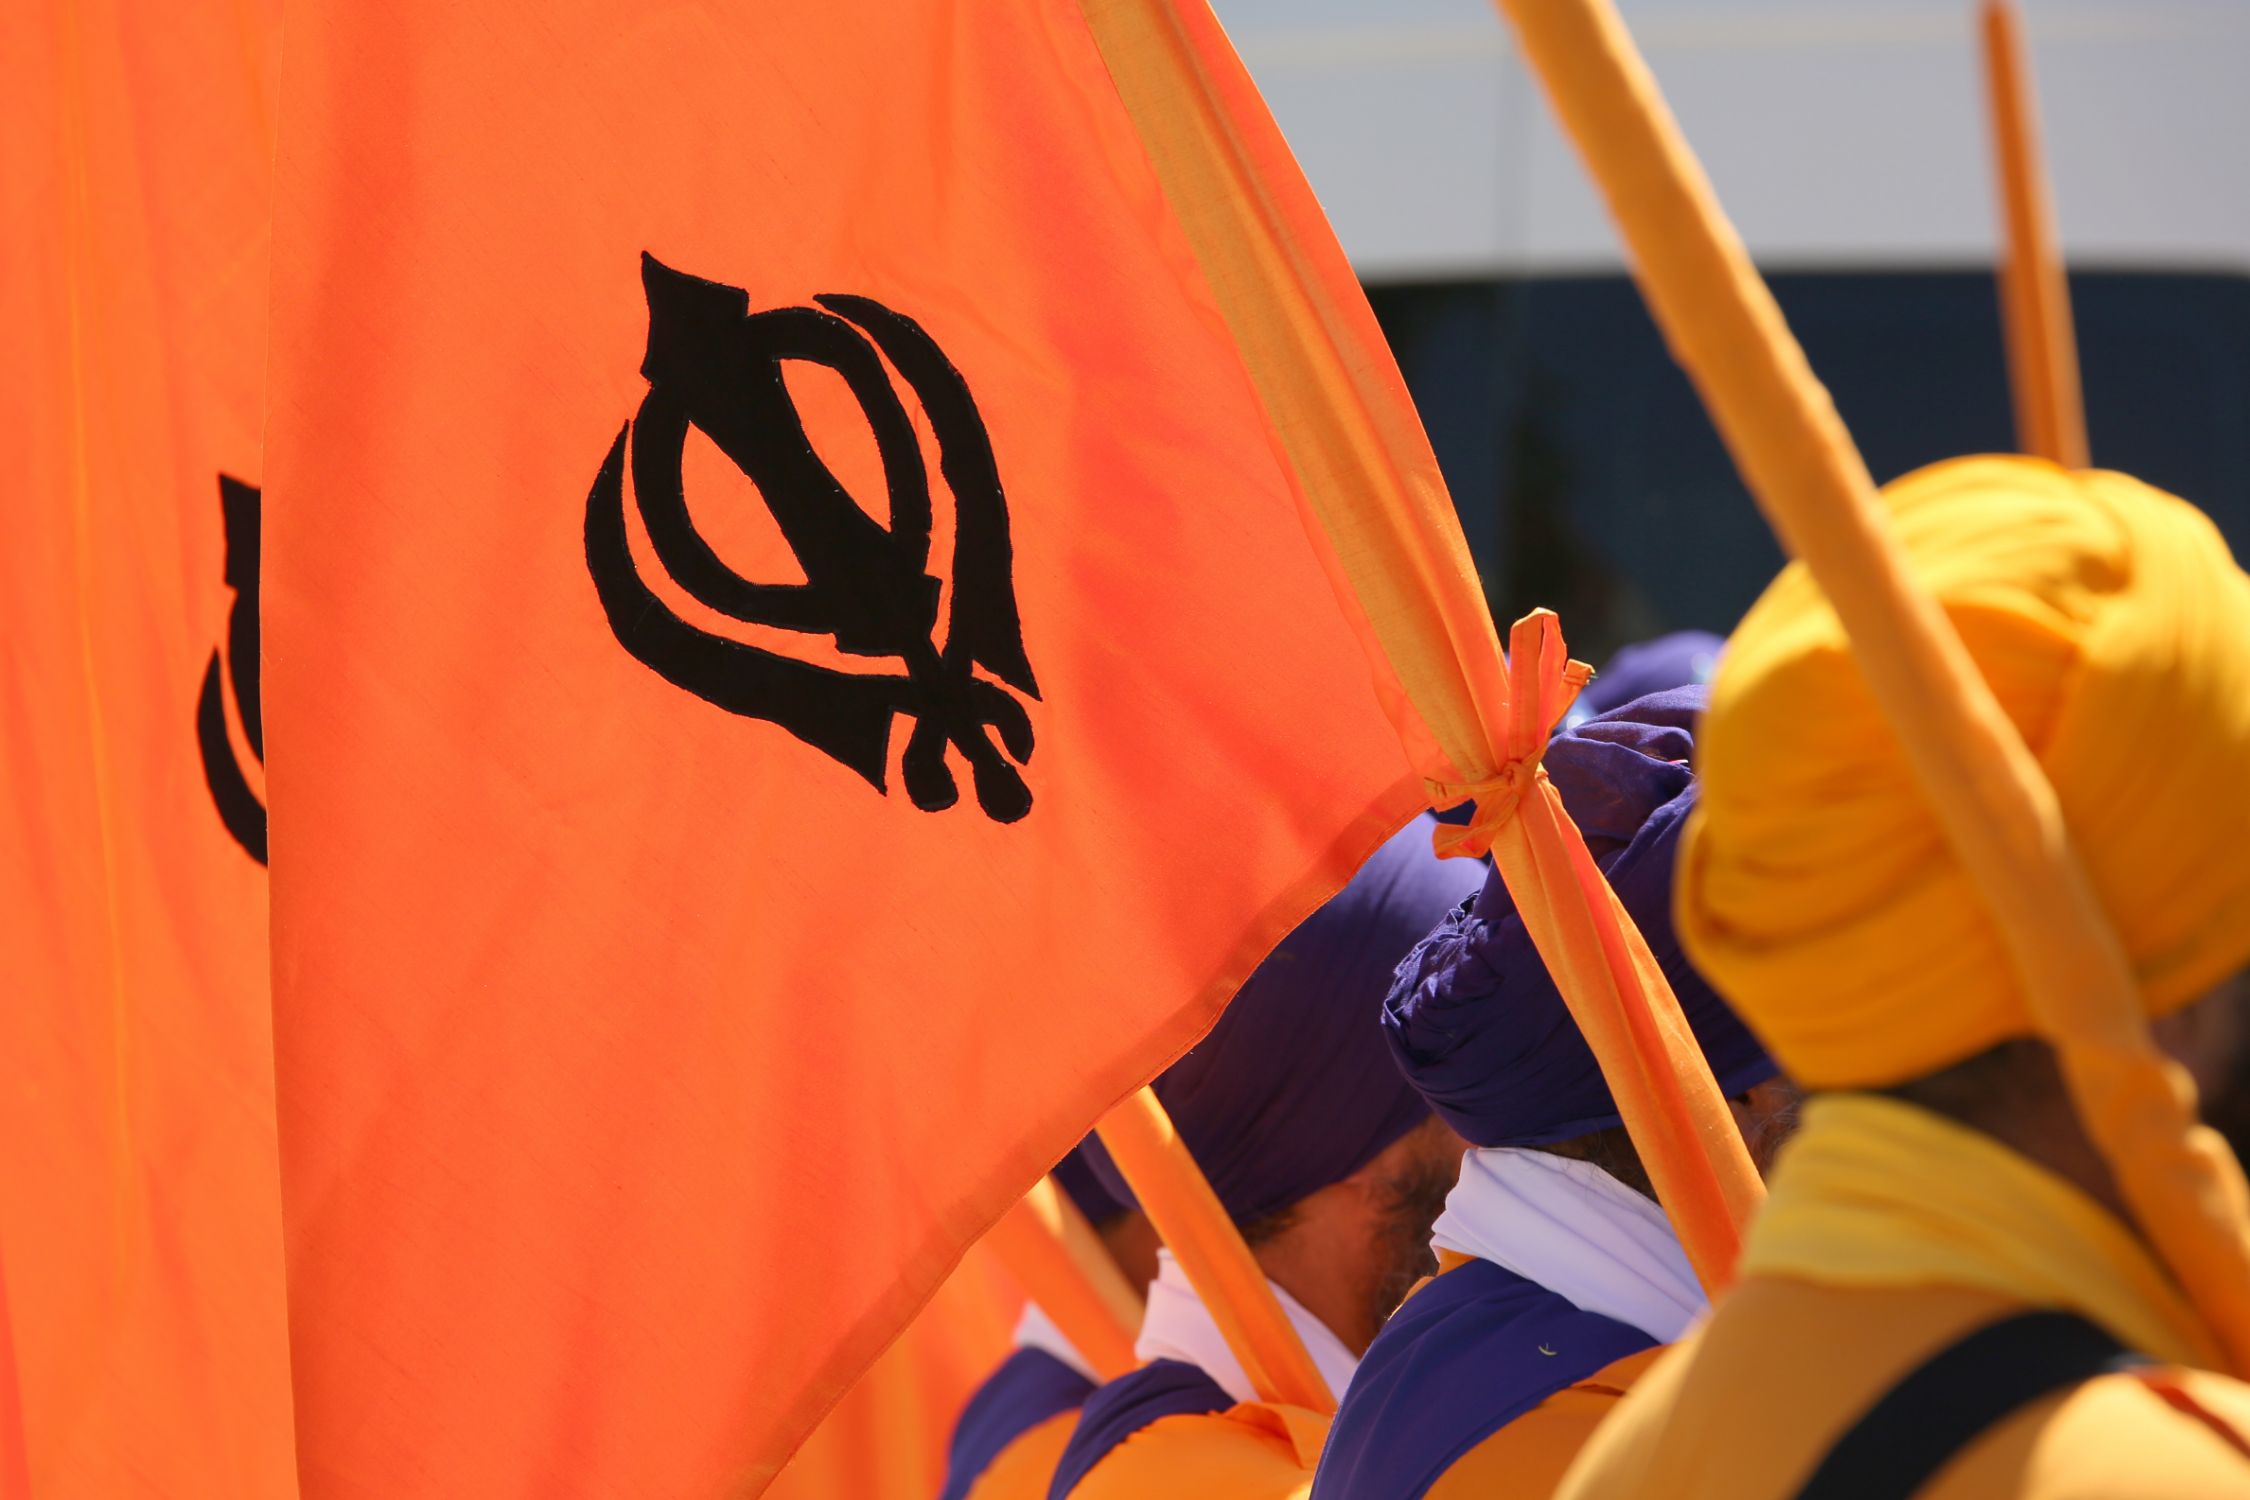
Sikh Network
-

South Asian Network
-

UPbringing
(Social Mobility Network )
Equitable
experiences
We’re committed to addressing systemic barriers to help level the playing field, ensuring equitable access to opportunities and building a fairer future for all. By using our data and evidence base, we’re able to focus our support on specific challenges and barriers. We recognise that historically underrepresented groups need tailored support and that our identities, backgrounds and circumstances are multi-faceted. We use a cross-section of data to take a holistic approach to inclusion, which helps us see the impact of intersectionality.
This approach is embedded across the colleague lifecycle and you can explore more on our activities below.
We’re continuing to invest in student programmes focussed on targeting historically underrepresented groups, such as students of Black heritage, from a low socio-economic background, women or those with a disability or long-term health condition. Our Insight programmes have been designed to help students find out more about working life at KPMG. Through these routes, students can discover more about the work we do, as well as the teams they could join if they choose to embark on a career with us. Find out more about our Insight programmes.
We also work with a number of organisations, such as Access Accountancy and the Social Mobility Foundation, to provide work experience opportunities to students from lower socio-economic backgrounds. Find out more about our Discovery work experience programme.
Our personal development programmes, Inspire and Elevate and our mentoring and allyship programmes, support colleagues to build networks and strengthen self-advocacy and visibility. Learn more about our programmes below.
Across all our people processes, we use the data to measure fairness across promotions, performance, and talent management. There’s still a long way to go, but we know this work is already having impact. Research by The Bridge Group into progression at KPMG demonstrated that over a 5-year period, the majority of our historically underrepresented groups progressed as quickly, if not more so, than their counterparts.
As a firm we’re committed to being transparent about our remuneration and pay gaps. We voluntarily report on our pay gaps against each underrepresented characteristic and in 2021 became one of the first UK businesses to publish our Socio-Economic Background (SEB) pay gaps. Whilst being transparent about where we are is critical to making progress, we know pay gaps are just one part of the picture. What's important is what we do with that data. That's why we continually monitor our progress to understand what’s working and challenge ourselves on where we can go further to focus our efforts and increase representation and inclusivity in our firm.

Find out more about our IDE programmes
-
MAKE
Inspire and Elevate
Customer Experience Excellence Report
In 2024 we launched two new Inclusion, Diversity and Equity (IDE) development programmes, ‘Inspire and Elevate’, which bring together the best of our previous award-winning programmes into a refreshed offering.
The programmes, open to all, with a focus on colleagues from historically underrepresented groups from assistant manager to director, put intersectional colleague experiences at their heart. From design consultations with diverse stakeholders, all the way through to the celebration event, we created the programmes with, and for our colleagues.
We wanted to create an open, safe and inclusive space to highlight the value of our unique experiences. We were keen to ensure this was accessible to colleagues from all areas of the business, exploring personal development topics that were relatable for everyone, including authenticity, creating a growth mindset, resilience and self-belief.
Ethan, a newly promoted Director in our Advisory business, took part in the Elevate programme before he was promoted and you can hear more about his experience of the programme in the video above.
Find out more > -
MAKE
IT’s Her Future
IT’s Her Future marks ten years as KPMG’s flagship programme championing gender equity in technology. What began in 2015 as a small group of colleagues determined to make a difference has grown into our flagship women in tech programme.
Over the last ten years, the programme has had a demonstrable impact and:
• Increased female representation with women now making up 42% of technology roles at KPMG, from 26% in 2015.
• Supported women across KPMG through mentoring and development opportunities.
• Inspired future generations through our outreach in schools and colleges.
• Championed progress by sharing best practices with our clients, advising and supporting them to influence change across the industry.
This progress is driven by clear ambitions: to accelerate KPMG’s journey towards gender balance, strengthen our ability to attract diverse female talent, create an environment where women thrive in technology roles, and lead conversations on how technological change impacts women in work and society. From mentoring and leadership development to early talent outreach and client engagement, IT’S Her Future is a cornerstone of KPMG’s IDE strategy, building inclusive environments, accountable leadership and equitable experiences. Its success is powered by passionate colleagues who champion these initiatives and through collaboration with networks such as the KPMG Network of Women to ensure lived experiences inform every action.
In acknowledgement of this work, we are proud to have been recognised in several prestigious industry awards throughout the last ten years. Most recently, KPMG and IT’s Her Future won both Firm and Network of The Year at the 2024 TechWomen100 Awards, and we were winners at the 2024 Women in Tech Employer awards for our Mentoring programme. In 2025 our juniors programme was a finalist for the Inspiring the Next Generation Award at the Tech Impact Awards, and we were proud to headline sponsor the TechWomen100 awards.
As IT’s Her Future celebrates a decade of impact, the focus is set firmly on the future. New initiatives, such as our AI workstream, will explore how emerging technologies impact women in work and society. We will continue to inspire, support and progress female talent in technology and to share learnings beyond KPMG to drive progress across the industry.
Find out more >
Watch our video IT's Her Future - a decade of impact. -
MAKE

Reach
NatWest’s Sustainable Housing Coalition
We’re committed to making KPMG a business that’s open to all, whoever you are and whatever your background. To make that a reality we need to better understand the barriers being faced by historically underrepresented groups.
In December 2022, we published leading research into the progression rates of people within our firm, examining 16,500 colleagues over a 5-year period – the most in-depth study of its kind undertaken by a single organisation.
Our research found that social class is the biggest barrier to career progression, compared to any other diversity characteristic. And when that’s combined with some other minority characteristics, career advancement is impacted even further.
Recognising the need for more targeted action, we launched a promotion readiness programme ‘Reach’ aimed at supporting colleagues from low and intermediate socio-economic backgrounds, taking into consideration the impact of other minority characteristics where appropriate.
In its initial pilot, the programme targeted colleagues at manager level during our October promotions. Following the success of the pilot, the programme was expanded in its second year to target both managers and senior managers during our promotions rounds.
This year we ran Reach for the third time and 100% of participants in our 2025 cohort said they would recommend the programme to a colleague. We have also seen 56% of participants who have taken part in Reach be promoted within 12 months of completing the programme. We were delighted that in 2025 Reach was recognised as the Progression Programme of the year at the UK Social Mobility Awards.
Find out more > -
MAKE
Driving allyship with our clients
Kantar’s Procurement Upgrade
We are proud to offer two innovative and impactful programmes to our clients: our Cross Company Allyship Programme (CCAP) and Thrive Together (TT).
CCAP, launched in 2021, champions mentoring and allyship to support individuals of Black heritage and ethnic minority backgrounds, alongside their allies, across KPMG and our client organisations. The programme pairs participants from different organisations for a year-long mentoring journey, complemented by quarterly learning sessions featuring high-profile external speakers and inspiring content.
Over the past four years, CCAP has engaged 2,000+ participants, earning recognition as a Top 10 programme at the Investing in Ethnicity Awards and being shortlisted for the DEI Innovation Award at the prestigious Women in Banking and Finance Awards. The next phase of CCAP launches in March 2026.
Taking the best practices from CCAP, we created a cross company social mobility programme, Thrive Together. Launched in 2025, the programme focuses on social mobility by pairing middle managers from low socioeconomic backgrounds with peers across KPMG and client organisations. The programme combines peer mentoring, virtual sessions on social mobility, and interactive lunch-and-learn events, fostering cross-sector collaboration and personal growth. In its inaugural year, TT welcomed around 100 participants across nine client organisations and KPMG UK, driving meaningful conversations and development opportunities. The next cohort launched in December 2025.
Find out more >


Making the difference in society
FTSE Women Leaders Review
KPMG are proud co-sponsors, alongside Lloyds Banking Group, of the FTSE Women Leaders Review - an independent, business-led framework supported by the Government which sets recommendations for Britain’s largest companies to improve the representation of Women on Boards and in leadership positions. The FTSE Women Leaders Review is building on a strong legacy thanks to the ground-breaking collaborative work of the Hampton-Alexander and Davies Reviews that came before. The Review adopts a unique entirely voluntary approach, working with business on a significant scale to achieve gender balance.
Since the start of the Review in 2011 there has been a sea-change in the gender balance of British boards from 12% women board members in the FTSE 100 in 2011 to 40% today. The focus is now on reaching the 40% women in leadership target, ensuring more women are appointed into the ‘big four’ roles and cementing the culture change that will deliver gender parity in the very top rungs of British business and on reaching the 40% women in leadership target.
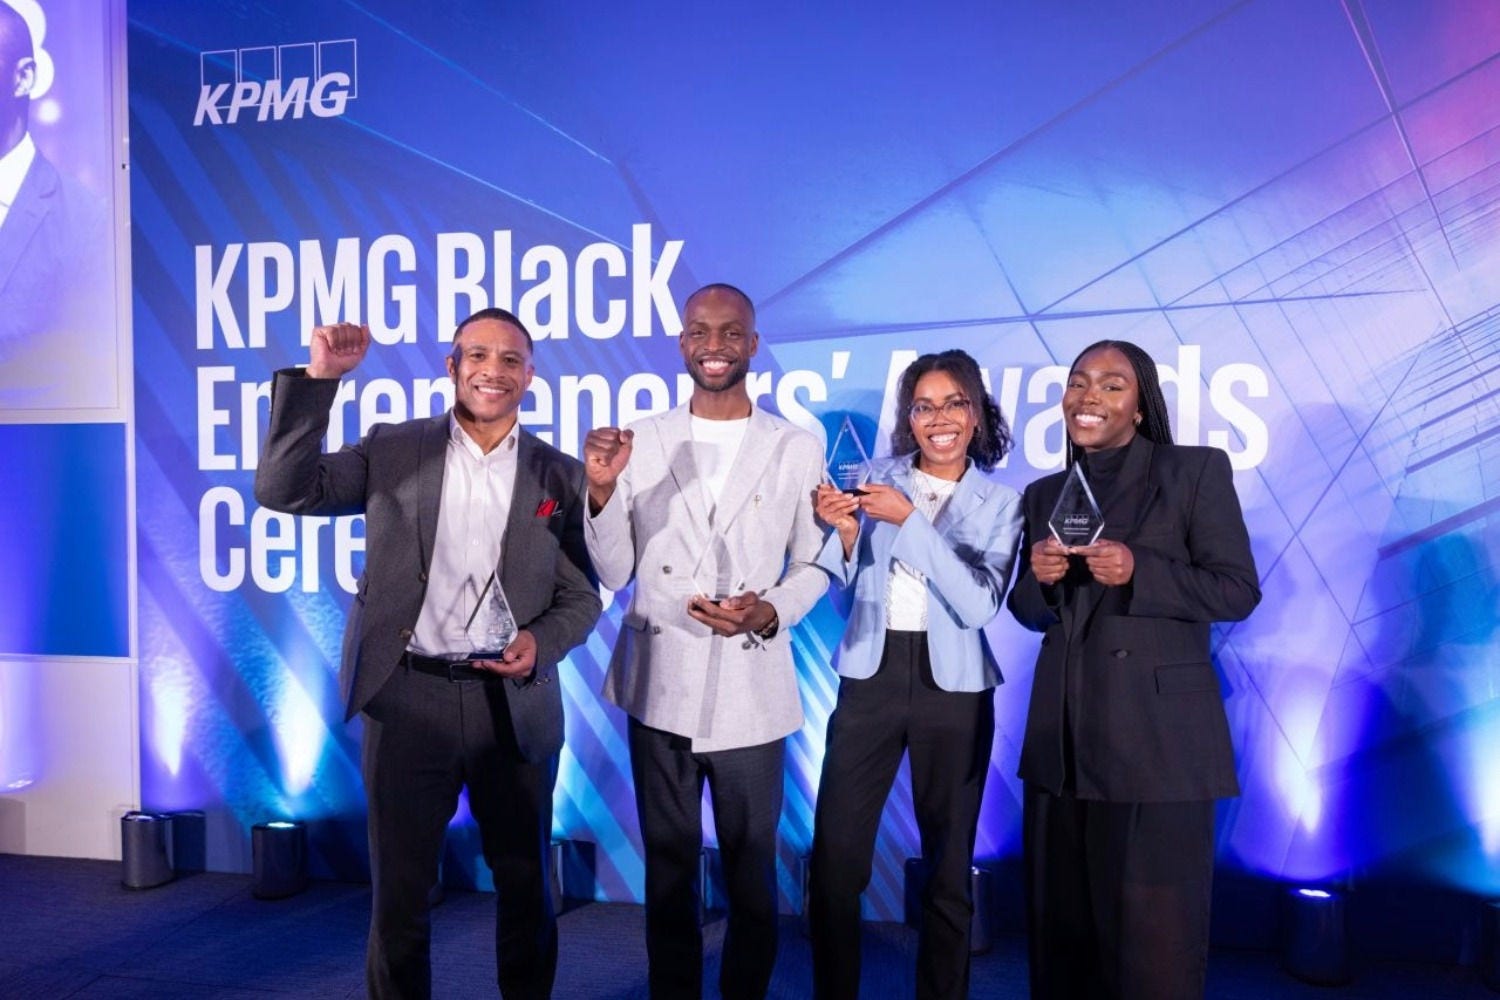
Black Entrepreneurs' Awards
Establishing a business is challenging, but these challenges are even more pronounced for some. Black-led businesses frequently face disproportionate underfunding, with investment into Black founders less than 1% in 2023 (Extend Ventures, 2023). This significant racial disparity in venture capital (VC) funding hinders many from making the necessary investments to grow their businesses. Our Black Entrepreneurs’ Awards programme, created in 2018, aims to provide talented Black heritage entrepreneurs with access to funding, publicity, business workshops and mentoring to create a community of likeminded business owners.
Each year there are four winners who receive a cash prize of £25,000 each, and all of the finalists are enrolled onto a bespoke 12-month business acceleration programme, designed to support Black heritage entrepreneurs and accelerate the growth of their start-ups. The programme has supported 48 Black heritage founders to accelerate the growth of their business. Some of our previous finalists have gone on to raise over £3m; expanded their business overseas; been listed on the Forbes 30 under 30; and received MBEs for their services in making venture capital more inclusive.
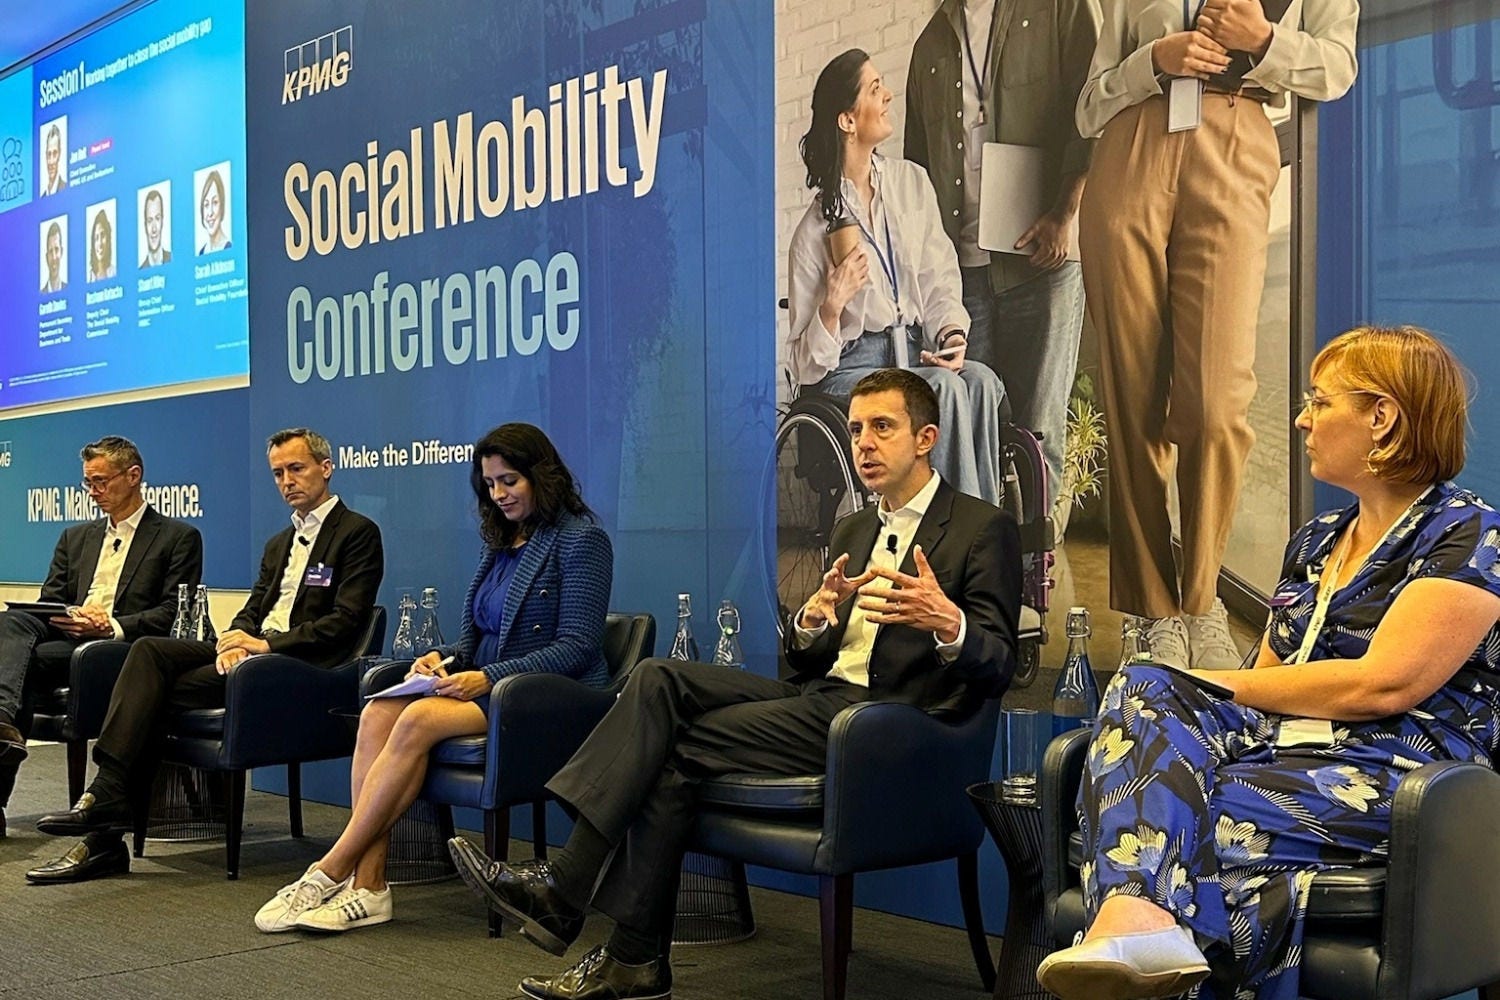
Social Mobility Conference
“I’m passionate about the role organisations like ours play in driving equal opportunity for all, and we’re not the only business who believes in this. Over the summer we held our third annual Social Mobility Conference, bringing leaders from a range of organisations, community partners, and suppliers together to discuss how we address social mobility in the workplace.
Career advancement should be about realising potential, not background. It is through this belief, and longstanding focus in this area, that we’ve continued to make important progress. This includes publishing extensive analysis into the impact of socio-economic background on progression in our firm; the biggest ever performed by a single business. We also launched our “Opening Doors to Opportunities” initiative, which aims to give one million young people the opportunity to develop their skills by 2030."
Jon Holt / Group Chief Executive and UK Senior Partner