Pay gap reporting is a key part of this and we're proud to have led the way. We first published our gender pay gap voluntarily in 2015 and since then have published our ethnicity pay gap (2017), sexual orientation pay gap, Black heritage pay gap and disability pay gap (each since Feb 2021) and socio-economic background pay gaps (September 2021). We also expanded our pay gap reporting to include additional ethnicity categories, recognising the different experiences different ethnic groups may have within the firm.
Whilst being transparent about where we are is critical to driving change, we know pay gaps are just one part of the picture. What's important is what we do with that data. That's why we continually monitor our progress to understand what’s working and challenge ourselves on where we can go further to focus our efforts and increase representation and inclusivity in our firm.
Numbers for the April 2025 Pay Gap report, first published in January 2026, have been restated in April 2026 following identification of an error in the preparation of the data that was first used to calculate the reported figures.
Foreword from Jon Holt

Key progress
I’m really proud that we’ve been reporting our gender pay gap for more than a decade. Since then, we’ve reduced our basic gender pay gap from 21.4% to 15.7%, and since 2015, we’ve increased the number of female partners from 15% to 29%.
We made steady progress last year, achieving reductions in four out of six of our gender pay gap measures. Women represent 50% of our workforce, and our focus is supporting women to progress in our organisation and achieve parity. This year we’ve enhanced our family policies – improving our maternity and paternity provision and support for returning parents. We’re also piloting new flexible options for job sharing at senior grades.
We were one of the first firms to publish extensive research into the impact of socio-economic background on progression. This is something I’m particularly passionate about, and I’m proud that we were recognised with Progression Programme of the Year at the 2025 Social Mobility Awards.
In the last four years we’ve made good progress to improve the representation of colleagues from non-professional socio-economic backgrounds from 36% to 44%. Our socio-economic background pay gaps are now relatively small.
There has been mixed progress in other areas this year - further detail can be found throughout the full pay gap report. Our ethnicity pay gaps, for example, are complex and varied. We know we have more to do to increase the representation of ethnic minority colleagues, in particular Black heritage colleagues, in senior positions. That’s why in 2025, we launched a new initiative – which I am proud to sponsor – to support Black heritage directors to become Partners at our firm.
All these activities move us in the right direction, however this is a complex challenge. We’ve improved diversity among historically underrepresented groups faster at more junior levels. This means we have a higher proportion of these employees in lower pay grades. The average colleague pay – used to calculate our pay gaps – is therefore skewed downwards. So, in the short term our efforts can make our pay gaps look wider, despite overall progress. However, we remain as committed as ever to diverse representation at every level of our firm.
Looking ahead
There is much still to do, but without extraordinary people from all backgrounds and identities, we cannot succeed as a business. We’re committed to continuing our recent progress, both through our actions within KPMG and by working with other organisations to tackle barriers to inclusion. Together, we can make the difference for our clients, our people and society.

Declaration
I confirm that KPMG LLP’s pay gap data has been collected and presented within this report in accordance with the Equality Act 2010 (Gender Pay Gap Information) Regulations 2017.
Jon Holt
Group Chief Executive and UK Senior Partner
KPMG
Following a structural change in our legal entity, our Gender Pay Gap for 2023 onwards has been submitted to the Government’s Gender Pay Gap reporting service under KPMG LLP. All historic gender pay gaps can be seen on the Gender Pay Gap Viewing Service under KPMG UK LIMITED
Total earnings (inc. Equity Partners)
Median gender pay gap as of 5 April 2025, including equity partners
19.8%
Increased by 0.2% points from 2024 (19.6%)
Mean gender pay gap as of 5 April 2025, including equity partners
30.2%
Reduced by 0.5% points from 2024 (30.7%)
What is the data showing?
We have seen reductions against four out of six of our gender pay gap (GPG) measures this year. The basic pay GPG (statutory data) reduced by 0.5% points to 15.7% at the median and by 1.7% points to 17.1% at the mean. The median bonus gap increased by 1.3% points to 36.9% and the mean bonus gap reduced by 1.5% points to 39.4%. The total earnings GPG (inclusive of equity partners) increased by 0.2% points to 19.8% at the median and reduced by 0.5% points to 30.2% at the mean.
The main driver behind our gender pay gap is the representation of women compared to men across the organisation, highlighted by the pay quartiles where we see a higher representation of women in the ‘lower’ and ‘lower middle’ quartiles. This impacts where the median falls. For instance, when establishing the median pay gap point for gender, the median woman is a lower grade (Assistant Manager) than the median man (Manager), due to higher female representation in our junior roles. This results in a higher median pay gap, as we’re comparing employees at different pay grades. We aim for parity across all grades, as set out in our IDE strategy and supported by our structured performance model and pay principles. We expect to see our pay quartiles continue to equalise over time.
Actions we are taking to close the gap
As part of our Gender Equity Plan, we have a number of initiatives to attract and support women to develop their careers at every stage. We analyse outcomes of key people processes for fairness and consistency against proportional tolerances. In 2025 we strengthened our family policies, updating our maternity and paternity provision and support for returning parents. We are piloting new options for job sharing in client facing teams, offering greater flexibility at senior grades. Our data led approach is combined with colleague insight through collaborating with internal communities like our KPMG Network of Women (KNOW) and IT’s Her Future. You can find out more about the action we’re taking here.
The total earnings gender pay gap is the measure of the difference in average pay between all men and all women across an organisation, regardless of their role, level, length of service or location and any other differentiating factors. Although not required by statute, these figures relate to all KPMG staff and partners. The April 2025 dataset contains a total employee population of 16,207 with a Male/Female Split of 8,187 / 8,020. For comparative year on year data see here.
Basic pay (exc. Equity Partners)
Median basic pay gap as of 5 April 2025, excluding equity partners
15.7%
Reduced by 0.5% points from 2024 (16.2%)
Mean basic pay gap as of 5 April 2025, excluding equity partners
17.1%
Reduced by 1.7% points from 2024 (18.8%)
What is the data showing?
We have seen reductions against four out of six of our gender pay gap (GPG) measures this year. The basic pay GPG (statutory data) reduced by 0.5% points to 15.7% at the median and by 1.7% points to 17.1% at the mean. The median bonus gap increased by 1.3% points to 36.9% and the mean bonus gap reduced by 1.5% points to 39.4%. The total earnings GPG (inclusive of equity partners) increased by 0.2% points to 19.8% at the median and reduced by 0.5% points to 30.2% at the mean.
The main driver behind our gender pay gap is the representation of women compared to men across the organisation, highlighted by the pay quartiles where we see a higher representation of women in the ‘lower’ and ‘lower middle’ quartiles. This impacts where the median falls. For instance, when establishing the median pay gap point for gender, the median woman is a lower grade (Assistant Manager) than the median man (Manager), due to higher female representation in our junior roles. This results in a higher median pay gap, as we’re comparing employees at different pay grades. We aim for parity across all grades, as set out in our IDE strategy and supported by our structured performance model and pay principles. We expect to see our pay quartiles continue to equalise over time.
Actions we are taking to close the gap
As part of our Gender Equity Plan, we have a number of initiatives to attract and support women to develop their careers at every stage. We analyse outcomes of key people processes for fairness and consistency against proportional tolerances. In 2025 we strengthened our family policies, updating our maternity and paternity provision and support for returning parents. We are piloting new options for job sharing in client facing teams, offering greater flexibility at senior grades. Our data led approach is combined with colleague insight through collaborating with internal communities like our KPMG Network of Women (KNOW) and IT’s Her Future. You can find out more about the action we’re taking here.
The basic pay gender pay gap is the measure of the difference in average hourly pay between men and women across an organisation, regardless of their role, level, length of service or location and any other differentiating factors. Required by statute, these figures relate to all KPMG staff excluding equity partners. The April 2025 dataset contains a total employee population of 15,805 with a Male/Female Split of 7,889 / 7,916. For comparative year on year data see here.
Bonus (exc. Equity Partners)
Median bonus pay gap as of 5 April 2025, excluding equity partners
36.9%
Increased by 1.3% points from 2024 (35.6%)
74.3 - % of females received a bonus
72.4 - % of males received a bonus
72.4 - % of males received a bonus
Mean bonus pay gap as of 5 April 2025, excluding equity partners
39.4%
Reduced by 1.5% points from 2024 (40.9%)
74.3 - % of females received a bonus
72.4 - % of males received a bonus
72.4 - % of males received a bonus
What is the data showing?
We have seen reductions against four out of six of our gender pay gap (GPG) measures this year. The basic pay GPG (statutory data) reduced by 0.5% points to 15.7% at the median and by 1.7% points to 17.1% at the mean. The median bonus gap increased by 1.3% points to 36.9% and the mean bonus gap reduced by 1.5% points to 39.4%. The total earnings GPG (inclusive of equity partners) increased by 0.2% points to 19.8% at the median and reduced by 0.5% points to 30.2% at the mean.
The main driver behind our gender pay gap is the representation of women compared to men across the organisation, highlighted by the pay quartiles where we see a higher representation of women in the ‘lower’ and ‘lower middle’ quartiles. This impacts where the median falls. For instance, when establishing the median pay gap point for gender, the median woman is a lower grade (Assistant Manager) than the median man (Manager), due to higher female representation in our junior roles. This results in a higher median pay gap, as we’re comparing employees at different pay grades. We aim for parity across all grades, as set out in our IDE strategy and supported by our structured performance model and pay principles. We expect to see our pay quartiles continue to equalise over time.
Actions we are taking to close the gap
As part of our Gender Equity Plan, we have a number of initiatives to attract and support women to develop their careers at every stage. We analyse outcomes of key people processes for fairness and consistency against proportional tolerances. In 2025 we strengthened our family policies, updating our maternity and paternity provision and support for returning parents. We are piloting new options for job sharing in client facing teams, offering greater flexibility at senior grades. Our data led approach is combined with colleague insight through collaborating with internal communities like our KPMG Network of Women (KNOW) and IT’s Her Future. You can find out more about the action we’re taking here.
This is the difference in average bonus paid between men and women who received a bonus, excluding equity partners.
Pay quartiles
The quartiles set out the gender distribution across KPMG in four equally-sized quartiles.
Excluding equity partners
Q1 lower
Q2 lower middle
Q3 upper middle
Q4 upper
Including equity partners
Q1 lower
Q2 lower middle
Q3 upper middle
Q4 upper
What is the data showing?
We have seen reductions against four out of six of our gender pay gap (GPG) measures this year. The basic pay GPG (statutory data) reduced by 0.5% points to 15.7% at the median and by 1.7% points to 17.1% at the mean. The median bonus gap increased by 1.3% points to 36.9% and the mean bonus gap reduced by 1.5% points to 39.4%. The total earnings GPG (inclusive of equity partners) increased by 0.2% points to 19.8% at the median and reduced by 0.5% points to 30.2% at the mean.
The main driver behind our gender pay gap is the representation of women compared to men across the organisation, highlighted by the pay quartiles where we see a higher representation of women in the ‘lower’ and ‘lower middle’ quartiles. This impacts where the median falls. For instance, when establishing the median pay gap point for gender, the median woman is a lower grade (Assistant Manager) than the median man (Manager), due to higher female representation in our junior roles. This results in a higher median pay gap, as we’re comparing employees at different pay grades. We aim for parity across all grades, as set out in our IDE strategy and supported by our structured performance model and pay principles. We expect to see our pay quartiles continue to equalise over time.
Actions we are taking to close the gap
As part of our Gender Equity Plan, we have a number of initiatives to attract and support women to develop their careers at every stage. We analyse outcomes of key people processes for fairness and consistency against proportional tolerances. In 2025 we strengthened our family policies, updating our maternity and paternity provision and support for returning parents. We are piloting new options for job sharing in client facing teams, offering greater flexibility at senior grades. Our data led approach is combined with colleague insight through collaborating with internal communities like our KPMG Network of Women (KNOW) and IT’s Her Future. You can find out more about the action we’re taking here.
The quartiles set out the gender distribution across KPMG in four equally-sized quartiles.
You can see more detail on our representation data here.
Total earnings (inc. Equity Partners)
Median ethnicity pay gap as of 5 April 2025, including equity partners
23.1%
Increased by 1.8% points from 2024 (21.3%)
Mean ethnicity pay gap as of 5 April 2025, including equity partners
37.8%
Increased by 1.9% points from 2024 (35.9%)
What is the data showing?
We have seen increases in all ethnicity pay gap (EPG) measures this year. The basic pay EPG increased by 2.0% points to 18.3% at the median and increased by 0.8% points to 20.0% at the mean. The bonus gaps increased by 13.6% points to 33.0% and by 3.3% points to 39.9% at median and mean measures respectively. The total earnings EPG (inclusive of equity partners) increased by 1.8% points to 23.1% at the median and by 1.9% points to 37.8% at the mean. The ethnicity pay gap exists because the representation of ethnic minority (EM) colleagues compared to non-ethnic minority (non-EM) colleagues is unequal across the organisation. This is highlighted by the pay quartiles where we see fewer EM colleagues in the ‘upper’ and ‘upper middle’ quartiles. This demographic mix results in the median EM colleague being at a lower grade (Assistant Manager) compared to the median non-EM colleague (Manager), which leads to the pay gap.
Action we’re taking to close the gap
We have several initiatives dedicated to attracting and progressing ethnic minority colleagues across the firm. Our allyship programmes continue to evolve and grow, for example our Cross Company Allyship Programme completed its fourth cohort in 2025. This programme opens up opportunities for KPMG and client mentors and mentees of ethnic minority heritage to gain experiences and access networks from outside of their own organisation. In 2025 our IDE development programmes, Inspire and Elevate, had 48% of participants from ethnic minority backgrounds and 37%* of student hires joining the firm in September and October 2024 were from ethnic minority backgrounds. Our employee networks continue to run a wide range of career focused initiatives, including mentoring bootcamps, masterclass skill sessions and partner career panels, supporting our colleagues’ career development. You can find out more about the action we’re taking here.
*For FY25 reporting, figures have been restated on a calendar-year basis instead of a financial-year basis, as students recruited during a single recruitment period may have start dates across two financial years.
The total earnings ethnicity pay gap is the measure of the difference in average pay between colleagues that have declared themselves as ethnic minority vs white, regardless of their role, level, length of service or location and any other differentiating factors. Although not required by statute, these figures relate to all KPMG staff and partners. Our ethnicity data is based on those individuals who have chosen to declare their ethnicity, which for the April 2025 dataset contains a total employee population of 12,903 with a White / Ethnic minority split of 7,691 / 5,212. For comparative year on year data see here.
Basic pay (exc. Equity Partners)
Median basic pay gap as of 5 April 2025, excluding equity partners
18.3%
Increased by 2.0% points from 2024 (16.3%)
Mean basic pay gap as of 5 April 2025, excluding equity partners
20.0%
Increased by 0.8% points from 2024 (19.2%)
What is the data showing?
We have seen increases in all ethnicity pay gap (EPG) measures this year. The basic pay EPG increased by 2.0% points to 18.3% at the median and increased by 0.8% points to 20.0% at the mean. The bonus gaps increased by 13.6% points to 33.0% and by 3.3% points to 39.9% at median and mean measures respectively. The total earnings EPG (inclusive of equity partners) increased by 1.8% points to 23.1% at the median and by 1.9% points to 37.8% at the mean. The ethnicity pay gap exists because the representation of ethnic minority (EM) colleagues compared to non-ethnic minority (non-EM) colleagues is unequal across the organisation. This is highlighted by the pay quartiles where we see fewer EM colleagues in the ‘upper’ and ‘upper middle’ quartiles. This demographic mix results in the median EM colleague being at a lower grade (Assistant Manager) compared to the median non-EM colleague (Manager), which leads to the pay gap.
Action we’re taking to close the gap
We have several initiatives dedicated to attracting and progressing ethnic minority colleagues across the firm. Our allyship programmes continue to evolve and grow, for example our Cross Company Allyship Programme completed its fourth cohort in 2025. This programme opens up opportunities for KPMG and client mentors and mentees of ethnic minority heritage to gain experiences and access networks from outside of their own organisation. In 2025 our IDE development programmes, Inspire and Elevate, had 48% of participants from ethnic minority backgrounds and 37%* of student hires joining the firm in September and October 2024 were from ethnic minority backgrounds. Our employee networks continue to run a wide range of career focused initiatives, including mentoring bootcamps, masterclass skill sessions and partner career panels, supporting our colleagues’ career development. You can find out more about the action we’re taking here.
*For FY25 reporting, figures have been restated on a calendar-year basis instead of a financial-year basis, as students recruited during a single recruitment period may have start dates across two financial years.
The basic pay ethnicity pay gap is the measure of the difference in average hourly pay between colleagues that have declared themselves as ethnic minority vs white, regardless of their role, level, length of service or location and any other differentiating factors. Although not required by statute, these figures relate to all KPMG staff excluding equity partners. Our ethnicity data is based on those individuals who have chosen to declare their ethnicity, which for the April 2025 dataset contains a total employee population of 12,529 with a White / Ethnic minority split of 7,364 / 5,165. For comparative year on year data see here.
Bonus (exc. Equity Partners)
Median bonus pay gap as of 5 April 2025, excluding equity partners
33.0%
Increased by 13.6% points from 2024 (19.4%)
67.0 - % of ethnic minority individuals received a bonus
81.5 - % of White individuals received a bonus
81.5 - % of White individuals received a bonus
Mean bonus pay gap as of 5 April 2025, excluding equity partners
39.9%
Increased by 3.3% points from 2024 (36.6%)
67.0 - % of ethnic minority individuals received a bonus
81.5 - % of White individuals received a bonus
81.5 - % of White individuals received a bonus
What is the data showing?
We have seen increases in all ethnicity pay gap (EPG) measures this year. The basic pay EPG increased by 2.0% points to 18.3% at the median and increased by 0.8% points to 20.0% at the mean. The bonus gaps increased by 13.6% points to 33.0% and by 3.3% points to 39.9% at median and mean measures respectively. The total earnings EPG (inclusive of equity partners) increased by 1.8% points to 23.1% at the median and by 1.9% points to 37.8% at the mean. The ethnicity pay gap exists because the representation of ethnic minority (EM) colleagues compared to non-ethnic minority (non-EM) colleagues is unequal across the organisation. This is highlighted by the pay quartiles where we see fewer EM colleagues in the ‘upper’ and ‘upper middle’ quartiles. This demographic mix results in the median EM colleague being at a lower grade (Assistant Manager) compared to the median non-EM colleague (Manager), which leads to the pay gap.
Action we’re taking to close the gap
We have several initiatives dedicated to attracting and progressing ethnic minority colleagues across the firm. Our allyship programmes continue to evolve and grow, for example our Cross Company Allyship Programme completed its fourth cohort in 2025. This programme opens up opportunities for KPMG and client mentors and mentees of ethnic minority heritage to gain experiences and access networks from outside of their own organisation. In 2025 our IDE development programmes, Inspire and Elevate, had 48% of participants from ethnic minority backgrounds and 37%* of student hires joining the firm in September and October 2024 were from ethnic minority backgrounds. Our employee networks continue to run a wide range of career focused initiatives, including mentoring bootcamps, masterclass skill sessions and partner career panels, supporting our colleagues’ career development. You can find out more about the action we’re taking here.
*For FY25 reporting, figures have been restated on a calendar-year basis instead of a financial-year basis, as students recruited during a single recruitment period may have start dates across two financial years.
This is the difference in average bonus paid between White and Ethnic Minority colleagues who received a bonus, excluding equity partners.
Pay quartiles
Excluding equity partners
Q1 lower
Q2 lower middle
Q3 upper middle
Q4 upper
Including equity partners
Q1 lower
Q2 lower middle
Q3 upper middle
Q4 upper
What is the data showing?
We have seen increases in all ethnicity pay gap (EPG) measures this year. The basic pay EPG increased by 2.0% points to 18.3% at the median and increased by 0.8% points to 20.0% at the mean. The bonus gaps increased by 13.6% points to 33.0% and by 3.3% points to 39.9% at median and mean measures respectively. The total earnings EPG (inclusive of equity partners) increased by 1.8% points to 23.1% at the median and by 1.9% points to 37.8% at the mean. The ethnicity pay gap exists because the representation of ethnic minority (EM) colleagues compared to non-ethnic minority (non-EM) colleagues is unequal across the organisation. This is highlighted by the pay quartiles where we see fewer EM colleagues in the ‘upper’ and ‘upper middle’ quartiles. This demographic mix results in the median EM colleague being at a lower grade (Assistant Manager) compared to the median non-EM colleague (Manager), which leads to the pay gap.
Action we’re taking to close the gap
We have several initiatives dedicated to attracting and progressing ethnic minority colleagues across the firm. Our allyship programmes continue to evolve and grow, for example our Cross Company Allyship Programme completed its fourth cohort in 2025. This programme opens up opportunities for KPMG and client mentors and mentees of ethnic minority heritage to gain experiences and access networks from outside of their own organisation. In 2025 our IDE development programmes, Inspire and Elevate, had 48% of participants from ethnic minority backgrounds and 37%* of student hires joining the firm in September and October 2024 were from ethnic minority backgrounds. Our employee networks continue to run a wide range of career focused initiatives, including mentoring bootcamps, masterclass skill sessions and partner career panels, supporting our colleagues’ career development. You can find out more about the action we’re taking here.
*For FY25 reporting, figures have been restated on a calendar-year basis instead of a financial-year basis, as students recruited during a single recruitment period may have start dates across two financial years.
The quartiles set out the ethnicity distribution across KPMG in four equally-sized quartiles.
You can see more detail on our representation data here.
Total earnings (inc. Equity Partners)
Median Black heritage pay gap as of 5 April 2025, including equity partners
17.9%
Increased by 1.2% points from 2024 (16.7%)
Mean Black heritage pay gap as of 5 April 2025, including equity partners
36.8%
Increased by 0.7% points from 2024 (36.1%)
We report our Black heritage pay gap on a voluntary basis. The Black heritage pay gap is the difference in average pay between colleagues that have declared as being of Black heritage (including Black African, Black Caribbean or Any Other Black background, Mixed White and Black Caribbean and Mixed White and Black African) vs non-Black heritage colleagues, regardless of their role, level, length of service or location and any other differentiating factors. Our Black heritage data is based on those individuals who have chosen to declare their ethnicity, which for the April 2025 dataset contains a total staff and partner population of 12,903 with a Non-Black heritage / Black heritage split of 11,862 / 1,041. For comparative year on year data see here.
Pay quartiles
Q1 lower
Q2 lower middle
Q3 upper middle
Q4 upper
What the Data tells us
We have seen increases in our Black heritage median and mean pay gaps between April 2024 and April 2025. The median gap increased by 1.2% points to 17.9% and the mean gap by 0.7% points to 36.8%. The Black heritage pay gap exists because the representation of Black heritage (BH) colleagues compared to non-Black heritage (non-BH) colleagues is unequal across the organisation, which is highlighted by the pay quartiles. Black heritage representation has remained broadly stable in last 12 months with firmwide representation at 6.4% and when we disaggregate by grade, junior representation has remained static at 8% and senior representation at 3%.
Action we are taking to close the gap
Our IDE strategy has targeted Black heritage interventions and explores intersectionality. This includes our flagship programmes, Inspire and Elevate, which support historically under-represented groups without requiring individuals to choose a single aspect of their identity. In 2025, 15% of participants in these programmes were of Black heritage. We are continuing to invest in programmes that build the pipeline of Black talent. Our Black Heritage Allyship Programme completed its fifth cohort, and our Black Heritage Talent Insight Programme offers early-career exposure to professional services for students and graduates. Our Career Advancement Network launched in 2025, sponsored by our Chief Executive, and has been designed to support Black heritage directors on their journey to partner. You can find out more about the action we are taking here.
The quartiles set out the Black heritage distribution across KPMG in four equally-sized quartiles.
You can see more detail on our representation data here.
In 2023, we expanded our pay gap reporting to include additional ethnicity categories, alongside our existing ethnic minority and Black heritage pay gaps. The additional groups – which were determined in line with government-recommended methodology – aim to recognise the nuances of different ethnic groups and the varied experiences they have within our firm.
Total earnings (inc. Equity Partners) - White vs Asian
Median pay gap as of 5 April 2025, including equity partners
23.4%
Increased by 3.0% points from 2024 (20.4%)
Mean pay gap as of 5 April 2025, including equity partners
37.7%
Increased by 2.6% points from 2024 (35.1%)
Total earnings (inc. Equity Partners) - White vs Black
Median pay gap as of 5 April 2025, including equity partners
24.8%
Increased by 0.2% points from 2024 (24.6%)
Mean pay gap as of 5 April 2025, including equity partners
44.9%
Increased by 1.1% points from 2024 (43.8%)
Pay gap (inc. Equity Partners) - White vs Mixed
Median pay gap as of 5 April 2025, including equity partners
17.8%
Increased by 0.5% points from 2024 (17.3%)
Mean pay gap as of 5 April 2025, including equity partners
29.0%
Increased by 0.5% points from 2024 (28.5%)
Pay gap (inc. Equity Partners) - White vs Other
Median pay gap as of 5 April 2025, including equity partners
9.6%
Reduced by 3.7% points from 2024 (13.3%)
Mean pay gap as of 5 April 2025, including equity partners
25.9%
Increased by 0.1% points from 2024 (25.8%)
We voluntarily report against additional ethnic minority pay gaps. These pay gaps are the difference in average pay between colleagues who have declared themselves as one of the ethnic minority categories outlined above and colleagues that declare as white, regardless of their role, level, length of service or location and any other differentiating factors.
What is the difference between the different ethnic minority pay gaps we report against?
In the third year of reporting our additional ethnic minority category pay gaps, we have seen increases in the majority of the gaps from April 2024 to April 2025. These pay gaps exist because the representation of ethnic minority colleagues compared to white colleagues is unequal across the organisation, with fewer ethnic minority colleagues in senior positions. We see larger gaps in the categories where there is a wider disparity in the proportion of colleagues at junior vs senior grades.
There is a difference between our Black heritage pay gap and the Black pay gap that is reported as part of our additional categories. Our Black heritage pay gap includes colleagues that identify as mixed white and Black Caribbean/mixed white and Black African, as opposed to just Black African, Black Caribbean or Any Other Black background.
You can find a full breakdown of the groups we include in each category below.
|
Ethnicity Breakdown |
Ethnic Minorities (EM) |
Black Heritage (BH) |
ONS5 |
|
Arab ethnicity |
EM |
Non BH |
Other |
|
Asian/Asian British: Bangladeshi |
EM |
Non BH |
Asian |
|
Asian/Asian British: Chinese |
EM |
Non BH |
Asian |
|
Asian/Asian British: Indian |
EM |
Non BH |
Asian |
|
Asian/Asian British: Other Asian |
EM |
Non BH |
Asian |
|
Asian/Asian British: Pakistani |
EM |
Non BH |
Asian |
|
Black/African/Caribbean/Black British: African |
EM |
BH |
Black |
|
Black/African/Caribbean/Black British: Caribbean |
EM |
BH |
Black |
|
Black/African/Caribbean/Black British: Other Black |
EM |
BH |
Black |
|
Jewish ethnicity |
EM |
Non BH |
Other |
|
Mixed/multiple ethnic groups: Other Mixed |
EM |
Non BH |
Mixed |
|
Mixed/multiple ethnic groups: White & Black African |
EM |
BH |
Mixed |
|
Mixed/multiple ethnic groups: White & Black Caribbean |
EM |
BH |
Mixed |
|
Mixed/multiple ethnic groups: White&Asian |
EM |
Non BH |
Mixed |
|
Other ethnic group |
EM |
Non BH |
Other |
|
Other ethnic group: Any other ethnic group |
EM |
Non BH |
Other |
|
Other ethnic group: Arab |
EM |
Non BH |
Other |
|
White: English/Welsh/Scottish/N. Irish/British |
Non EM |
Non BH |
White |
|
White: Gypsy or Irish Traveller |
Non EM |
Non BH |
White |
|
White: Irish |
Non EM |
Non BH |
White |
|
White: Other White |
Non EM |
Non BH |
White |
|
Prefer not to say |
Prefer not to say |
Prefer not to say |
Prefer not to say |
|
No Declaration Made |
No Declaration Made |
No Declaration Made |
No Declaration Made |
|
Undeclared |
Undeclared |
Undeclared |
Undeclared |
What is the data showing?
We have seen increases in all ethnicity pay gap (EPG) measures this year. The basic pay EPG increased by 2.0% points to 18.3% at the median and increased by 0.8% points to 20.0% at the mean. The bonus gaps increased by 13.6% points to 33.0% and by 3.3% points to 39.9% at median and mean measures respectively. The total earnings EPG (inclusive of equity partners) increased by 1.8% points to 23.1% at the median and by 1.9% points to 37.8% at the mean. The ethnicity pay gap exists because the representation of ethnic minority (EM) colleagues compared to non-ethnic minority (non-EM) colleagues is unequal across the organisation. This is highlighted by the pay quartiles where we see fewer EM colleagues in the ‘upper’ and ‘upper middle’ quartiles. This demographic mix results in the median EM colleague being at a lower grade (Assistant Manager) compared to the median non-EM colleague (Manager), which leads to the pay gap.
Action we’re taking to close the gap
We have several initiatives dedicated to attracting and progressing ethnic minority colleagues across the firm. Our allyship programmes continue to evolve and grow, for example our Cross Company Allyship Programme completed its fourth cohort in 2025. This programme opens up opportunities for KPMG and client mentors and mentees of ethnic minority heritage to gain experiences and access networks from outside of their own organisation. In 2025 our IDE development programmes, Inspire and Elevate, had 48% of participants from ethnic minority backgrounds and 37%* of student hires joining the firm in September and October 2024 were from ethnic minority backgrounds. Our employee networks continue to run a wide range of career focused initiatives, including mentoring bootcamps, masterclass skill sessions and partner career panels, supporting our colleagues’ career development. You can find out more about the action we’re taking here.
*For FY25 reporting, figures have been restated on a calendar-year basis instead of a financial-year basis, as students recruited during a single recruitment period may have start dates across two financial years.
Total earnings (inc. Equity Partners)
Median sexual orientation pay gap as of 5 April 2025, including equity partners
15.2%
Increased by 1.7% points from 2024 (13.5%)
Mean sexual orientation pay gap as of 5 April 2025, including equity partners
18.9%
Increased by 1.0% points from 2024 (17.9%)
What is the data showing?
We have seen increases in our sexual orientation median and mean pay gaps between April 2024 and April 2025. The median gap increased by 1.7% points to 15.2% and the mean gap by 1.0% point to 18.9%. The gap exists as we have fewer lesbian, gay and bi (LGB) colleagues in senior roles. This is highlighted by the pay quartile data where we see fewer LGB colleagues in the ‘upper’ quartile in comparison to more LGB colleagues in the ‘lower’ quartile. As with last year’s gap, the increase seen this year has been driven by an increase in our LGB population, particularly amongst new joiners via our student programmes.
Action we’re taking to close the gap
We have several initiatives dedicated to supporting LGBT+ talent in our firm. We are committed to creating an inclusive environment where colleagues feel safe to come as they are. Communities like our LGBT+ network, Breathe, help build cohesion and support all colleagues across the firm. Breathe run a number of initiatives including a reverse mentoring programme to support LGBT+ colleagues at junior grades and build a community of allies at senior grades. We continue working to attract more diverse talent into our firm, the Student Recruitment team attend Student Pride, supported by our LGBT+ network to speak with students about the opportunities available at KPMG. The team also run our annual recruitment Pride event in June for LGBT+ students – encouraging greater representation within our Apprenticeship and Graduate programmes. In 2024, 8%* of joiners in our student programmes were LGB. Sexual orientation is also a key checkpoint across all our people processes, ensuring we are monitoring and analysing outcomes of these processes. You can find out more about the action we’re taking here.
*For FY25 reporting, figures have been restated on a calendar-year basis instead of a financial-year basis, as students recruited during a single recruitment period may have start dates across two financial years.
We report our sexual orientation pay gap on a voluntary basis. The sexual orientation pay gap is the difference in average pay between colleagues who have declared themselves heterosexual/straight and those who have declared themselves as Lesbian, Gay & Bi, regardless of their role, level, length of service or location and any other differentiating factors. Our sexual orientation data is based on those individuals who have chosen to declare their sexual orientation, which for the April 2025 dataset contains a total staff and partner population of 12,496 with a Heterosexual / LGB split of 11,814 / 682. For comparative year on year data see here.
Pay quartiles (inc. Equity Partners)
Q1 lower
Q2 lower middle
Q3 upper middle
Q4 upper
What is the data showing?
We have seen increases in our sexual orientation median and mean pay gaps between April 2024 and April 2025. The median gap increased by 1.7% points to 15.2% and the mean gap by 1.0% point to 18.9%. The gap exists as we have fewer lesbian, gay and bi (LGB) colleagues in senior roles. This is highlighted by the pay quartile data where we see fewer LGB colleagues in the ‘upper’ quartile in comparison to more LGB colleagues in the ‘lower’ quartile. As with last year’s gap, the increase seen this year has been driven by an increase in our LGB population, particularly amongst new joiners via our student programmes.
Action we’re taking to close the gap
We have several initiatives dedicated to supporting LGBT+ talent in our firm. We are committed to creating an inclusive environment where colleagues feel safe to come as they are. Communities like our LGBT+ network, Breathe, help build cohesion and support all colleagues across the firm. Breathe run a number of initiatives including a reverse mentoring programme to support LGBT+ colleagues at junior grades and build a community of allies at senior grades. We continue working to attract more diverse talent into our firm, the Student Recruitment team attend Student Pride, supported by our LGBT+ network to speak with students about the opportunities available at KPMG. The team also run our annual recruitment Pride event in June for LGBT+ students – encouraging greater representation within our Apprenticeship and Graduate programmes. In 2024, 8%* of joiners in our student programmes were LGB. Sexual orientation is also a key checkpoint across all our people processes, ensuring we are monitoring and analysing outcomes of these processes. You can find out more about the action we’re taking here.
*For FY25 reporting, figures have been restated on a calendar-year basis instead of a financial-year basis, as students recruited during a single recruitment period may have start dates across two financial years.
The quartiles set out the Sexual orientation distribution across KPMG in four equally-sized quartiles.
You can see more detail on our representation data here.
Total earnings (inc. Equity Partners)
Median disability pay gap as of 5 April 2025, including equity partners
5.2%
Reduced by 0.7% points from 2024 (5.9%)
Mean disability pay gap as of 5 April 2025, including equity partners
4.2%
Increased by 0.8% points from 2024 (3.4%)
What is the data showing?
Our disability pay gaps remain relatively small, with a reduction in the median and an increase in the mean pay gap between April 2024 and April 2025. The median gap reduced by 0.7% points to 5.2% and the mean gap increased by 0.8% points to 4.2%. The gap is relatively low as the representation of disabled colleagues compared to non-disabled colleagues is distributed more evenly across the organisation, as highlighted by the pay quartile data. The main driver of the pay gaps we do see is the slightly higher representation of disabled colleagues compared to non-disabled colleagues in the ‘lower’ quartile. In 2024 we had 9%* of student joiners disclose they had a disability, an increase from 6% in 2023.
Action we’re taking to close the gap
We have several initiatives dedicated to attracting and supporting disabled colleagues in our firm, including our student recruitment programme ‘Thrive’ and our ‘Abilities Talent Insight Programme’. ‘Thrive’ was designed to connect with students with disabilities and long-term conditions and create an authentic space to discuss how we support people to come as they are in the workplace. In 2025 we have put a focus on inclusion and equity with a project to transform the workplace adjustments process. We have also evolved our disability data collection to include more granular categories of conditions that better reflect our people and are more inclusive of neurodiversity. Disability is a key checkpoint across our people processes, ensuring we are monitoring this additional characteristic when analysing outcomes across our business. You can find out more about the action we are taking here.
*For FY25 reporting, figures have been restated on a calendar-year basis instead of a financial-year basis, as students recruited during a single recruitment period may have start dates across two financial years.
We report our disability pay gap on a voluntary basis. The disability pay gap is the difference in average pay between colleagues who have declared themselves as having a disability and those who have declared that they do not have a disability, regardless of their role, level, length of service or location and any other differentiating factors. Our disability data is based on those individuals who have chosen to declare their disability status, which for the April 2025 dataset contains a total staff and partner population of 12,643 with a Non-disabled / Disabled split of 11,381/1,262. For comparative year on year data see here.
Pay quartiles (inc. Equity Partners)
Q1 lower
Q2 lower middle
Q3 upper middle
Q4 upper
What is the data showing?
Our disability pay gaps remain relatively small, with a reduction in the median and an increase in the mean pay gap between April 2024 and April 2025. The median gap reduced by 0.7% points to 5.2% and the mean gap increased by 0.8% points to 4.2%. The gap is relatively low as the representation of disabled colleagues compared to non-disabled colleagues is distributed more evenly across the organisation, as highlighted by the pay quartile data. The main driver of the pay gaps we do see is the slightly higher representation of disabled colleagues compared to non-disabled colleagues in the ‘lower’ quartile. In 2024 we had 9%* of student joiners disclose they had a disability, an increase from 6% in 2023.
Action we’re taking to close the gap
We have several initiatives dedicated to attracting and supporting disabled colleagues in our firm, including our student recruitment programme ‘Thrive’ and our ‘Abilities Talent Insight Programme’. ‘Thrive’ was designed to connect with students with disabilities and long-term conditions and create an authentic space to discuss how we support people to come as they are in the workplace. In 2025 we have put a focus on inclusion and equity with a project to transform the workplace adjustments process. We have also evolved our disability data collection to include more granular categories of conditions that better reflect our people and are more inclusive of neurodiversity. Disability is a key checkpoint across our people processes, ensuring we are monitoring this additional characteristic when analysing outcomes across our business. You can find out more about the action we are taking here.
The quartiles set out the disability distribution across KPMG in four equally-sized quartiles.
You can see more detail on our representation data here.
*For FY25 reporting, figures have been restated on a calendar-year basis instead of a financial-year basis, as students recruited during a single recruitment period may have start dates across two financial years.
Total earnings (inc. Equity Partners)
Professional vs lower
socio-economic background
Median socio-economic background pay gap as of April 2025, including equity partners
6.8%
Reduced by 0.2% points from 2024 (7.0%)
Mean socio-economic pay gap as of April 2024, including equity partners
-0.8%
Reduced in the negative by 2.9% points from 2024 (-3.7%)
Professional vs intermediate
socio-economic background
Median socio-economic background pay gap as of April 2025, including equity partners
11.9%
Increased by 2.0% points from 2024 (9.9%)
Mean socio-economic background pay gap as of April 2025, including equity partners
8.6%
Increased by 0.6% points from 2024 (8.0%)
Intermediate vs lower
socio-economic background
Median socio-economic background pay gap as of April 2025, including equity partners
-5.7%
Increased in the negative by 2.4% points from 2024 (-3.3%)
Mean socio-economic background pay gap as of April 2025, including equity partners
-10.3%
Reduced in the negative by 2.5% points from 2024 (-12.8%)
What is the data showing?
Between April 2024 and April 2025, we have seen a reduction in the professional vs lower socio-economic background (SEB) pay gap with both median and mean measures closing towards zero. The median gap reduced by 0.2% points to 6.8% and the mean gap reduced in the negative by 2.9% points to -0.8%. Our SEB pay gaps remain relatively small with the widest gaps in the intermediate SEB category, with gaps in favour of our professional and low SEB colleagues in the ‘professional vs intermediate’ and ‘intermediate vs low’ SEB pay gaps respectively. The pay gaps exist because of the distribution of colleagues from professional, intermediate and low SEB across the grade structure, as highlighted by the pay quartiles. The smaller gaps are reflective of socio-economic diversity being distributed more evenly across the organisation. Over the last four years we have seen changes in our population with the overall representation of colleagues from professional/higher SEBs reducing from 64% in 2021 to 56% in 2025. In contrast, representation of colleagues from intermediate SEBs has increased from 16% in 2021 to 23% in 2025. Whilst the overall headcount of colleagues from lower SEBs has increased over the same period, the representation has remained at 21%.1
Action we’re taking to close the gap
In response to our research into progression rates at our firm , which highlighted that those from lower SEBs were impacted more than other historically under-represented groups, we have implemented a suite of progression focused initiatives. Our promotion readiness programme ‘Reach’, supports colleagues to develop a progression mindset and prepare for promotion interviews. In 2025, we launched our ‘Thrive Together’ cross company peer mentoring programme which pairs colleagues from low SEBs across different organisations, to share experiences and learning from different industries to support professional development. Our flagship IDE development programmes, Inspire and Elevate, are inclusive to Low SEB colleagues with 26% of participants in 2025 being from low SEBs. We also have a number of initiatives dedicated to attracting and supporting colleagues from diverse backgrounds to our firm, including our ‘Discovery’ work experience and ‘Social Mobility Talent Insight’ programmes. SEB is a key checkpoint across our people processes, ensuring we are monitoring this additional characteristic when analysing outcomes across our business.
You can find out more about the action we’re taking here.
1The percentages reported for 2021 add up to 101% due to rounding (Professional/Higher = 63.78% in 2021 and 55.69% in 2025, Intermediate = 15.68% in 2021 and 22.93% in 2025, Lower = 20.55% in 2021 and 21.38% in 2025).
We report our socio-economic background pay gap on a voluntary basis. The socio-economic background pay gap is the difference in average pay between colleagues who have declared themselves as having parents in a professional, intermediate or routine/manual occupation, regardless of their role, level, length of service or location and any other differentiating factors. Our socio-economic background data is based on those colleagues who have chosen to declare their socio-economic background which for the April 2025 dataset contains a total staff and partner population of 10,837 with a Professional / Intermediate / Lower split of 6,087 / 2,468 / 2,282. For comparative year on year data see here.
Pay quartiles (inc. Equity Partners)
Professional vs Lower socio-economic background
Q1 lower
Q2 lower middle
Q3 upper middle
Q4 upper
Professional vs Intermediate socio-economic background
Q1 lower
Q2 lower middle
Q3 upper middle
Q4 upper
Intermediate vs Lower socio-economic background
Q1 lower
Q2 lower middle
Q3 upper middle
Q4 upper
The quartiles set out the socio-economic background distribution across KPMG in four equally-sized quartiles.
You can see more detail on our representation data here.
How we calculate
our pay gaps
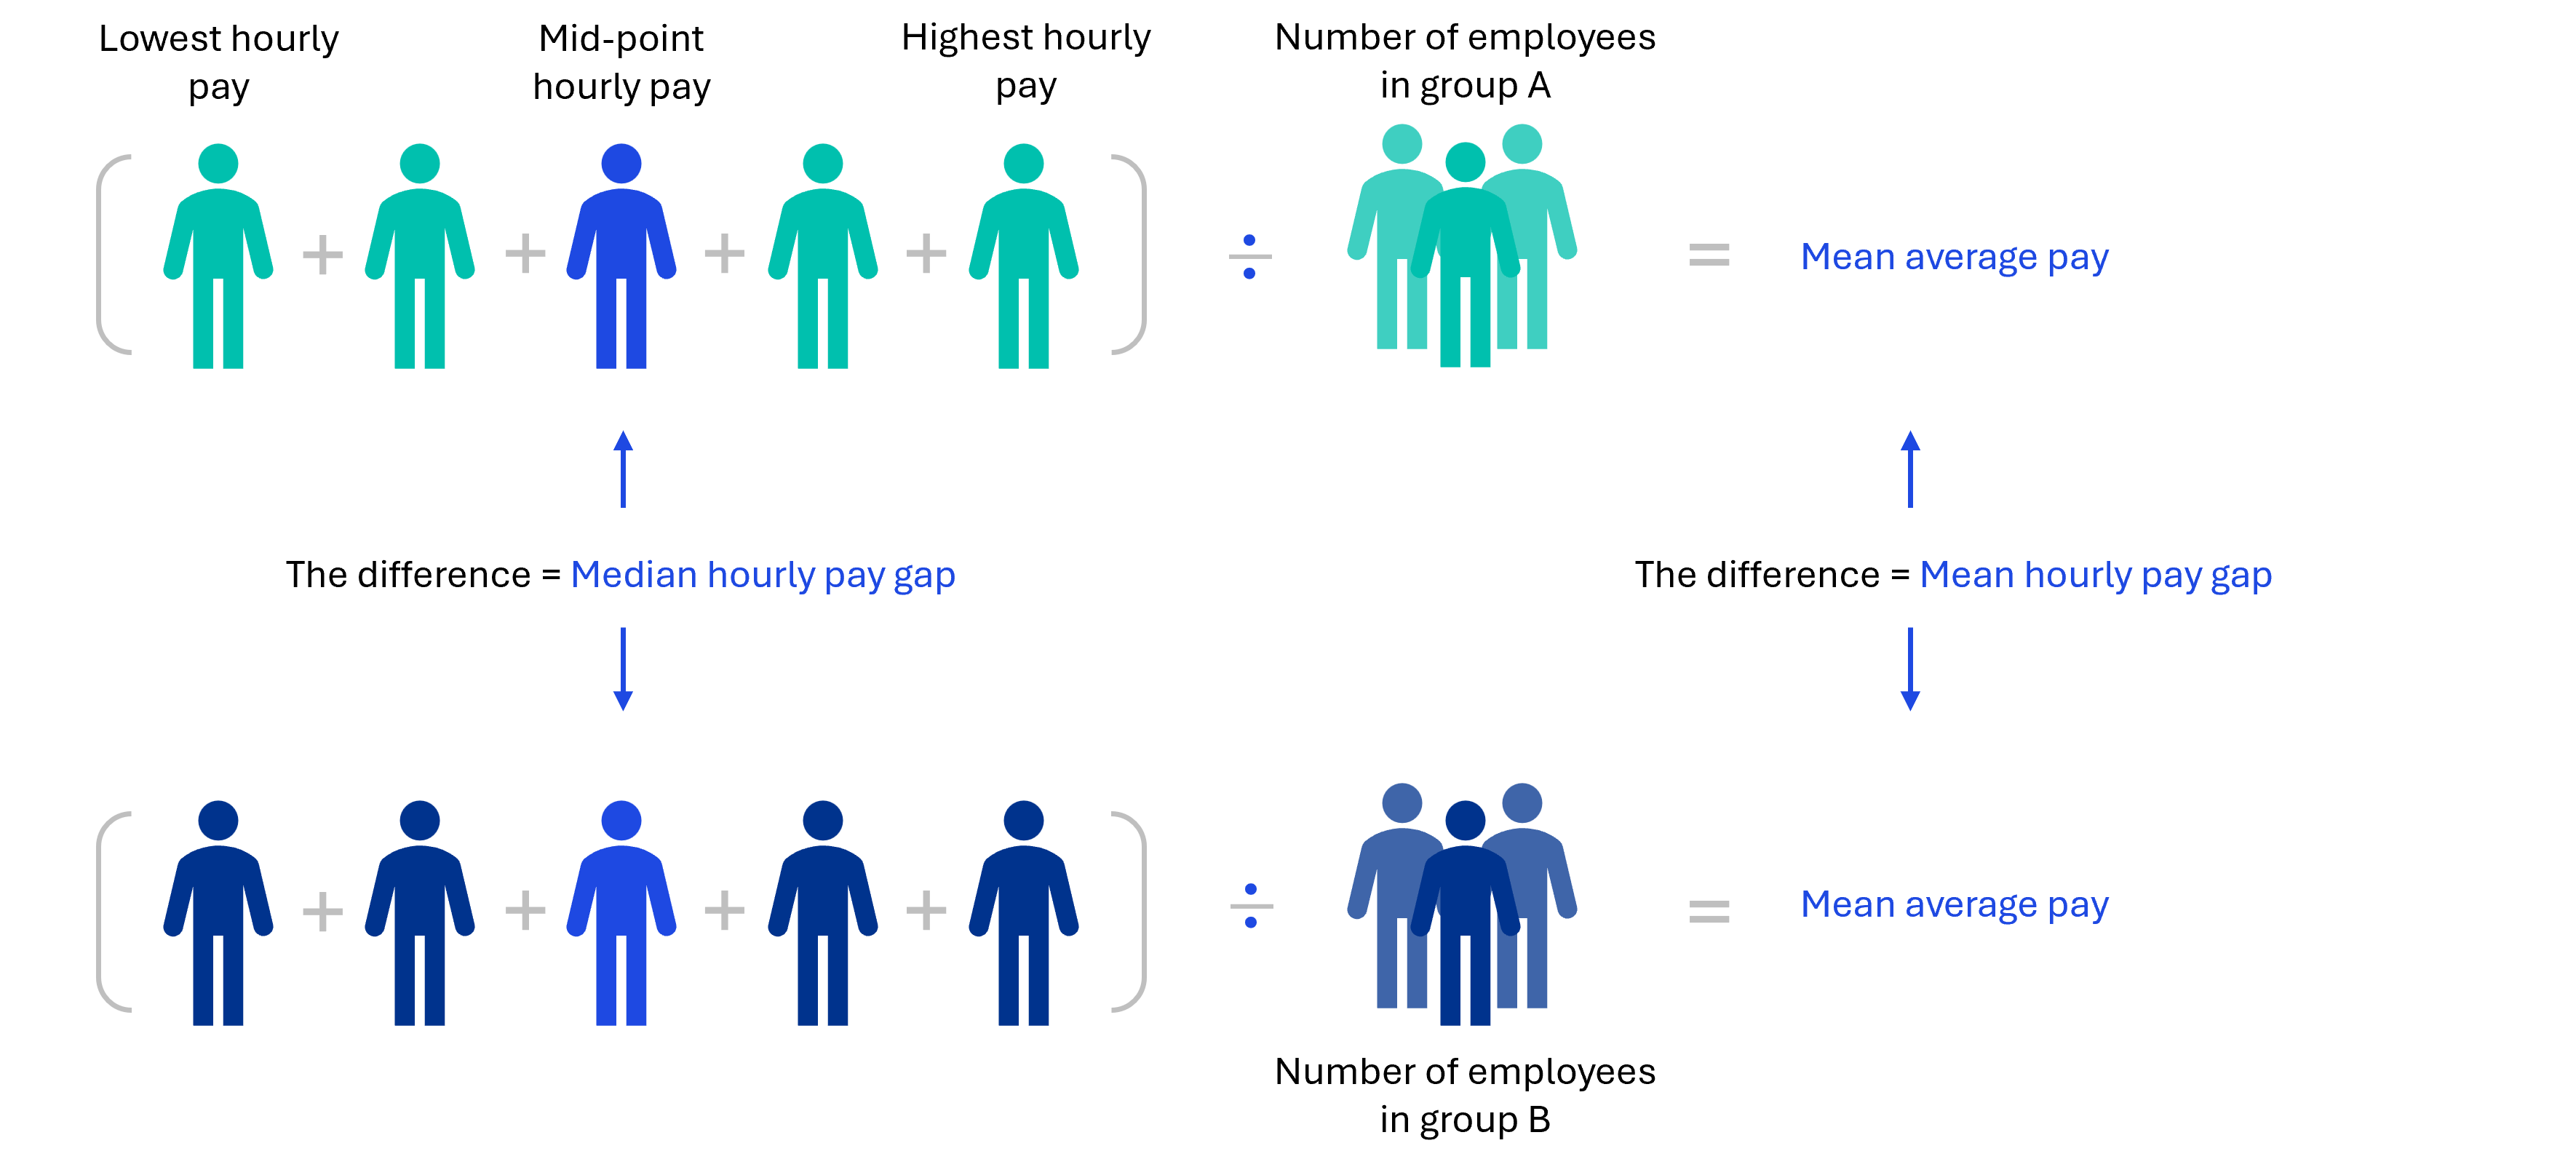
What’s the difference between median and mean?
A mean pay gap is calculated by adding up all of the relevant groups’ pay and dividing it by the number of people for the two populations you are comparing. The difference between those two averages is the mean pay gap.
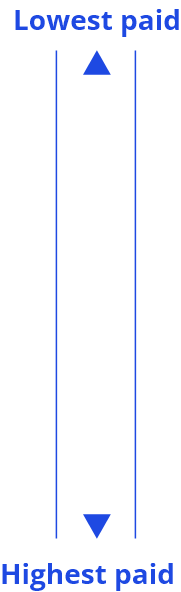
A median pay gap is calculated by lining up all of the relevant groups’ pay and finding the midpoint for the two populations you are comparing. The difference between those two mid-points is the median pay gap.
What’s the difference between the pay gap and equal pay?
Pay gaps do not measure pay equity. Equal pay refers to colleagues who are performing equal work, of equal value, receiving equal pay. Equal pay is a legal requirement in the UK. We have robust processes and monitoring in place to ensure that our people are treated and paid fairly.
Case studies
At KPMG UK, transparency and inclusion are at the heart of our culture. Our commitment to reporting pay gaps began in 2015, well before it became a legal requirement to do so. Over the past decade, we’ve evolved from voluntary reporting to leading the conversation on broader pay gap disclosures, setting benchmarks for the industry.
2015: Voluntary Reporting Begins
In 2015, we took the proactive step of publishing our gender pay gap data voluntarily. At that time, our median basic pay gap was 21.4%. This decision reflected our belief that transparency drives accountability and progress.
2018: Legal Requirement and Continued Leadership
By April 2018, gender pay gap reporting became mandatory across the UK. Our median gap then stood at 22.1%. While the requirement applied to all large employers, we continued to go beyond compliance—using the opportunity to explain the actions we were taking to create a more inclusive workplace.
2025: Significant Progress
Fast forward to 2025, and our median basic pay gap has reduced to 15.7%. This improvement is the result of sustained efforts to:
- Increase the representation of women in senior roles.
- Implement inclusive recruitment and promotion practices.
- Support flexible working and career development programmes.
We are proud of this progress, but we know there is more to do.
Expanding Our Reporting Beyond Gender
Our approach to gender pay gap reporting has shaped how we report in other areas:
- Ethnicity Pay Gap: Reported since 2017.
- Black Heritage, Disability and Sexual Orientation Pay Gaps: Reported since 2021. A bill to make ethnicity and disability pay gap reporting a legal requirement is currently progressing through Parliament—an area where we’ve been ahead of the curve.
Leading on Socio-Economic Background Reporting
In September 2021, we became one of the first businesses to publish data and a framework for reporting pay gaps by socio-economic background. This initiative reflects our belief that inclusion must address all dimensions of diversity.
Our Commitment
We remain committed to transparency and continuous improvement. By sharing our data and the actions we’re taking, we aim to lead by example, make the difference and help shape a fairer future for all.
Hear from our students to find out what life is like at KPMG and you can explore our student programmes data to see how it drives diversity from the bottom up.
| Diversity %'s | 2023 | 2024 | 2025 |
| Female | 52% | 51% | 50% |
| Ethnic Minority | 42% | 37% | 35% |
| Black heritage | 5% | 6% | 7% |
| Disability | 6% | 9% | 7% |
| Lesbian, Gay, Bi (LGB) | 8% | 8% | 5% |
| Lower socio-economic background | 17% | 22% | 24% |
For FY25 reporting, figures have been restated on a calendar-year basis instead of a financial-year basis, as students recruited during a single recruitment period may have start dates across two financial years.
In 2024 we launched two new Inclusion, Diversity and Equity development programmes, ‘Inspire and Elevate’, which bring together the best of our previous award-winning programmes into a refreshed offering. The programmes, open to all, with a focus on colleagues from historically under-represented groups from assistant manager to director, put intersectional colleague experiences at their heart. From design consultations with diverse stakeholders, all the way through to the celebration event, we created the programmes with, and for our colleagues.
We wanted to create an open, safe and inclusive space to highlight the value of our unique experiences. We were keen to ensure this was accessible to colleagues from all areas of the business, exploring personal development topics that were relatable for everyone, including authenticity, creating a growth mindset, resilience and self-belief. Ethan, a newly promoted Director in our Advisory business, took part in the Elevate programme before he was promoted and you can hear more about his experience of the programme.
Chief Executive pay
We’re committed to transparency and on a voluntary basis publish the ratio of our UK Chief Executive’s total remuneration to that of our employees at the 25th, 50th and 75th percentile (calculated on a full-time equivalent basis of the active population of salaried colleagues as at 30 September 2024).
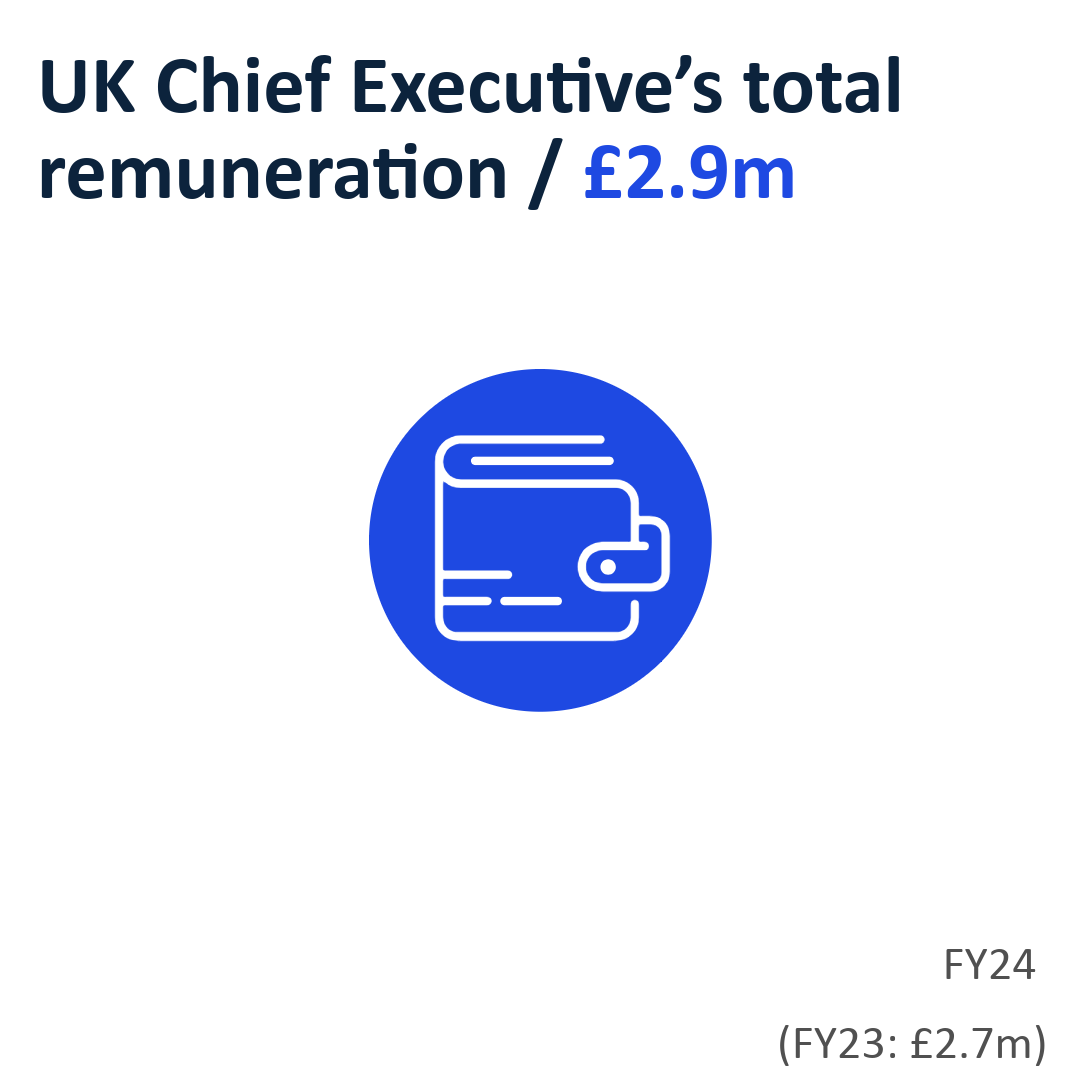
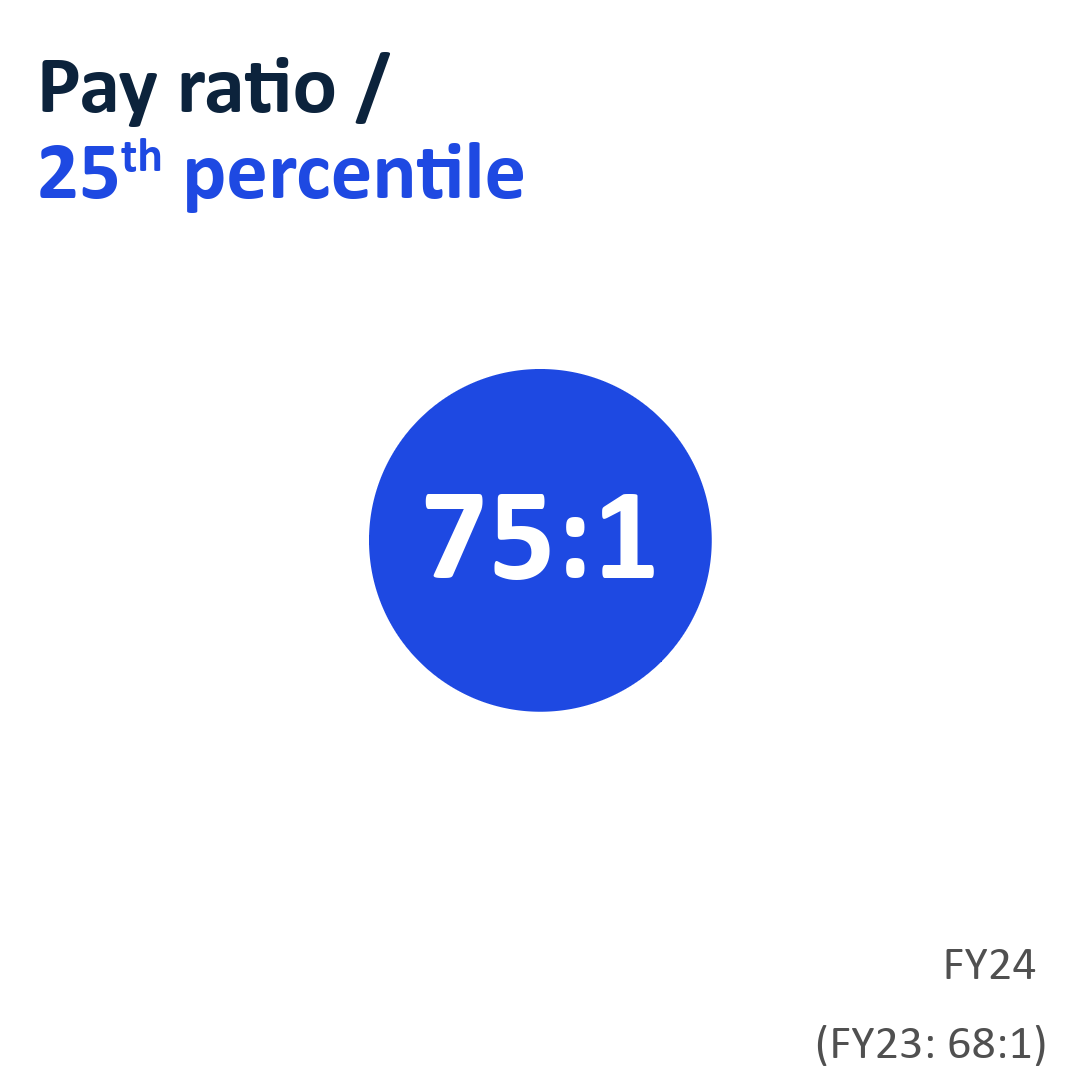
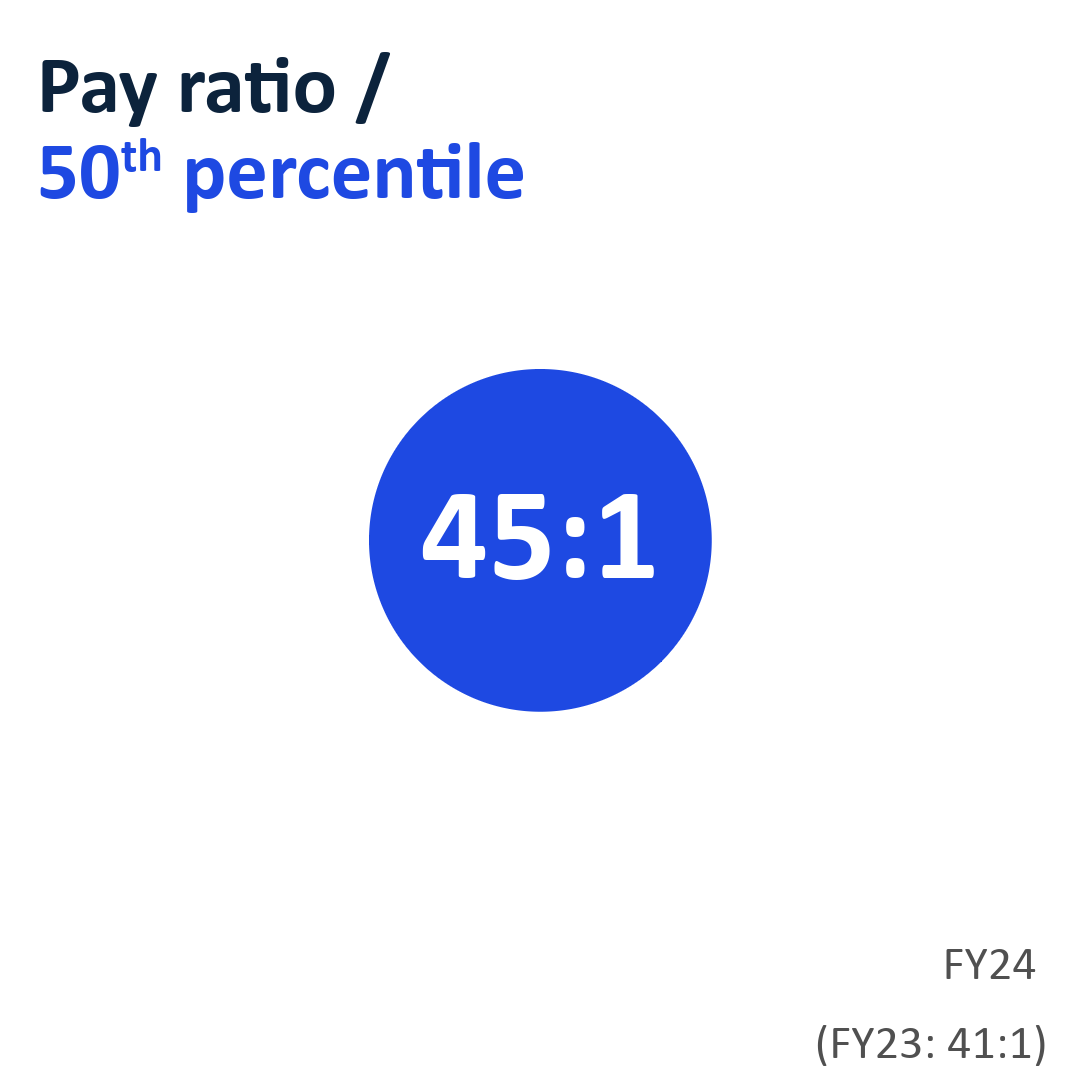
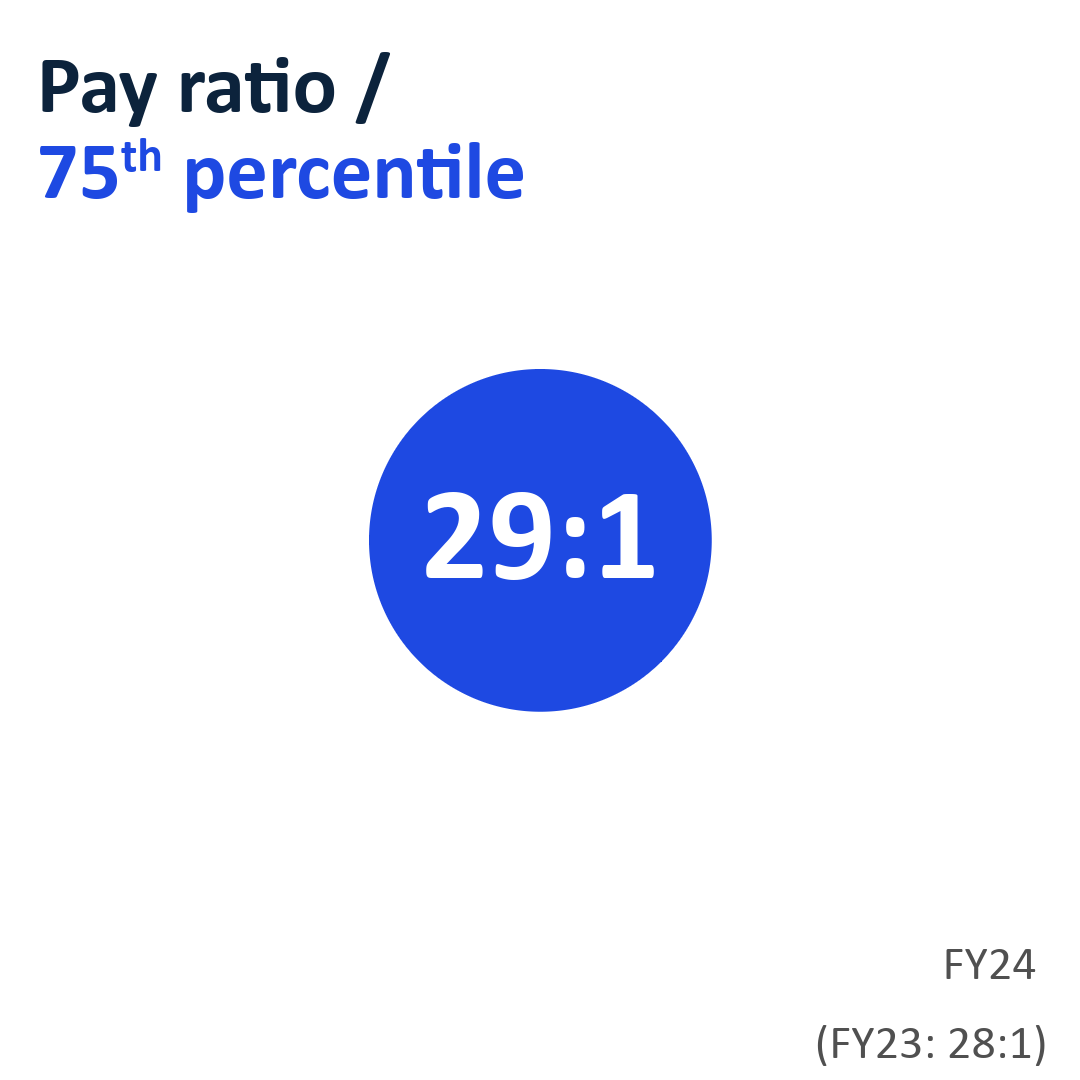
The total remuneration figure reflects the role of Chief Executive being undertaken by Jon Holt for the entire period of FY24.
Figures will be updated for FY25 alongside publication of the UK Members’ Report and Financial Statements 2025.