
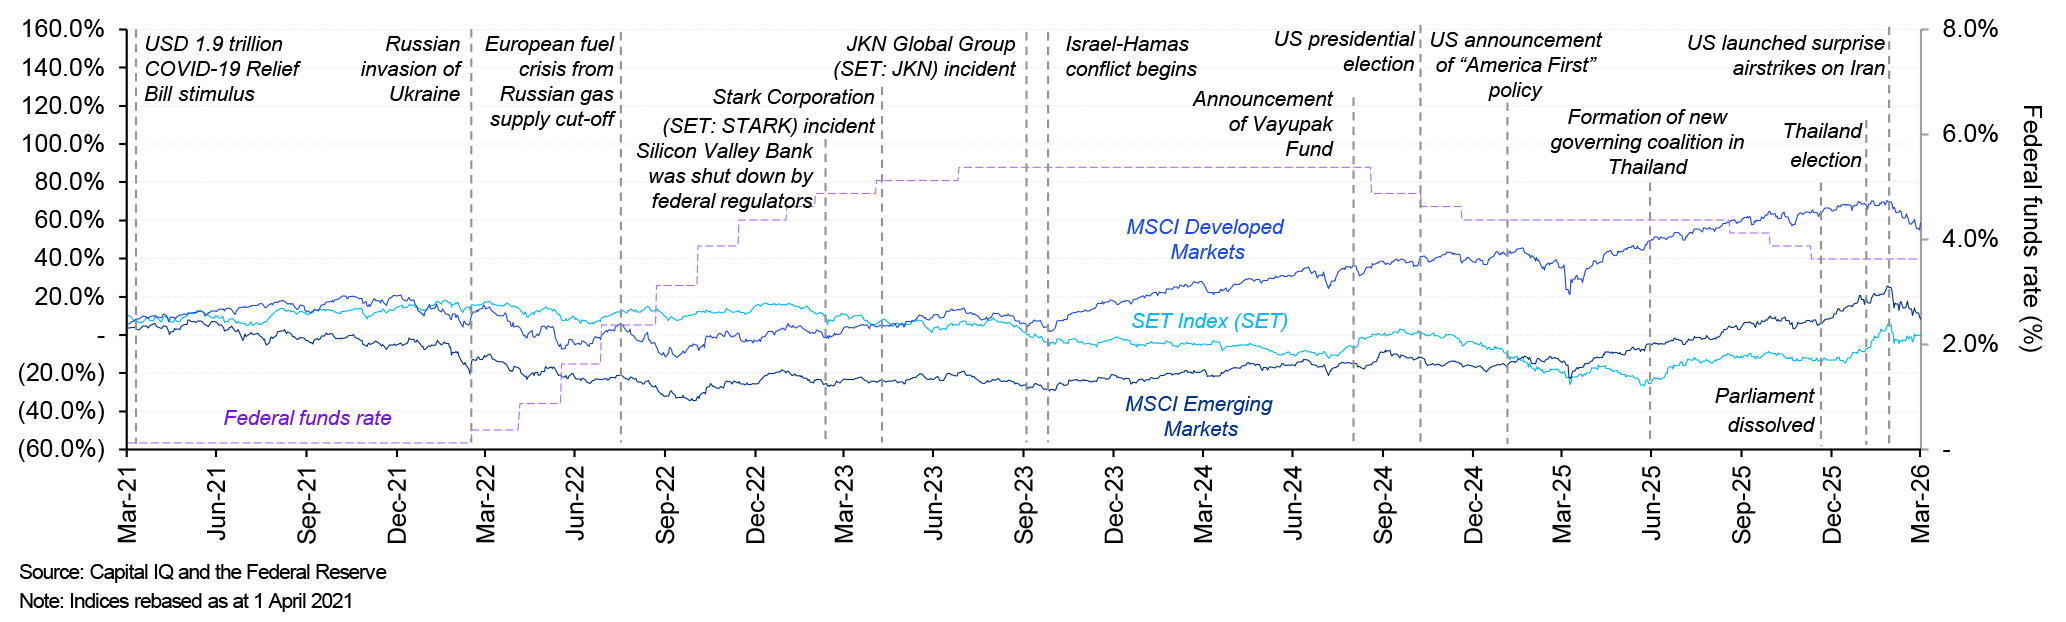
- In Q1/2026, the SET Index recorded steady gains throughout the quarter, with a short-term dip at the onset of the Iran conflict. The TECH sector demonstrated the strongest improvement, followed by the Energy sector, which benefited from profit gains driven by existing oil inventories during the period of elevated oil prices.
- The prolonged Iran conflict continues to drive elevated energy costs, weighing on inflation and Thailand’s trade balance. Key sectors, including manufacturing, petrochemicals, transport, and tourism, face margin pressure, resulting in higher earnings uncertainty, cash flow volatility, and overall business risk.
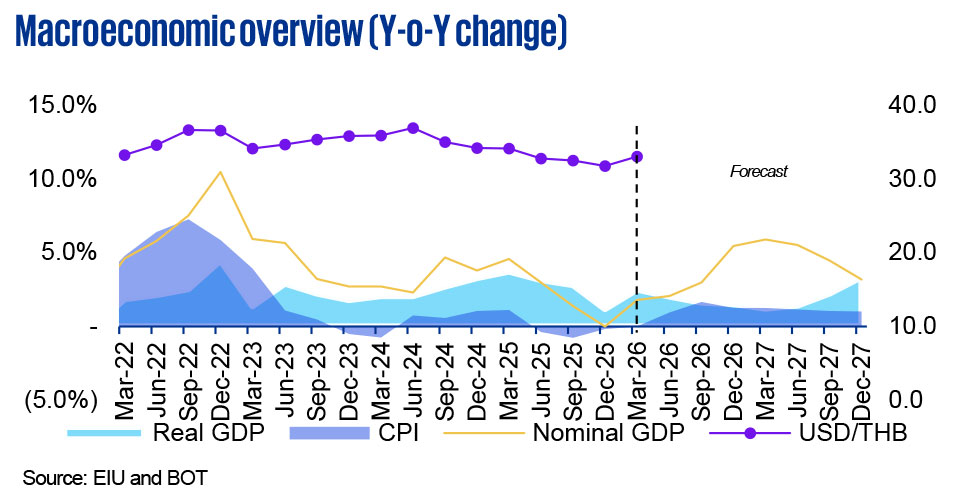
- Thailand’s 2025 GDP growth was revised up to 2.4% from 2.2%, supported by stronger private investment and exports. However, growth is expected to remain below potential at 1.5% in 2026 and 2.0% in 2027, due to weaker consumption, rising living costs, and weaker income prospects. Tourism is also expected to slow amid travel restrictions and higher costs.
- The Thai baht appreciated from 33.0 to 31.7 per USD (BOT average selling rates) by 31 March 2026, driven by a current account surplus and a weakening US dollar, with some portfolio inflows influenced by interest rate differentials.
Capital market performance
 > Click on the image to enlarge it
- US federal funds rate: At the April meeting, the Federal Open Market Committee (FOMC) maintained the target range for the federal funds rate at 3.50% to 3.75%. The Committee noted that the economy is growing in a solid pace and inflation remains elevated, partly due to energy prices.
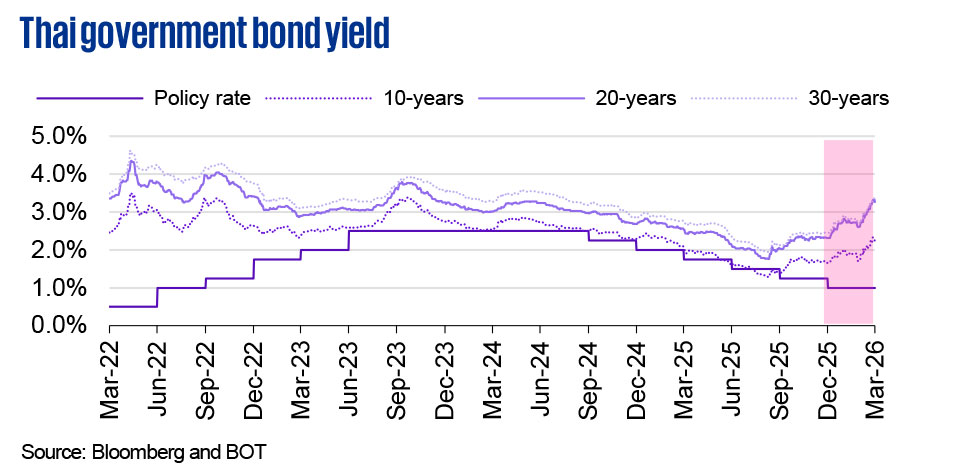
- Thai policy interest rate: The MPC maintain the policy rate at 1.00% in April 2026. While the increase in inflation is mainly driven by supply-side factor, the Committee assesses that the current policy rate remains appropriate to support a slowing economy and navigate heightened uncertainty.
- Inflation: Actual headline inflation for 2025 is at (0.1)%. However, this is projected to rise to 2.9% in 2026 and 1.5% in 2027, due to the prolonged conflict in the Middle East, which has exerted pressure through global energy prices and cost pass-through. The MPC stated that inflation is expected to remain around 3.0% before declining to an average of 1.5% from 2027 onward, while the medium-term outlook remains within the target range.
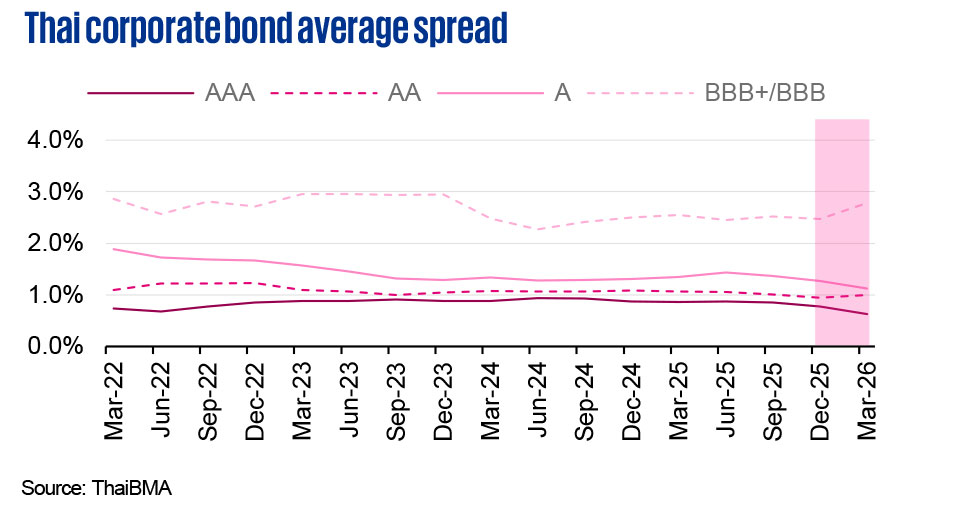
- Yield and spread: Thailand government bond yields rose in Q1/2026, driven by heightened inflation expectations, despite broadly declining US Treasury yields. The maturity spreads suggest an upward shift in domestic factors, such as bond supply dynamics and local risk premium adjustments, rather than changes in global rate expectations.
Source: BOT and Federal Reserve
 > Click on the image to enlarge it
 > Click on the image to enlarge it
 > Click on the image to enlarge it
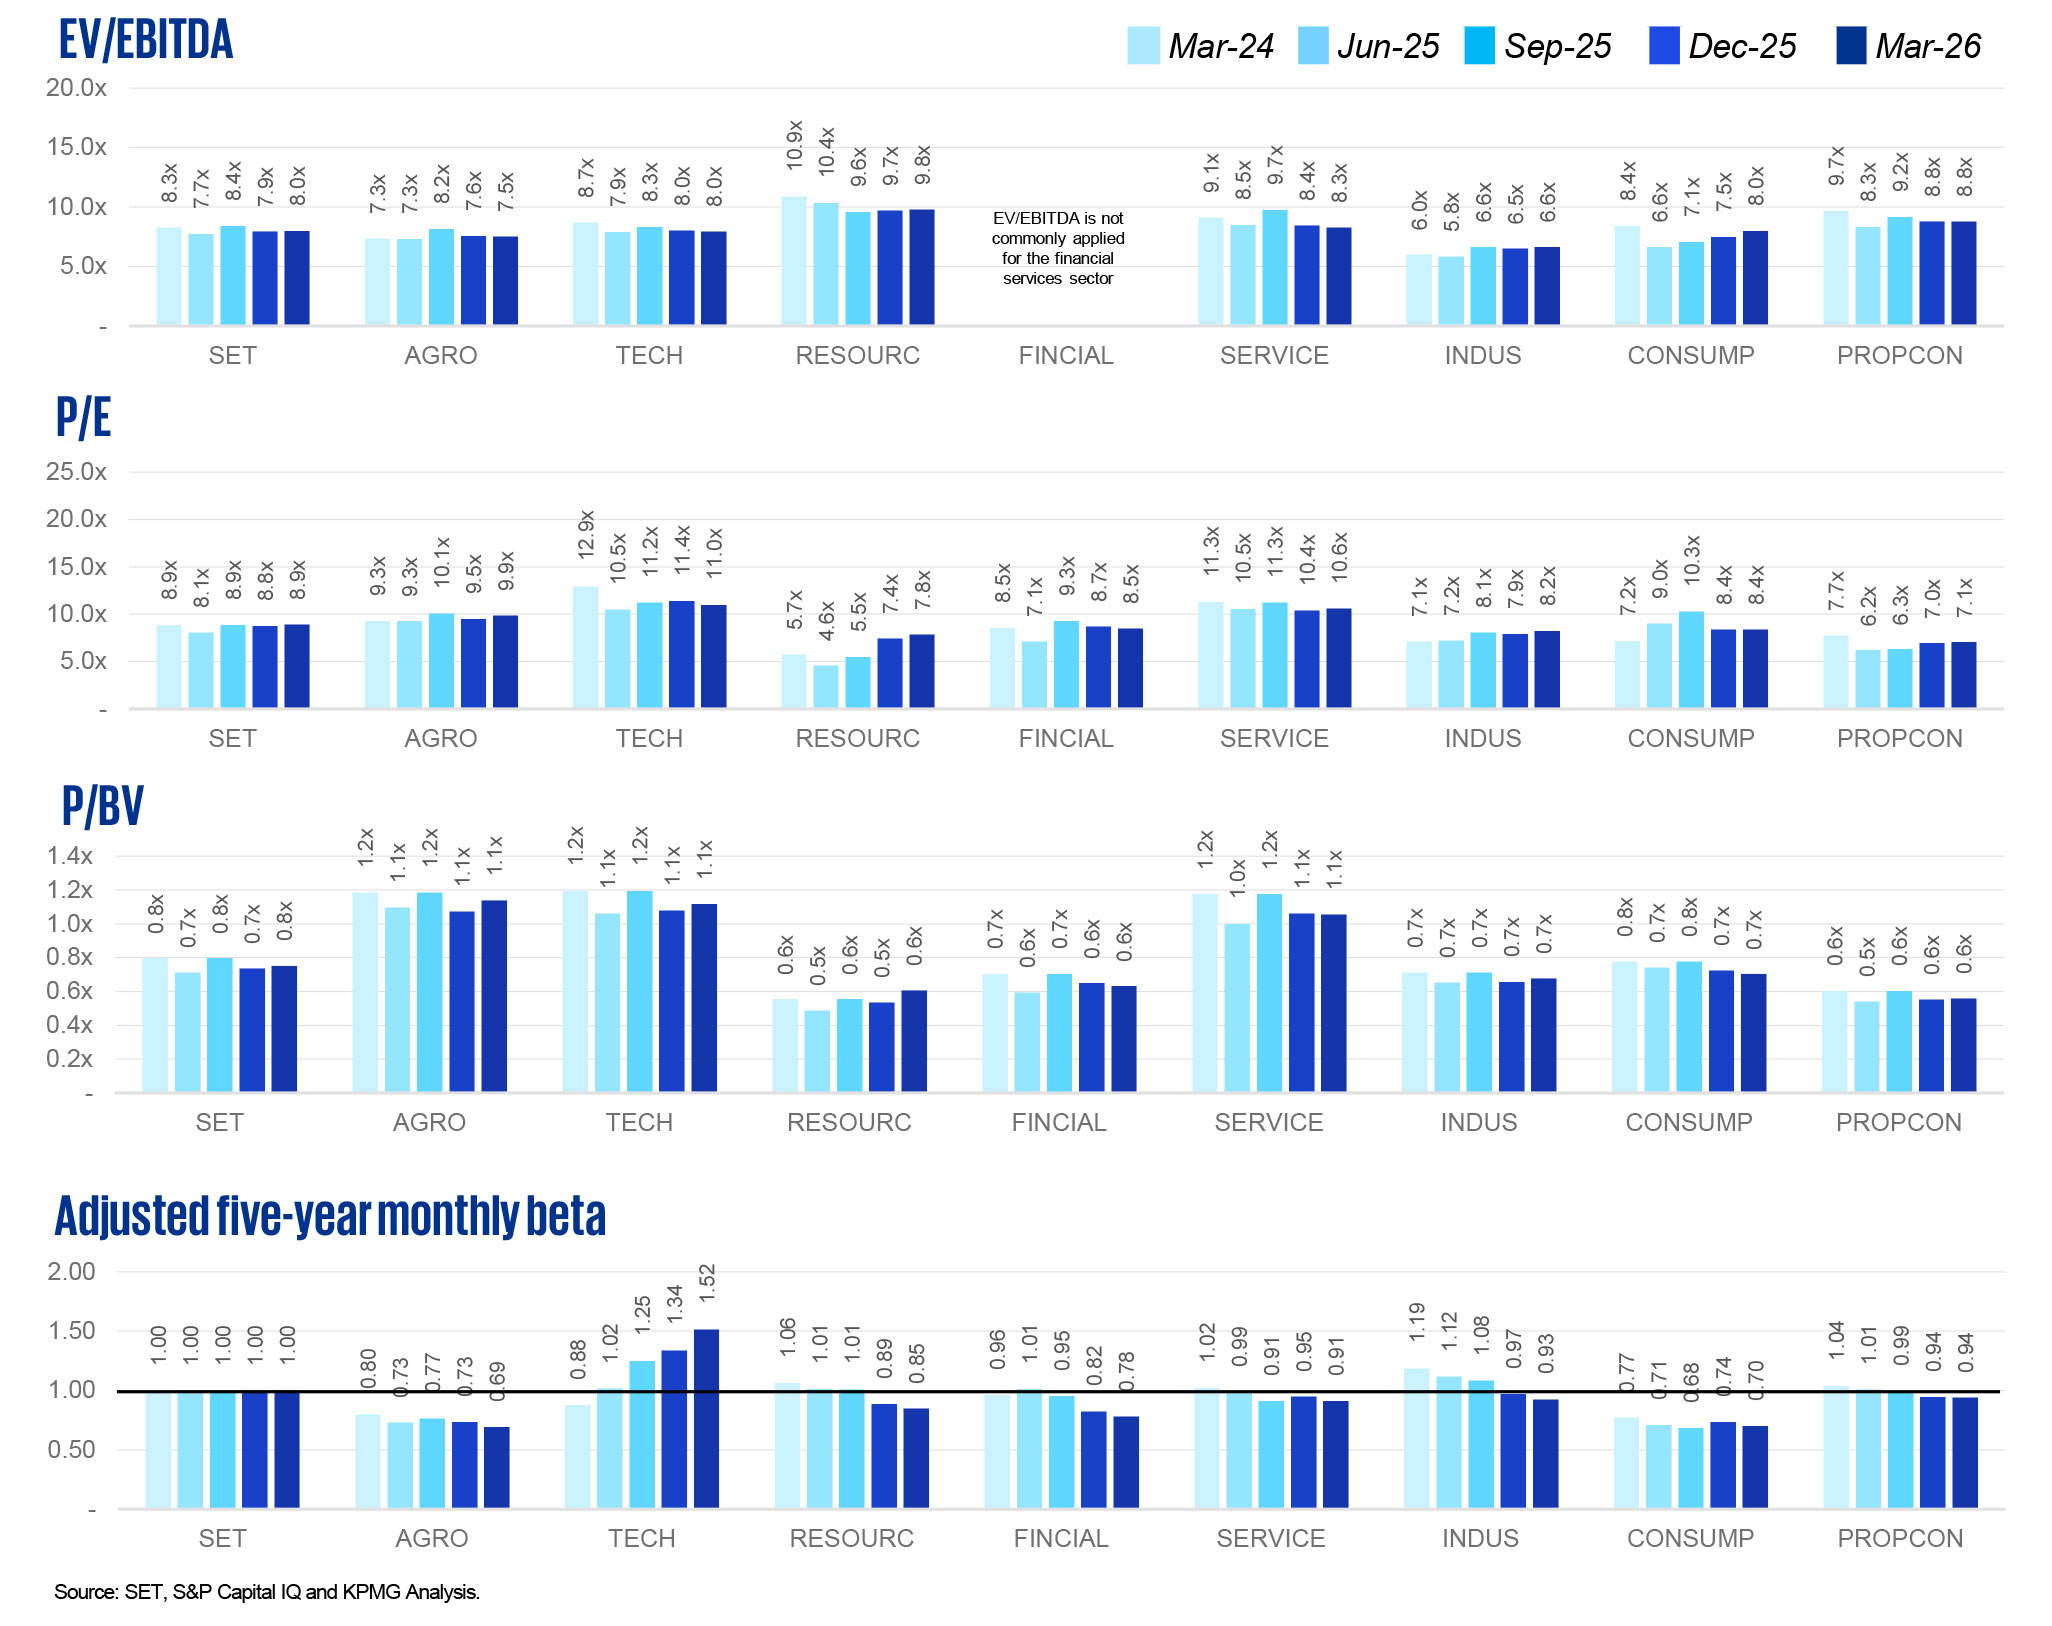
SET valuation metrics by sector (last five quarters)
The SET has eight key sector categories for listed entities. The three most common valuation multiples across five quarters in these sectors illustrate movement due to both economic fundamentals and the impact of global events on market sentiment.
 > Click on the image to enlarge it
 > Click on the image to enlarge it
The multiples in Q1/2026 remained broadly consistent with prior quarters across all sectors, despite an increase in the index, indicating that earnings growth kept pace with pricing gains.
Sector betas represent relative riskiness to the market portfolio. The stock prices of companies in the TECH sector experienced a significant increase in Q4/2025 and Q1/2026, driving a higher beta. The betas for the PROPCON sector were maintained, while the beta movements for other sectors decreased.
Returns and volatilities ofinternational indices and domestic indices by sector
 > Click on the image to enlarge it
Market returns vs. volatilities
 > Click on the image to enlarge it
- For the first time since Q4/2023, Thailand’s SET Index has delivered a superior one‑year return relative to its regional peers. Despite this recent improvement, Thailand continues to rank lowest on a five‑year return basis.
- Within the domestic market, the TECH sector recorded a new high in its one‑year performance and remains the strongest performer over the five‑year horizon. Conversely, the SERVICE sector delivered the lowest return for one-year performance, and the CONSUMP sector delivered the poorest performance in five years.
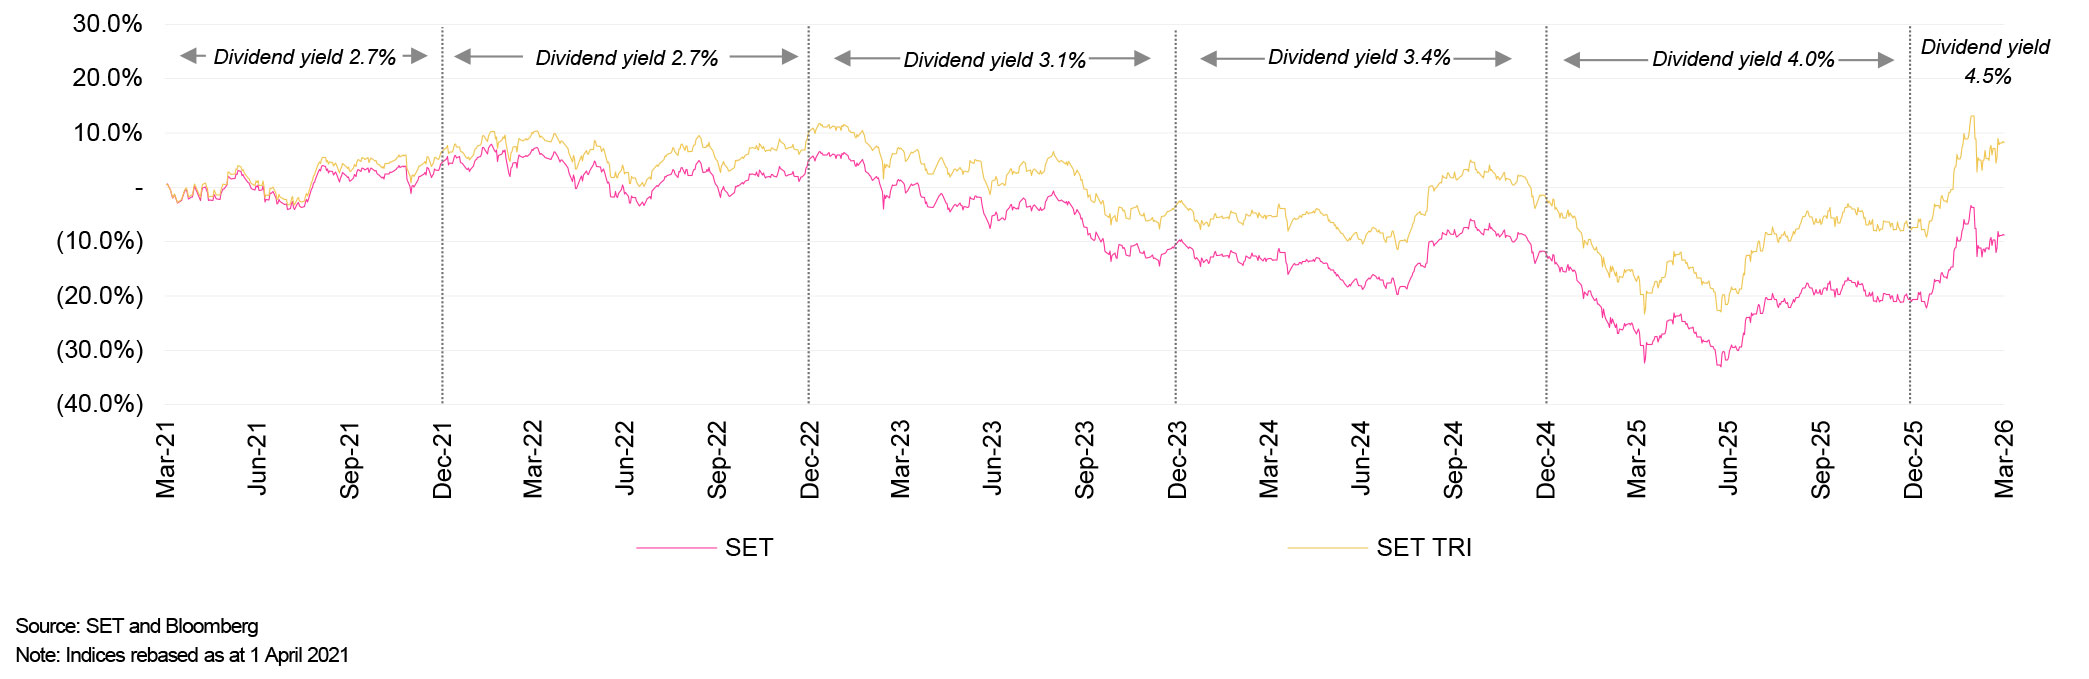
SET vs. SET TRI
 > Click on the image to enlarge it
- The Total Return Index (TRI) measures the total return from investing in securities. It comprises (1) returns arising from changes in value of the securities or “capital gain/loss”, and (2) dividends paid, assuming they are reinvested in the securities.
- At 4.5%, the 2026 dividend yield is the highest since 2020.
Data criteria
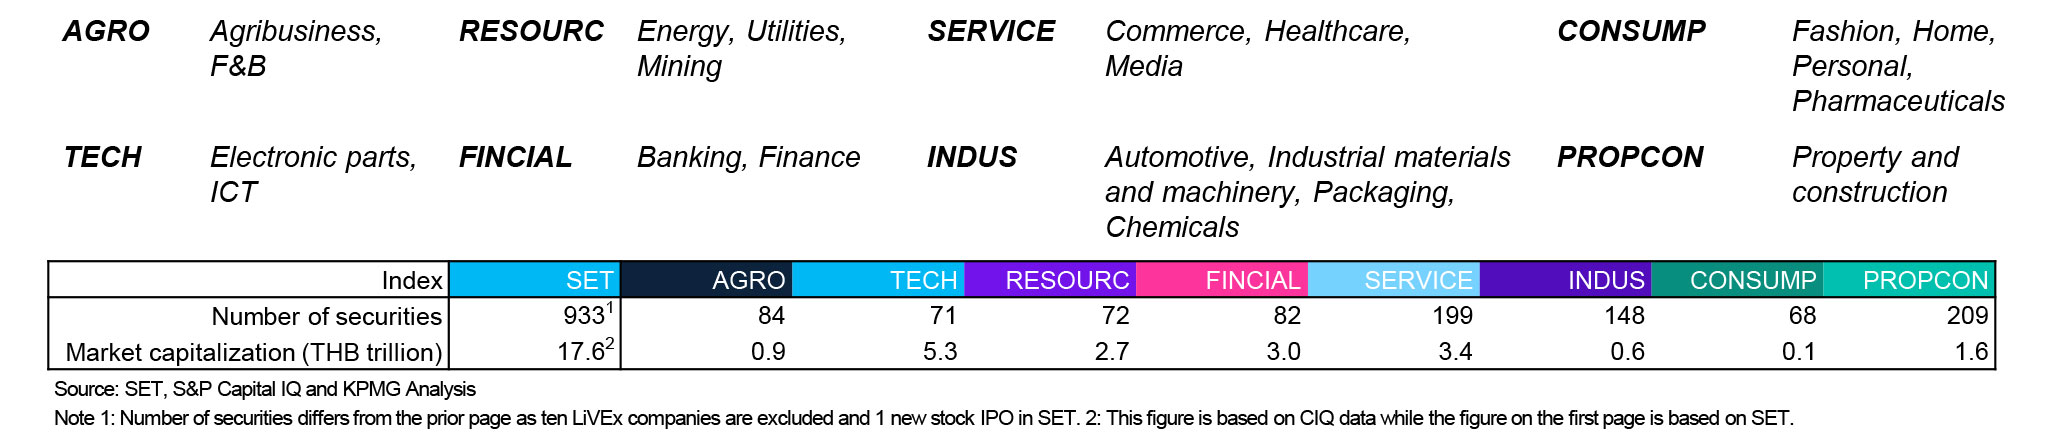
Thailand valuation multiples by sector
- The SET sector classification serves as the principal criterion for the illustrated sectors.
- The sector valuation multiples are based on the respective median.
- 12-month trailing multiples are derived from Q1/2025 to Q1/2026.
- The Q1/2026 multiple is based on the latest available financial statement information as at Q4/2025.
- The sectors’ betas are based on market capitalization-weighted adjusted betas, excluding securities with negative beta values.
- Data in historical periods may change according to Capital IQ’s retrospective adjustments.
Regression on returns and volatilities
- The total number of trading days per year is assumed to be 252 days.
- The period in the study is 1 April 2021 to 31 March 2026.
SET and SET TRI
- Annual dividend yields are based on dividend yields from Bloomberg.
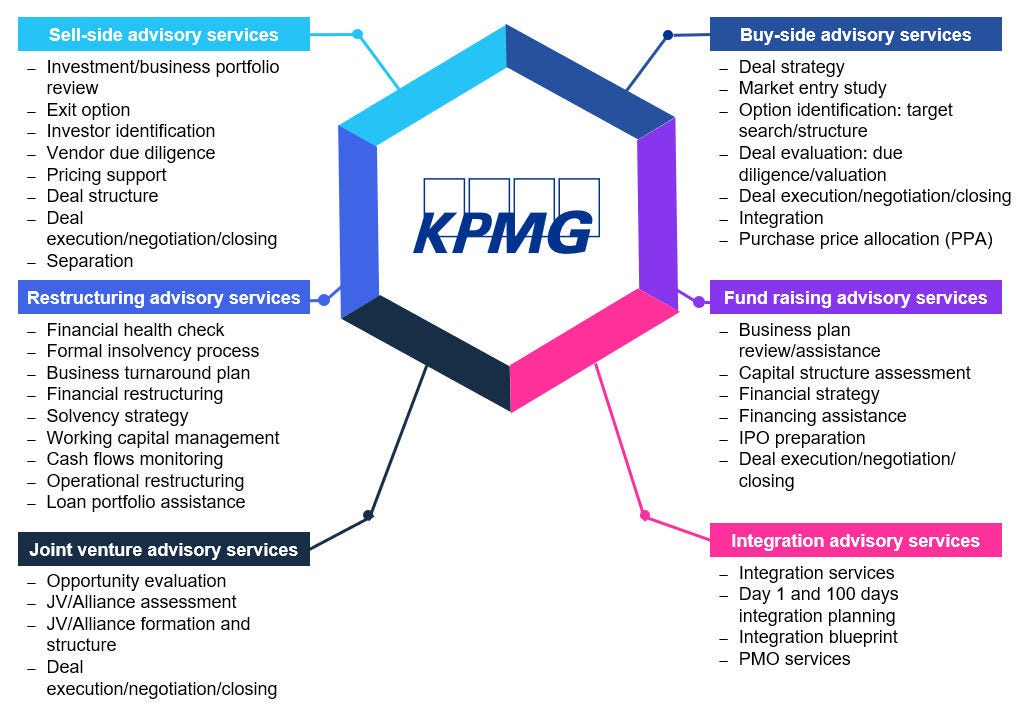
KPMG Deal Advisory
"KPMG provides a full range of valuation services for all sell-side, buy-side, tax restructuring, fund raising, and joint venture transactions."
Capital Market and Business Valuation Insight | Q1/2026
The quarterly update from Deal Advisory services, KPMG in Thailand
Key contacts


- Ian Thornhill
- Canopus Safdar
- Surayos Chuepanich
- Boonyaporn Donnapee
- Theraphol Saikaew
- Dominic Kobel
- Nalinnit Satsri
- Worachit Sirikajornkij
- Ming Ern Chew

