
We are pleased to share with you the sixth edition of our quarterly KPMG Financial Performance Index (FPI) publication. This publication provides insights into the changing state of corporate health across all companies listed and headquarter in Singapore across all sectors, following the end of the reporting season for the three months to June 2025. KPMG FPI data is refreshed on a quarterly basis. For more information, visit the KPMG FPI page.
Singapore FPI performance comparison
KPMG Financial Performance Index (KPMG FPI Singapore) analysed across:

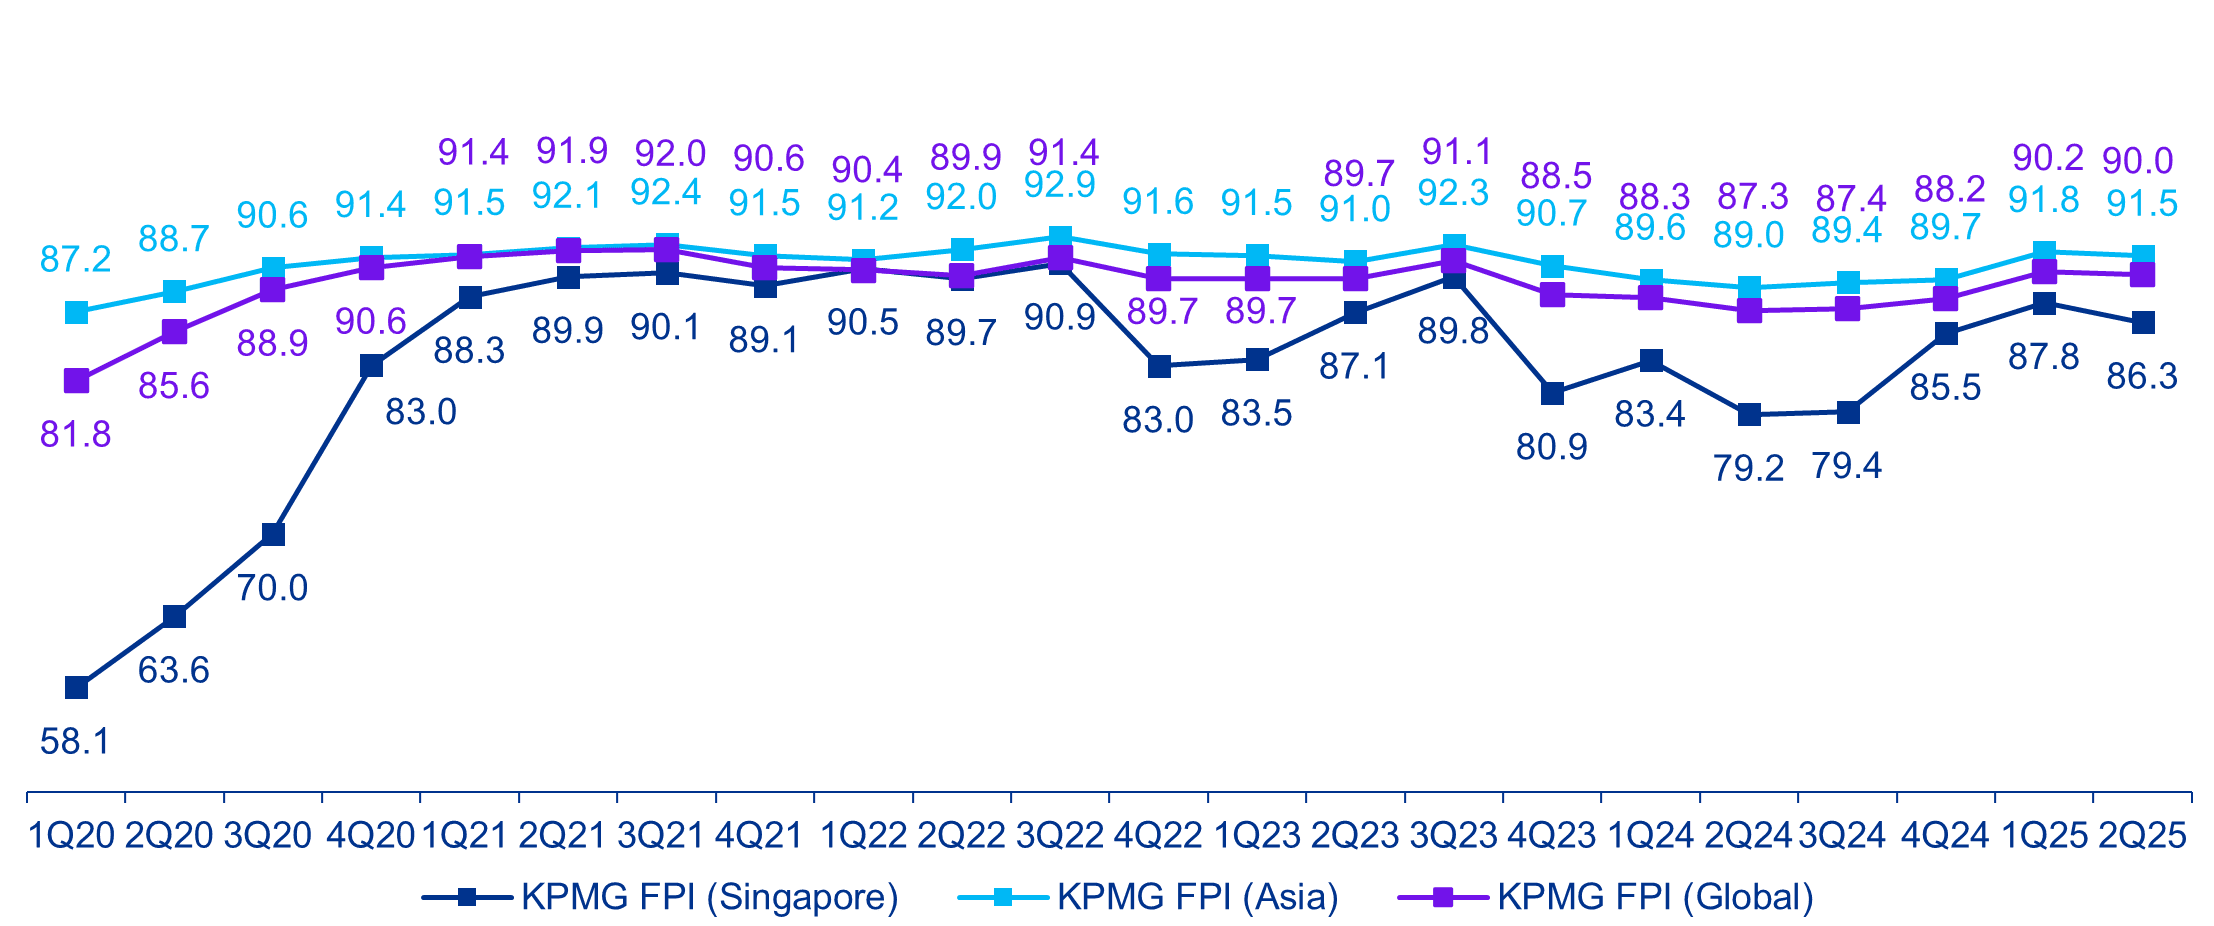
Historic FPI movement of Singapore with respect to Asia and Global trends
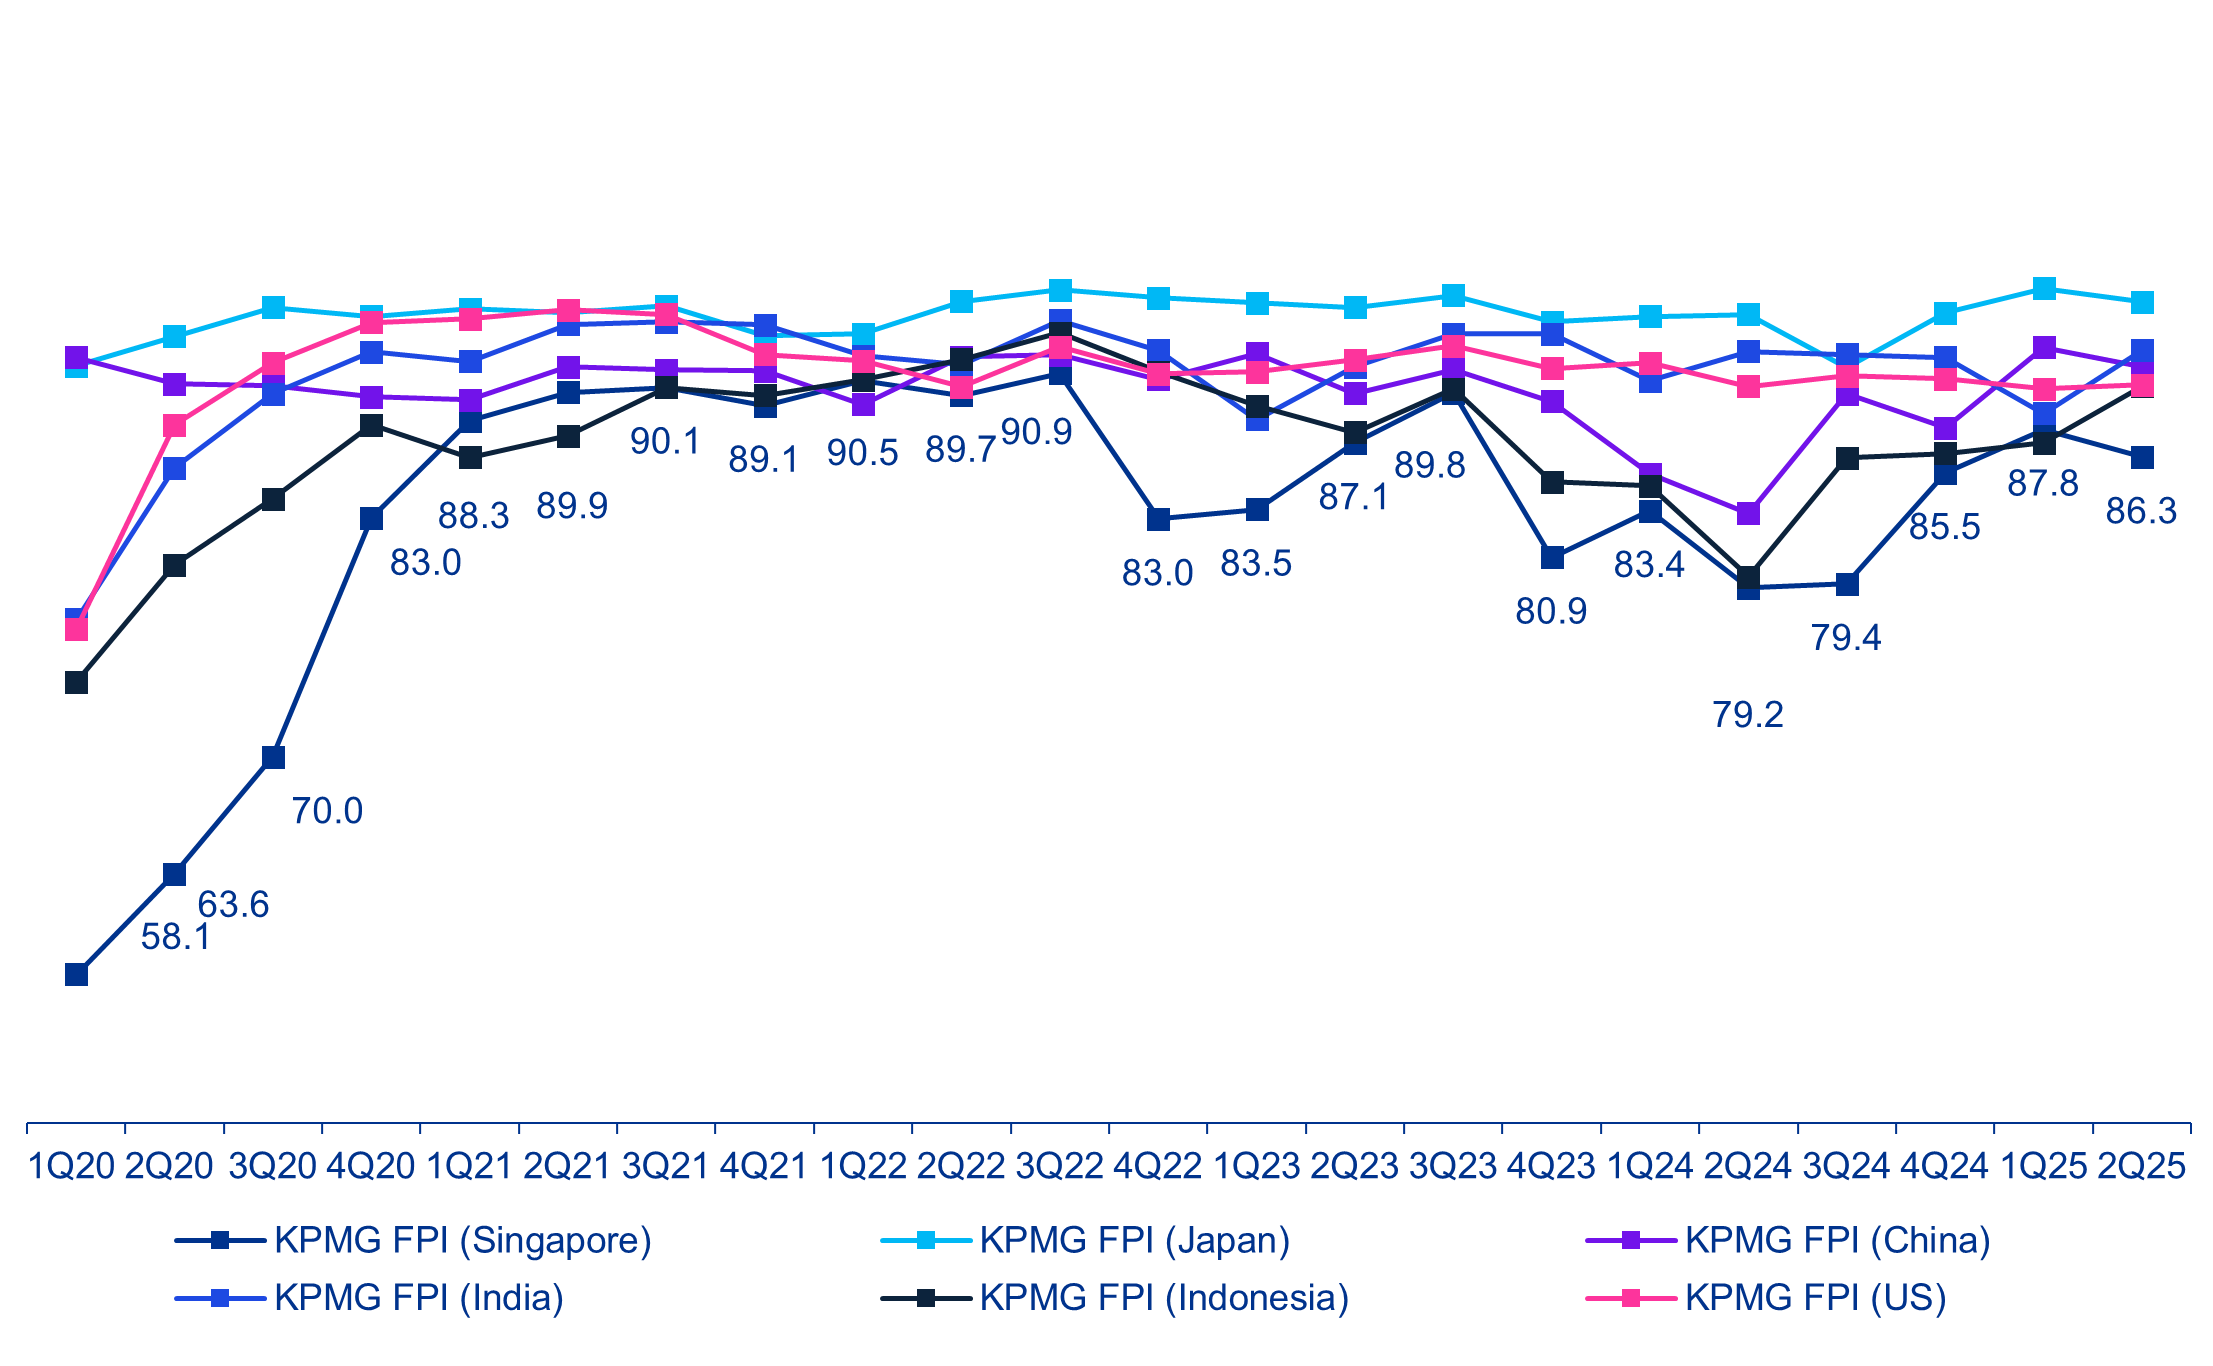
Historic FPI movement of Singapore with respect to India, Japan, China, Indonesia, and US
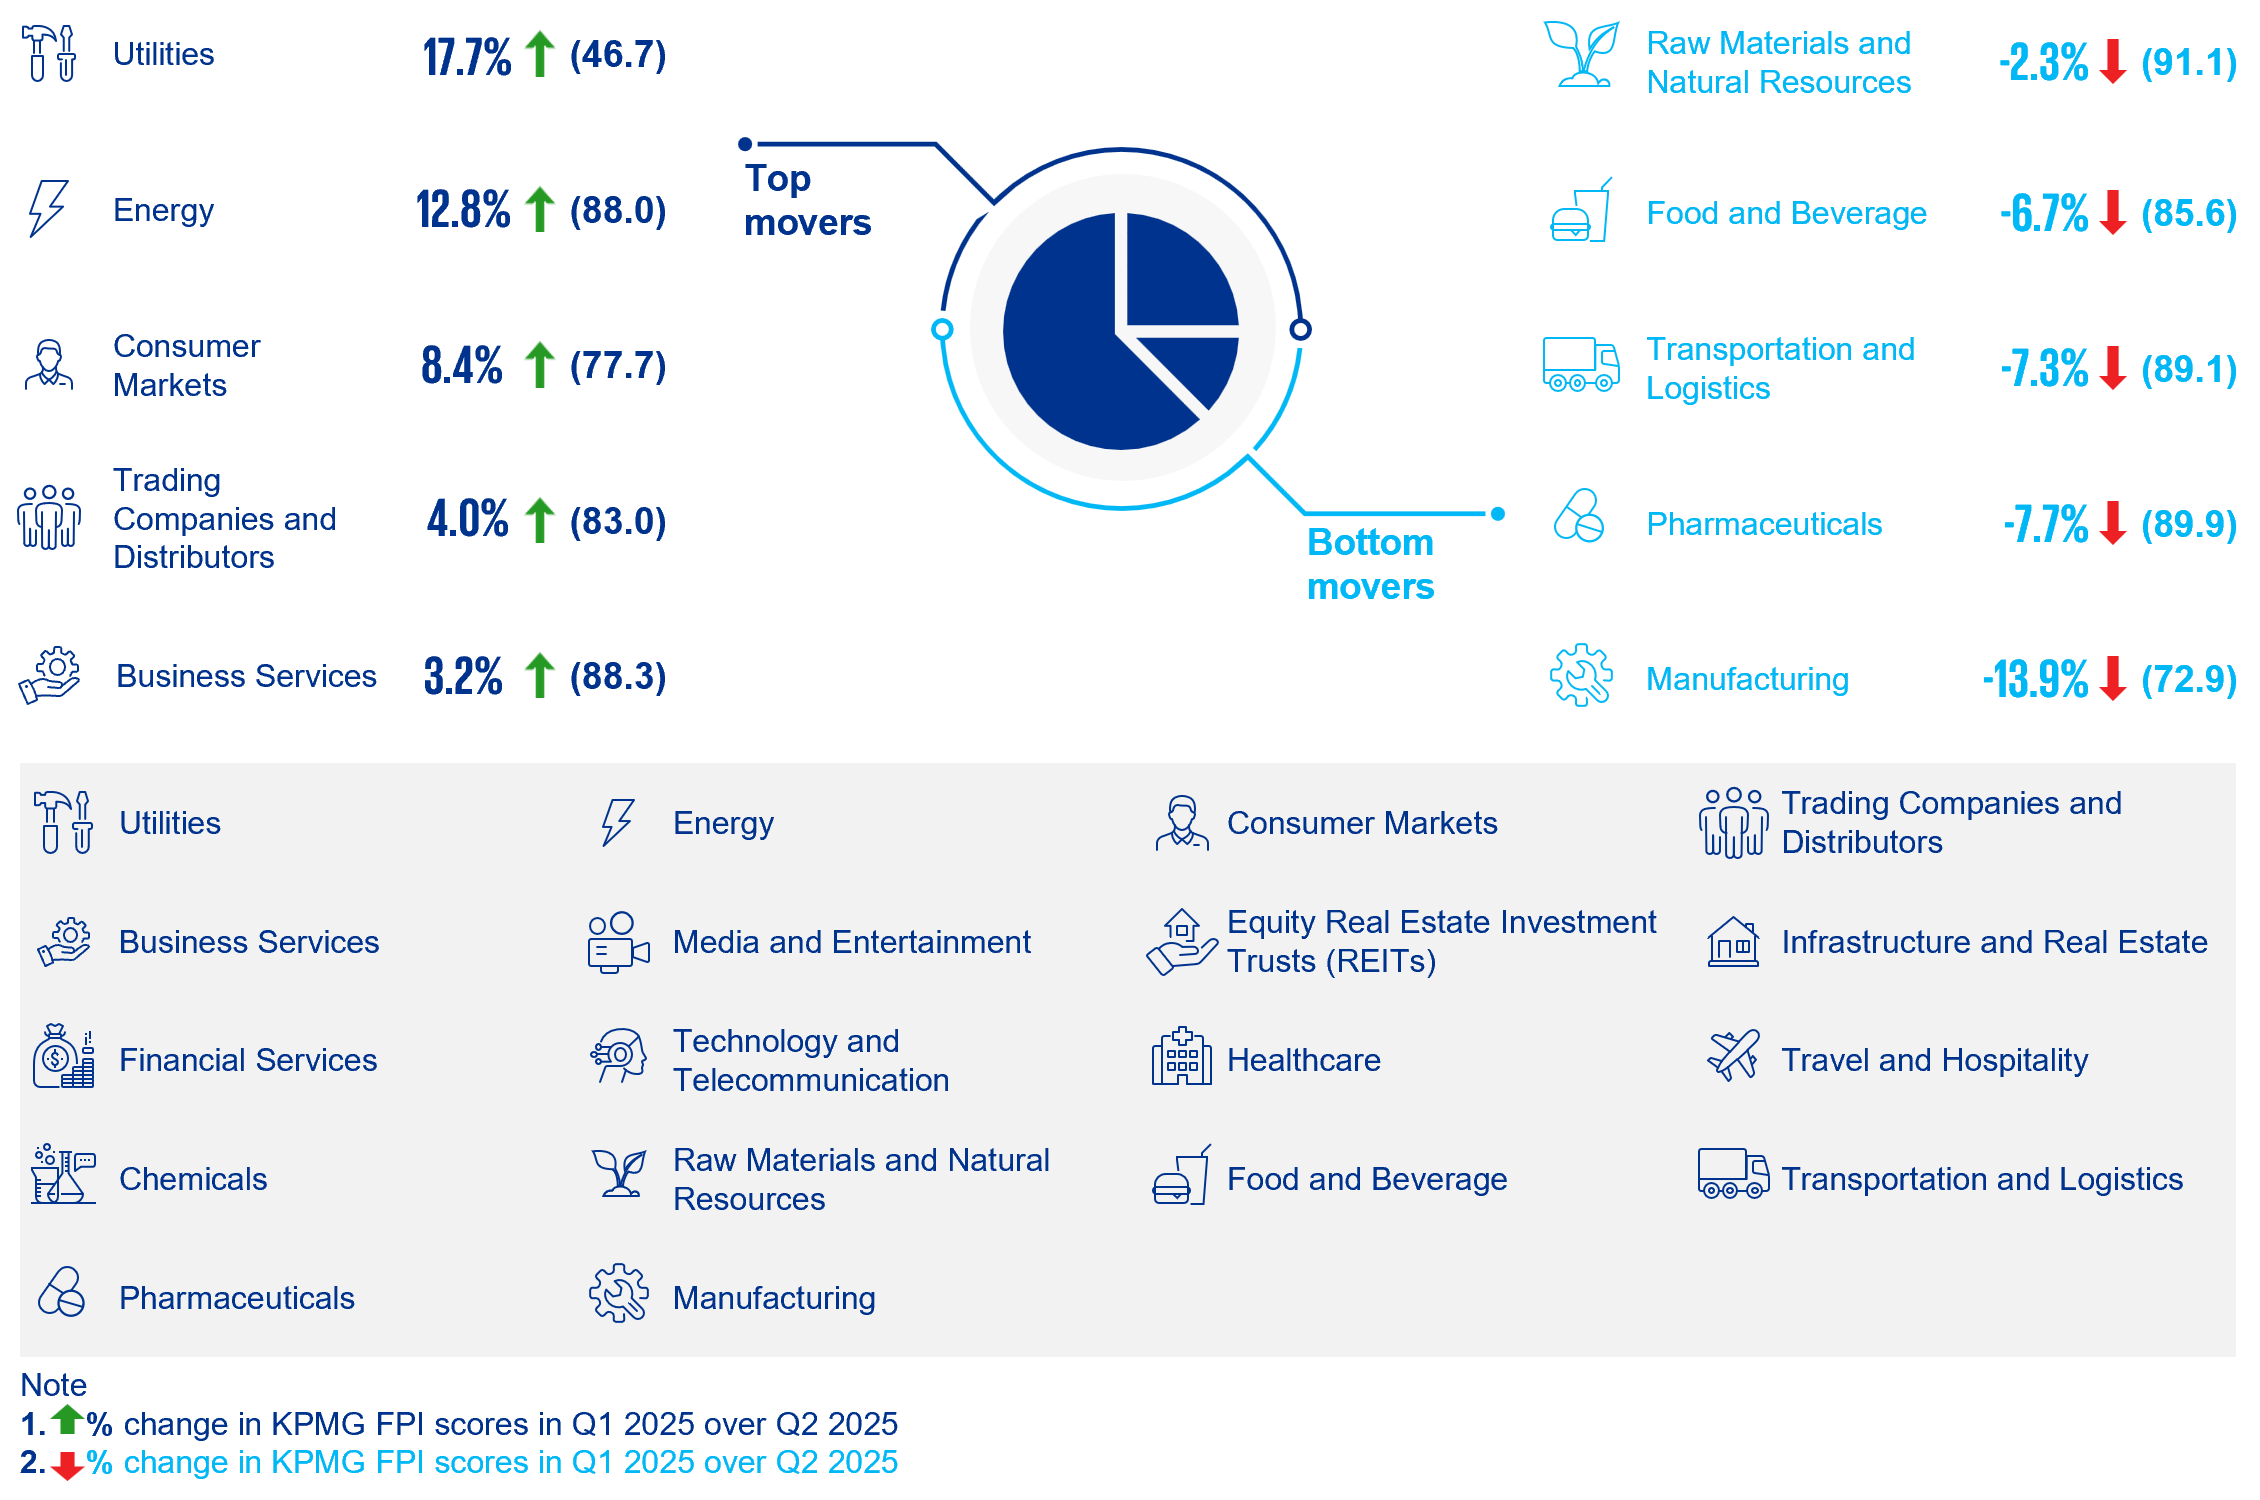
Sector movers
- Singapore's FPI score experienced a dip of 1.5 points, reaching 86.3 in Q2 2025. This adjustment reflects a broader trend, with 13 out of 18 sectors recording decreases in their individual FPI scores.
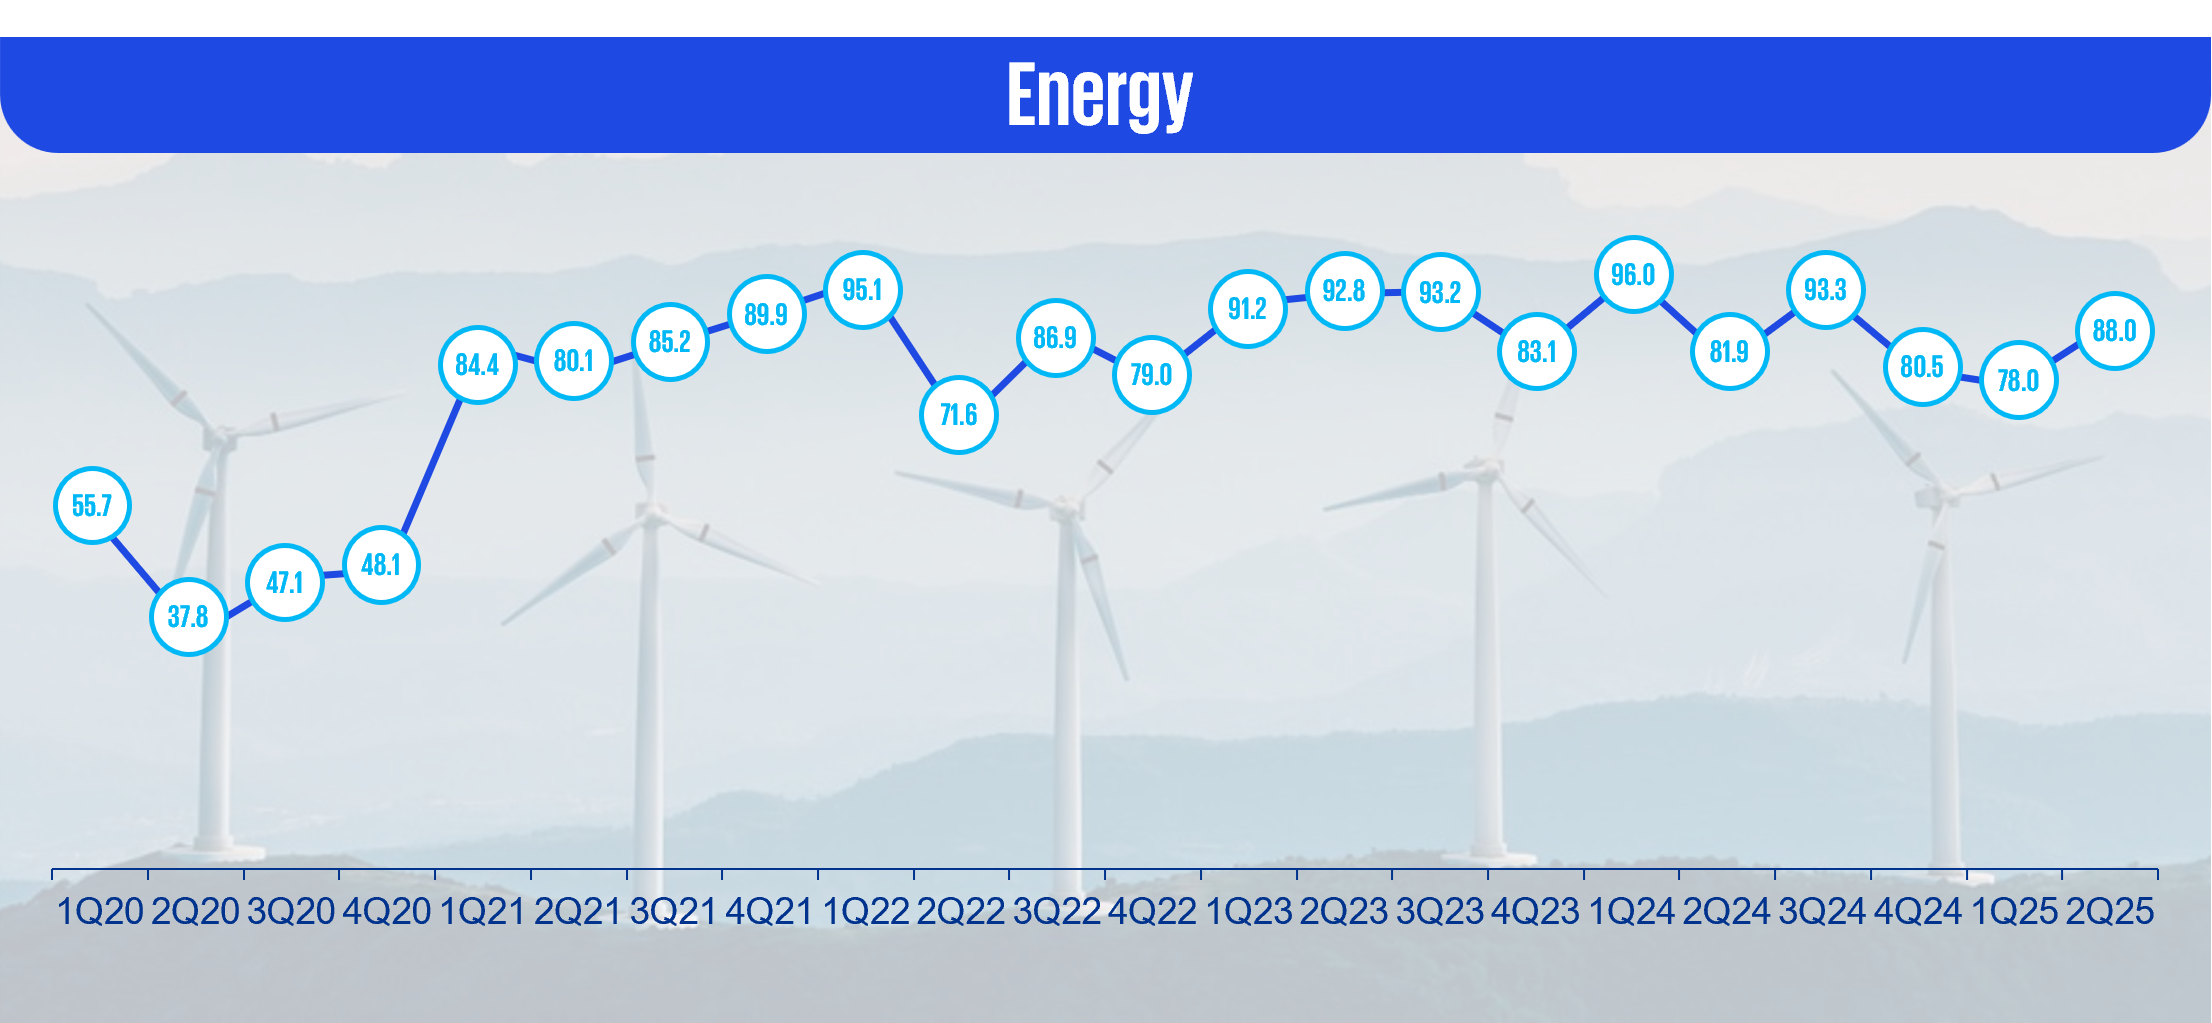
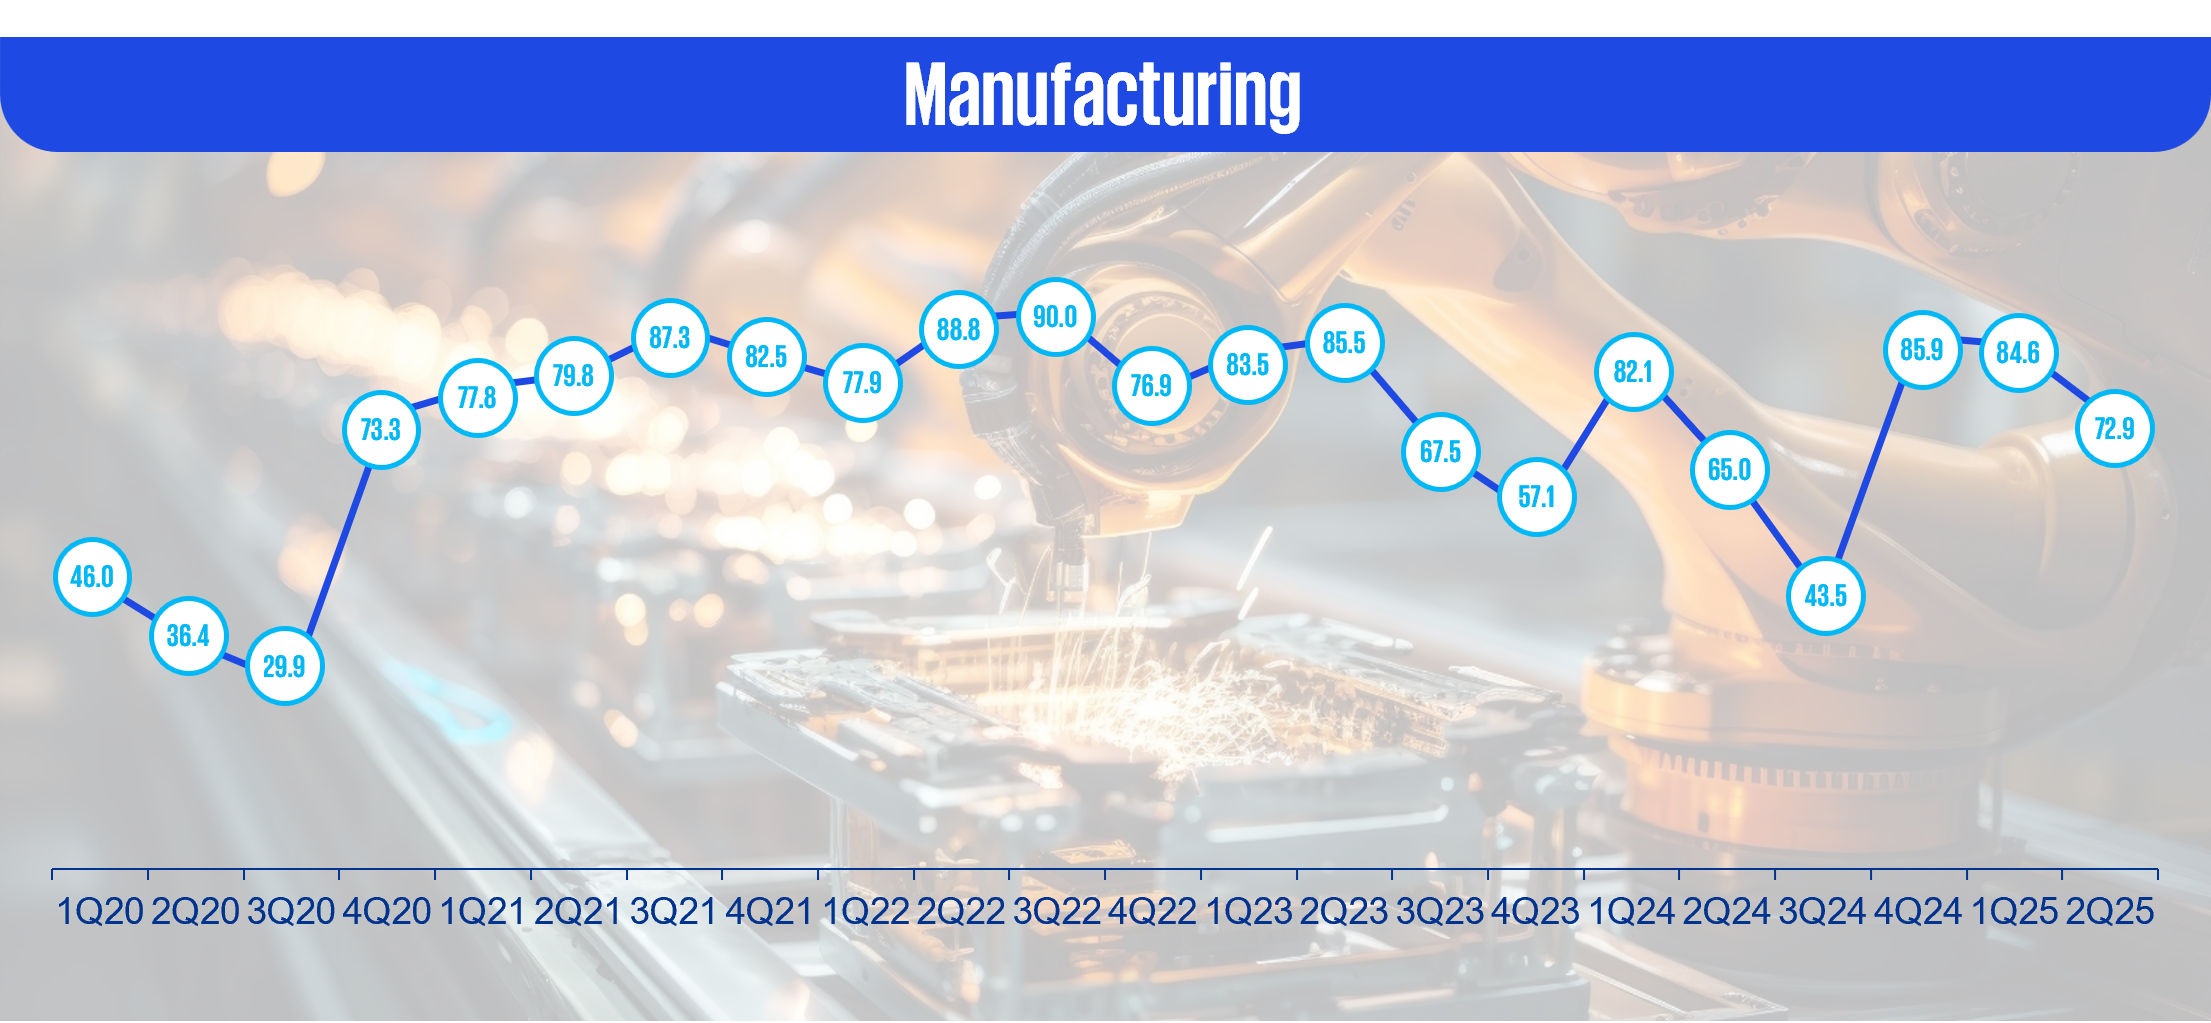
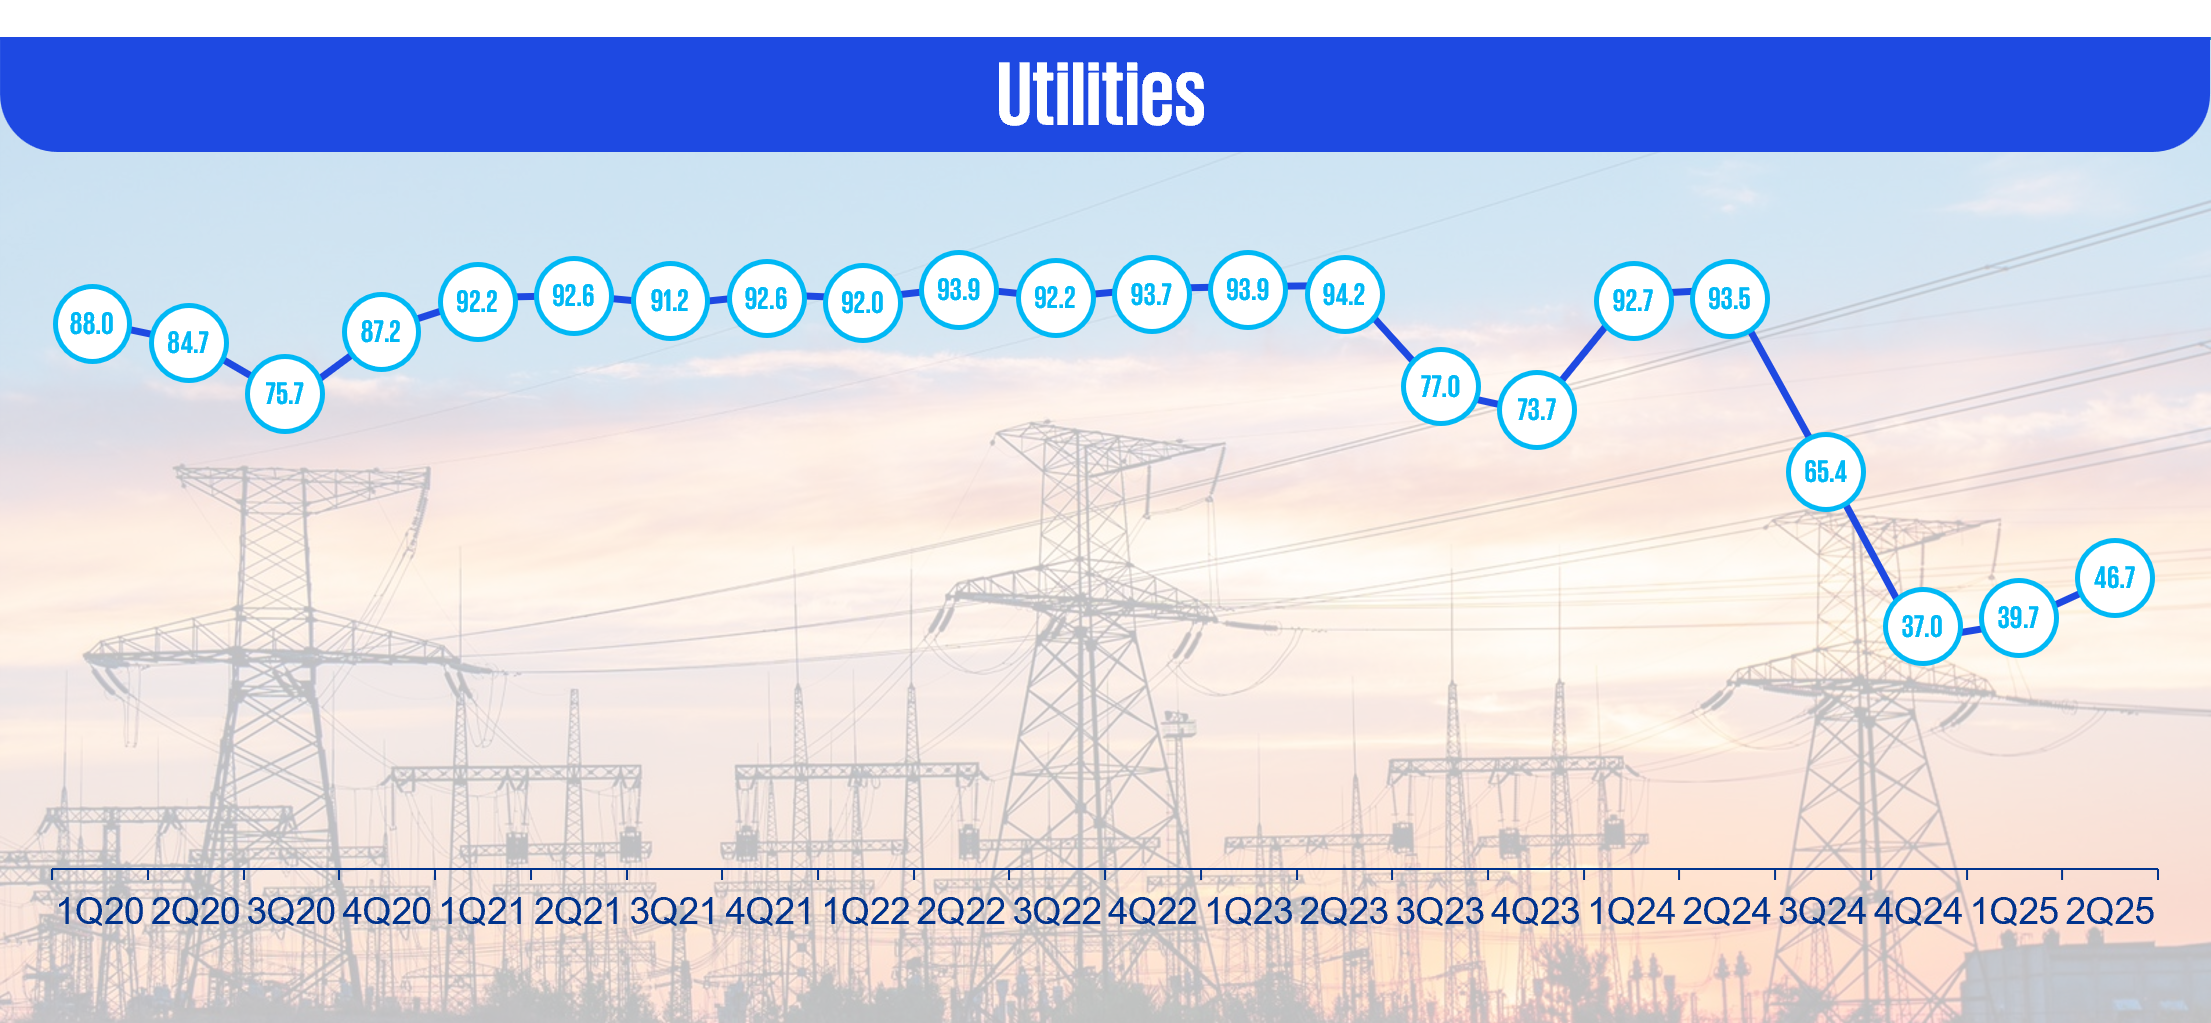
- Utilities led all sectors with a 17.7% surge in its FPI score, rising from 39.7 in 1Q25 to 46.7 followed by Energy with a 12.8% increase in FPI score, climbing from 78.0 to 88.0. However, the Manufacturing sector experienced the steepest decline, with FPI scores falling 13.9% from 84.6 to 72.9 majorly driven by Rising Uncertainty in Business Conditions. Business Sentiments for July 2025 – December 2025 | Singapore EDB
- The Utilities and Energy sectors are propelled by government-led initiatives for decarbonisation and modernisation of the grid. Furthermore, the government has increased the Future Energy Fund to S$10 billion to bolster infrastructure for hydrogen, nuclear, and clean energy technologies. Additionally, agreements have been established with Vietnam and Indonesia to facilitate renewable energy exports and collaborate on carbon capture efforts. Singapore Budget 2025: Government to reorganise for greater focus on nuclear energy, build new capabilities | Singapore EDB
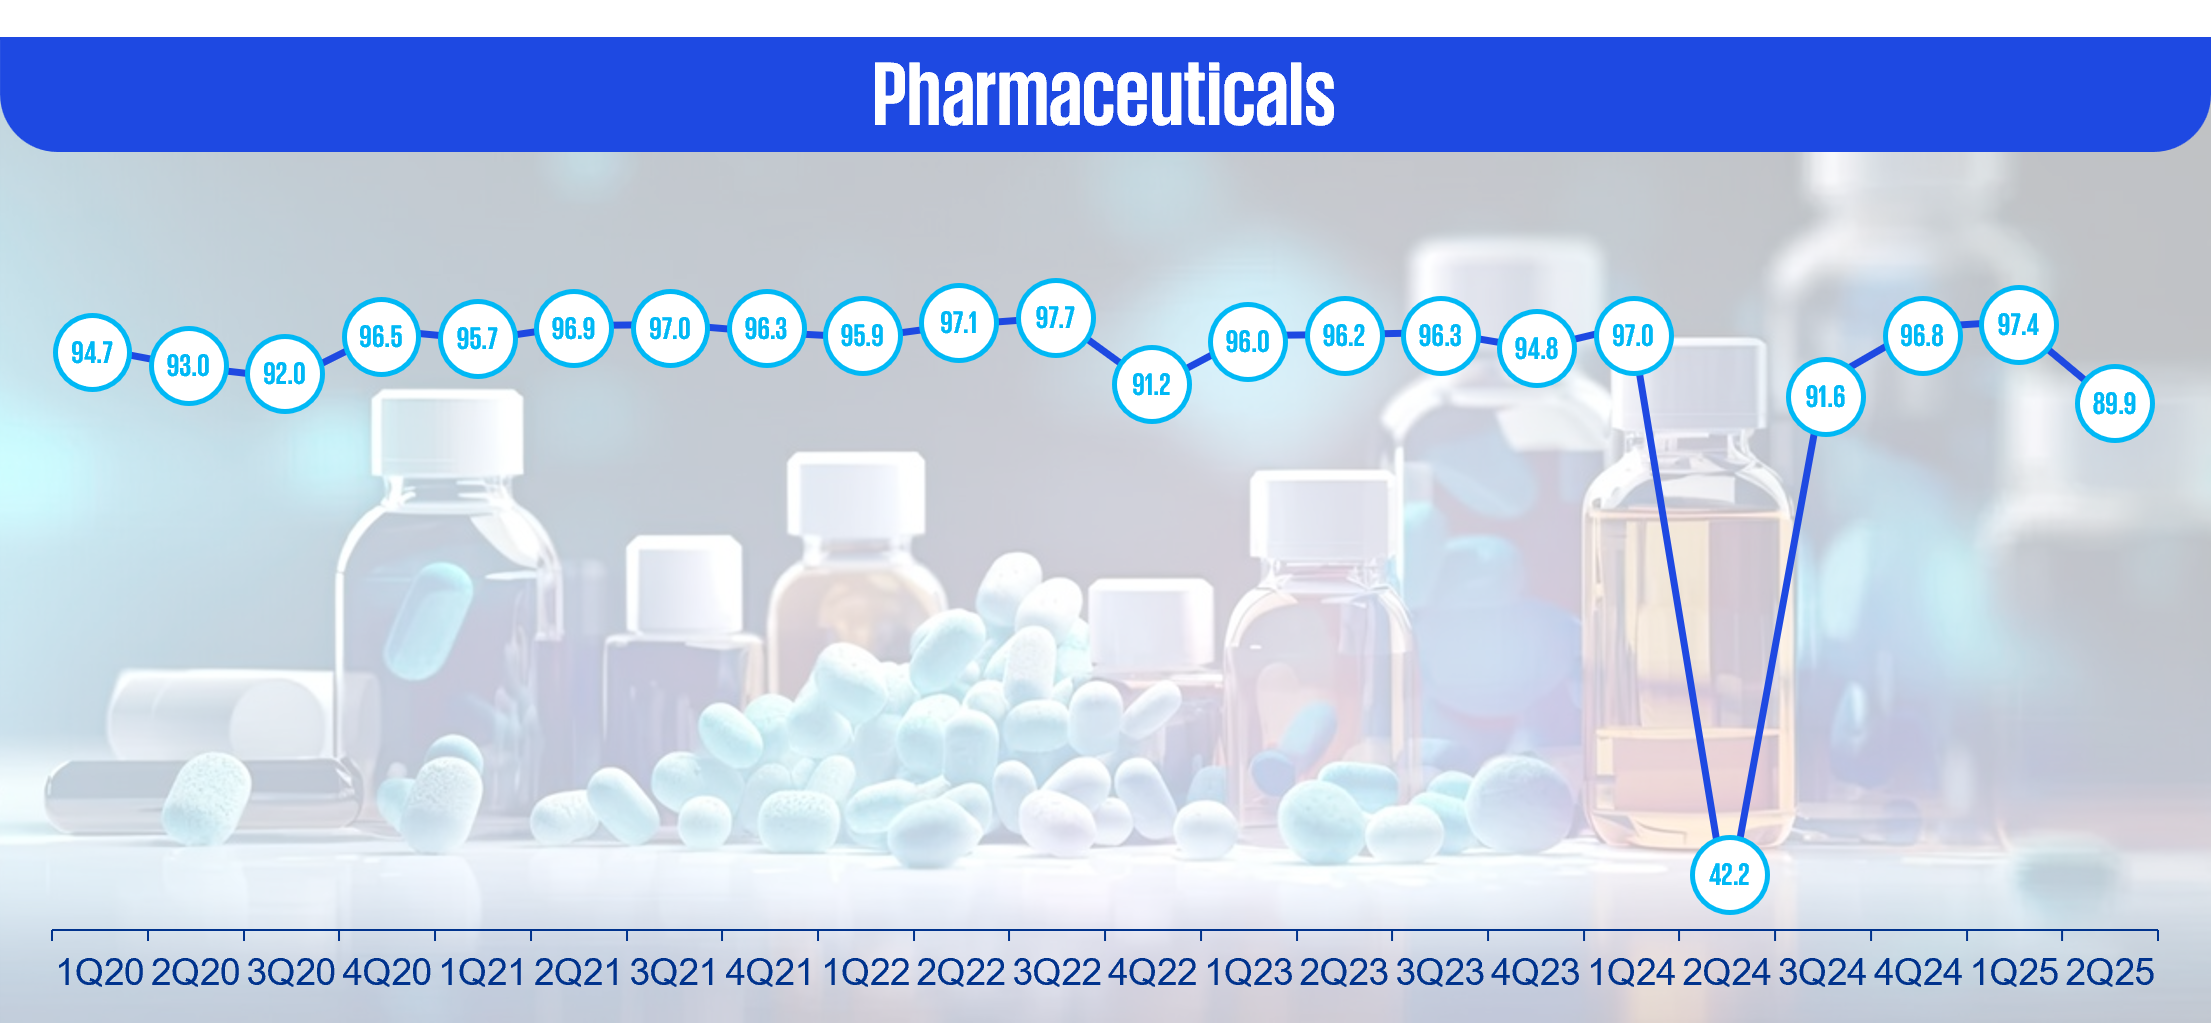
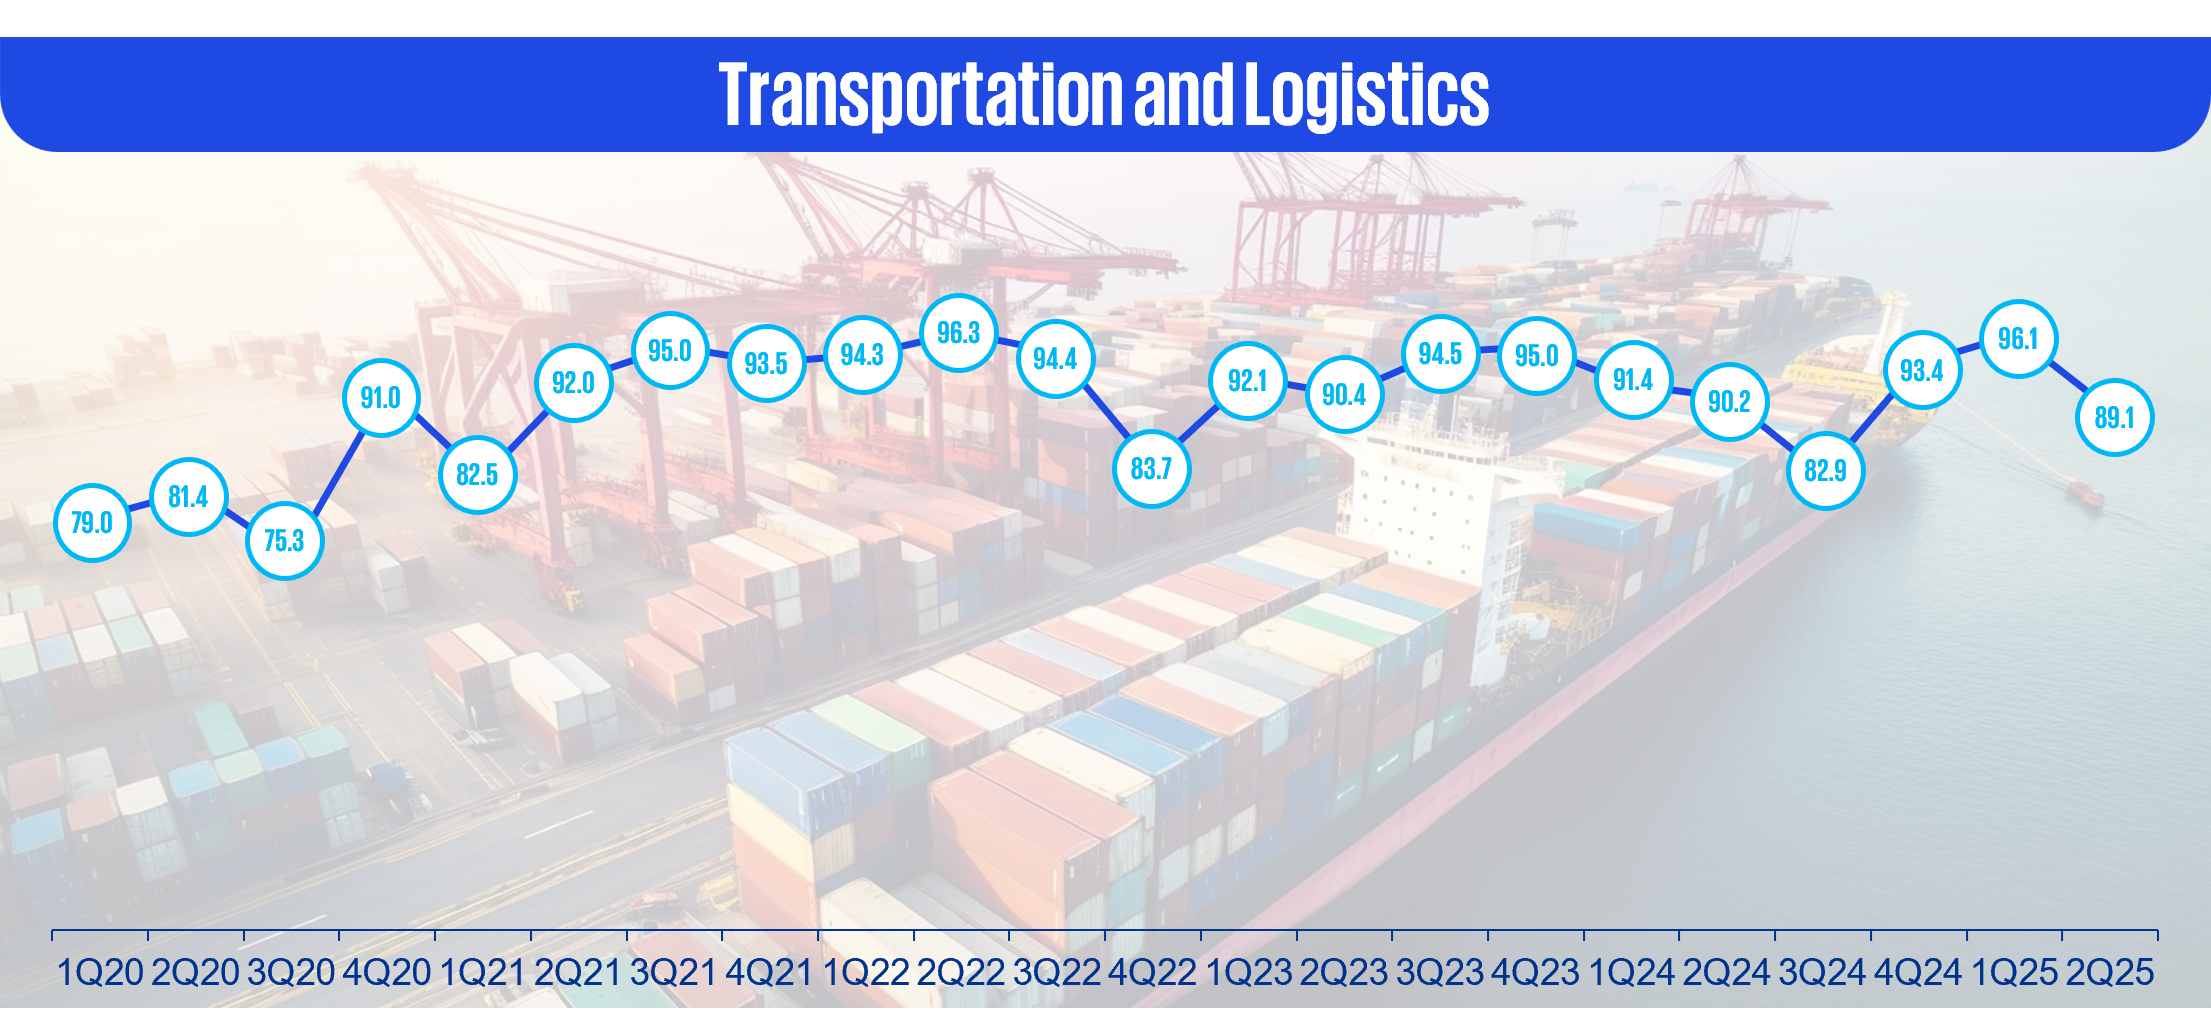
Sustainability updates from Singapore for businesses – a round-up from April to June 2025 | Singapore EDB - Pharmaceuticals and Transportation and Logistics also saw significant drops, with FPI scores declining 7.7% and 7.3% respectively. Pharmaceuticals faced regulatory delays and pricing pressures Biotech and Pharma Market Update: Q2 2025 in Review | INN, while logistics was impacted by Volatility in Sea and Air Freight Forto Blog | Q2 2025 logistics recap and Cautious Business Sentiment. Singapore’s Logistics Sector Remains Resilient and Attractive Amid Global Trade Uncertainty: CBRE Survey | CBRE Singapore
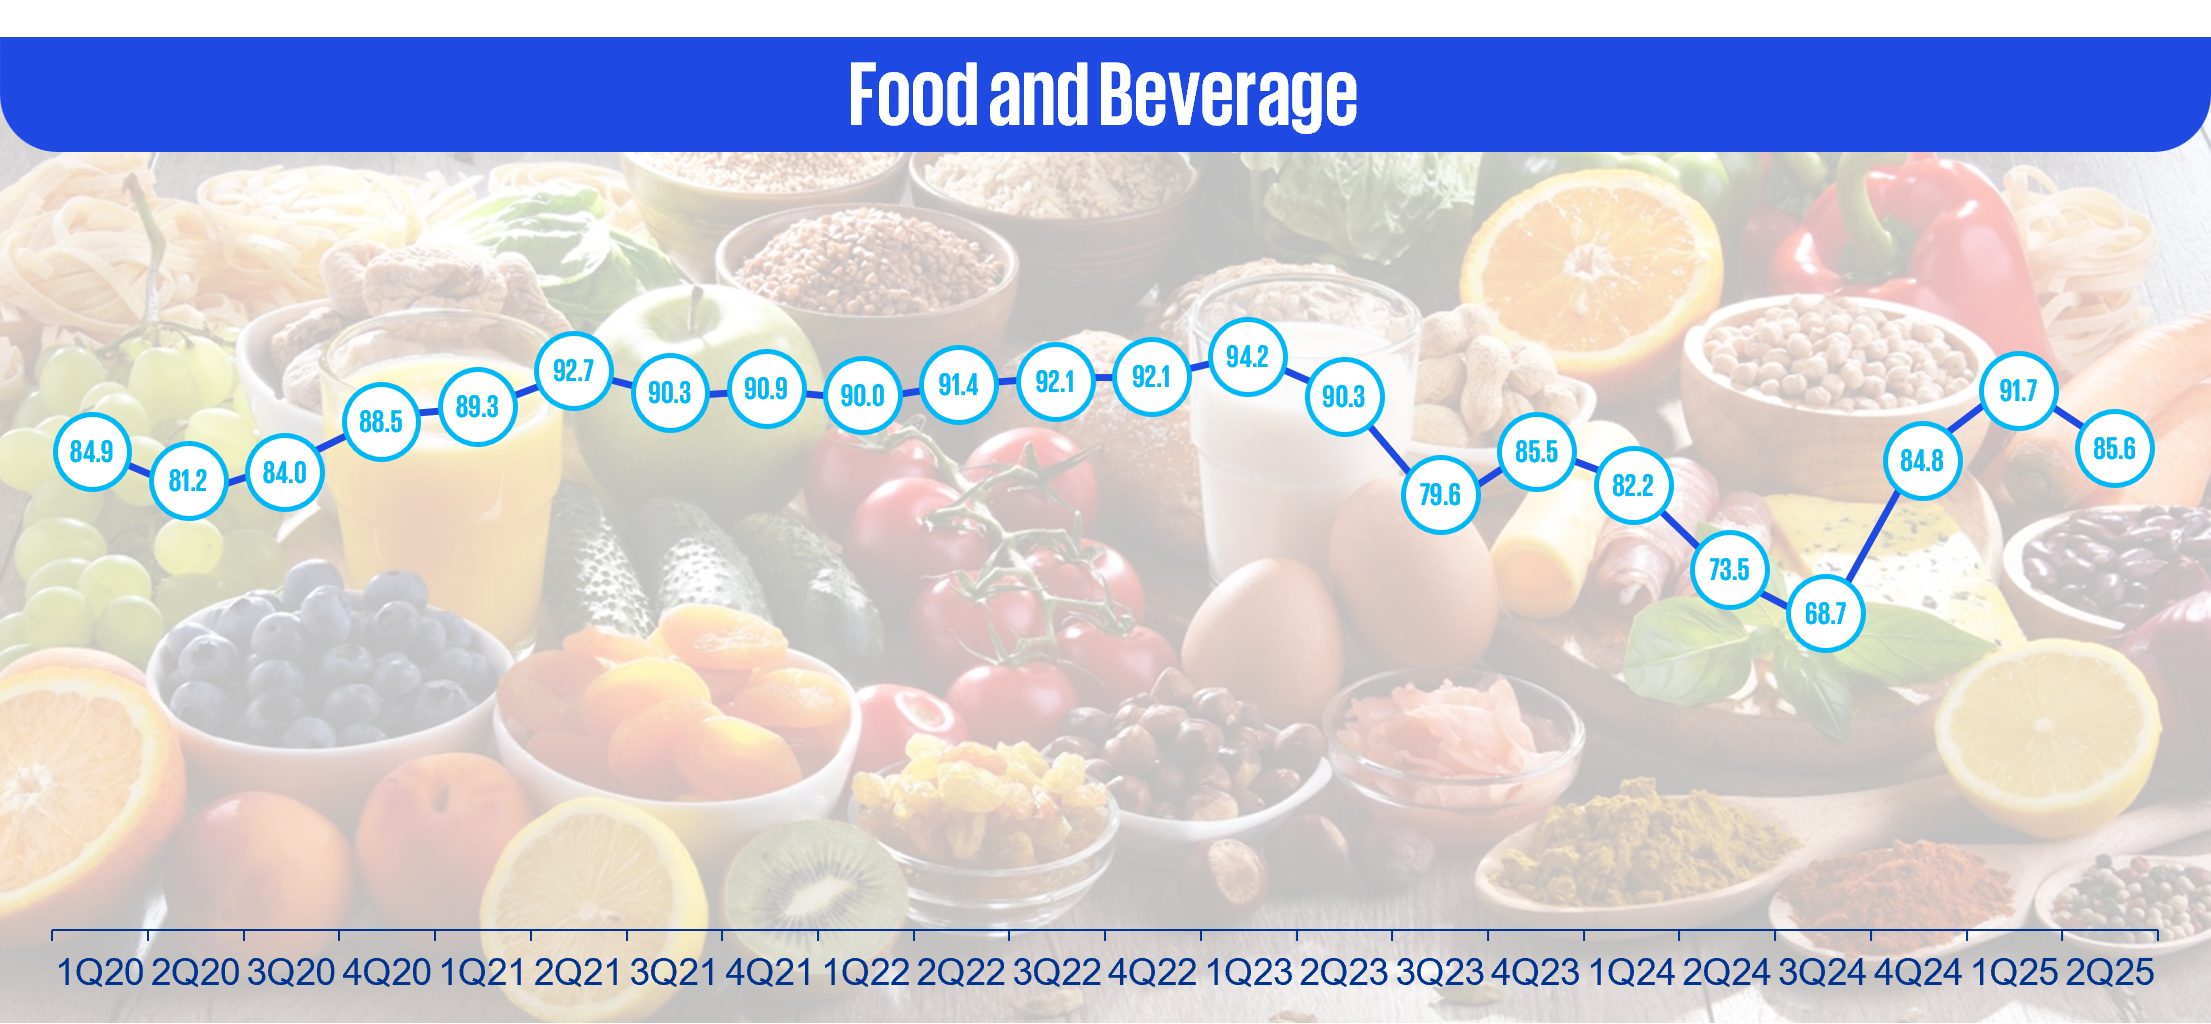
- Food and Beverage declined 6.7%, reflecting margin pressures from elevated commodity prices and shifting consumer preferences.
Sub-sector movers
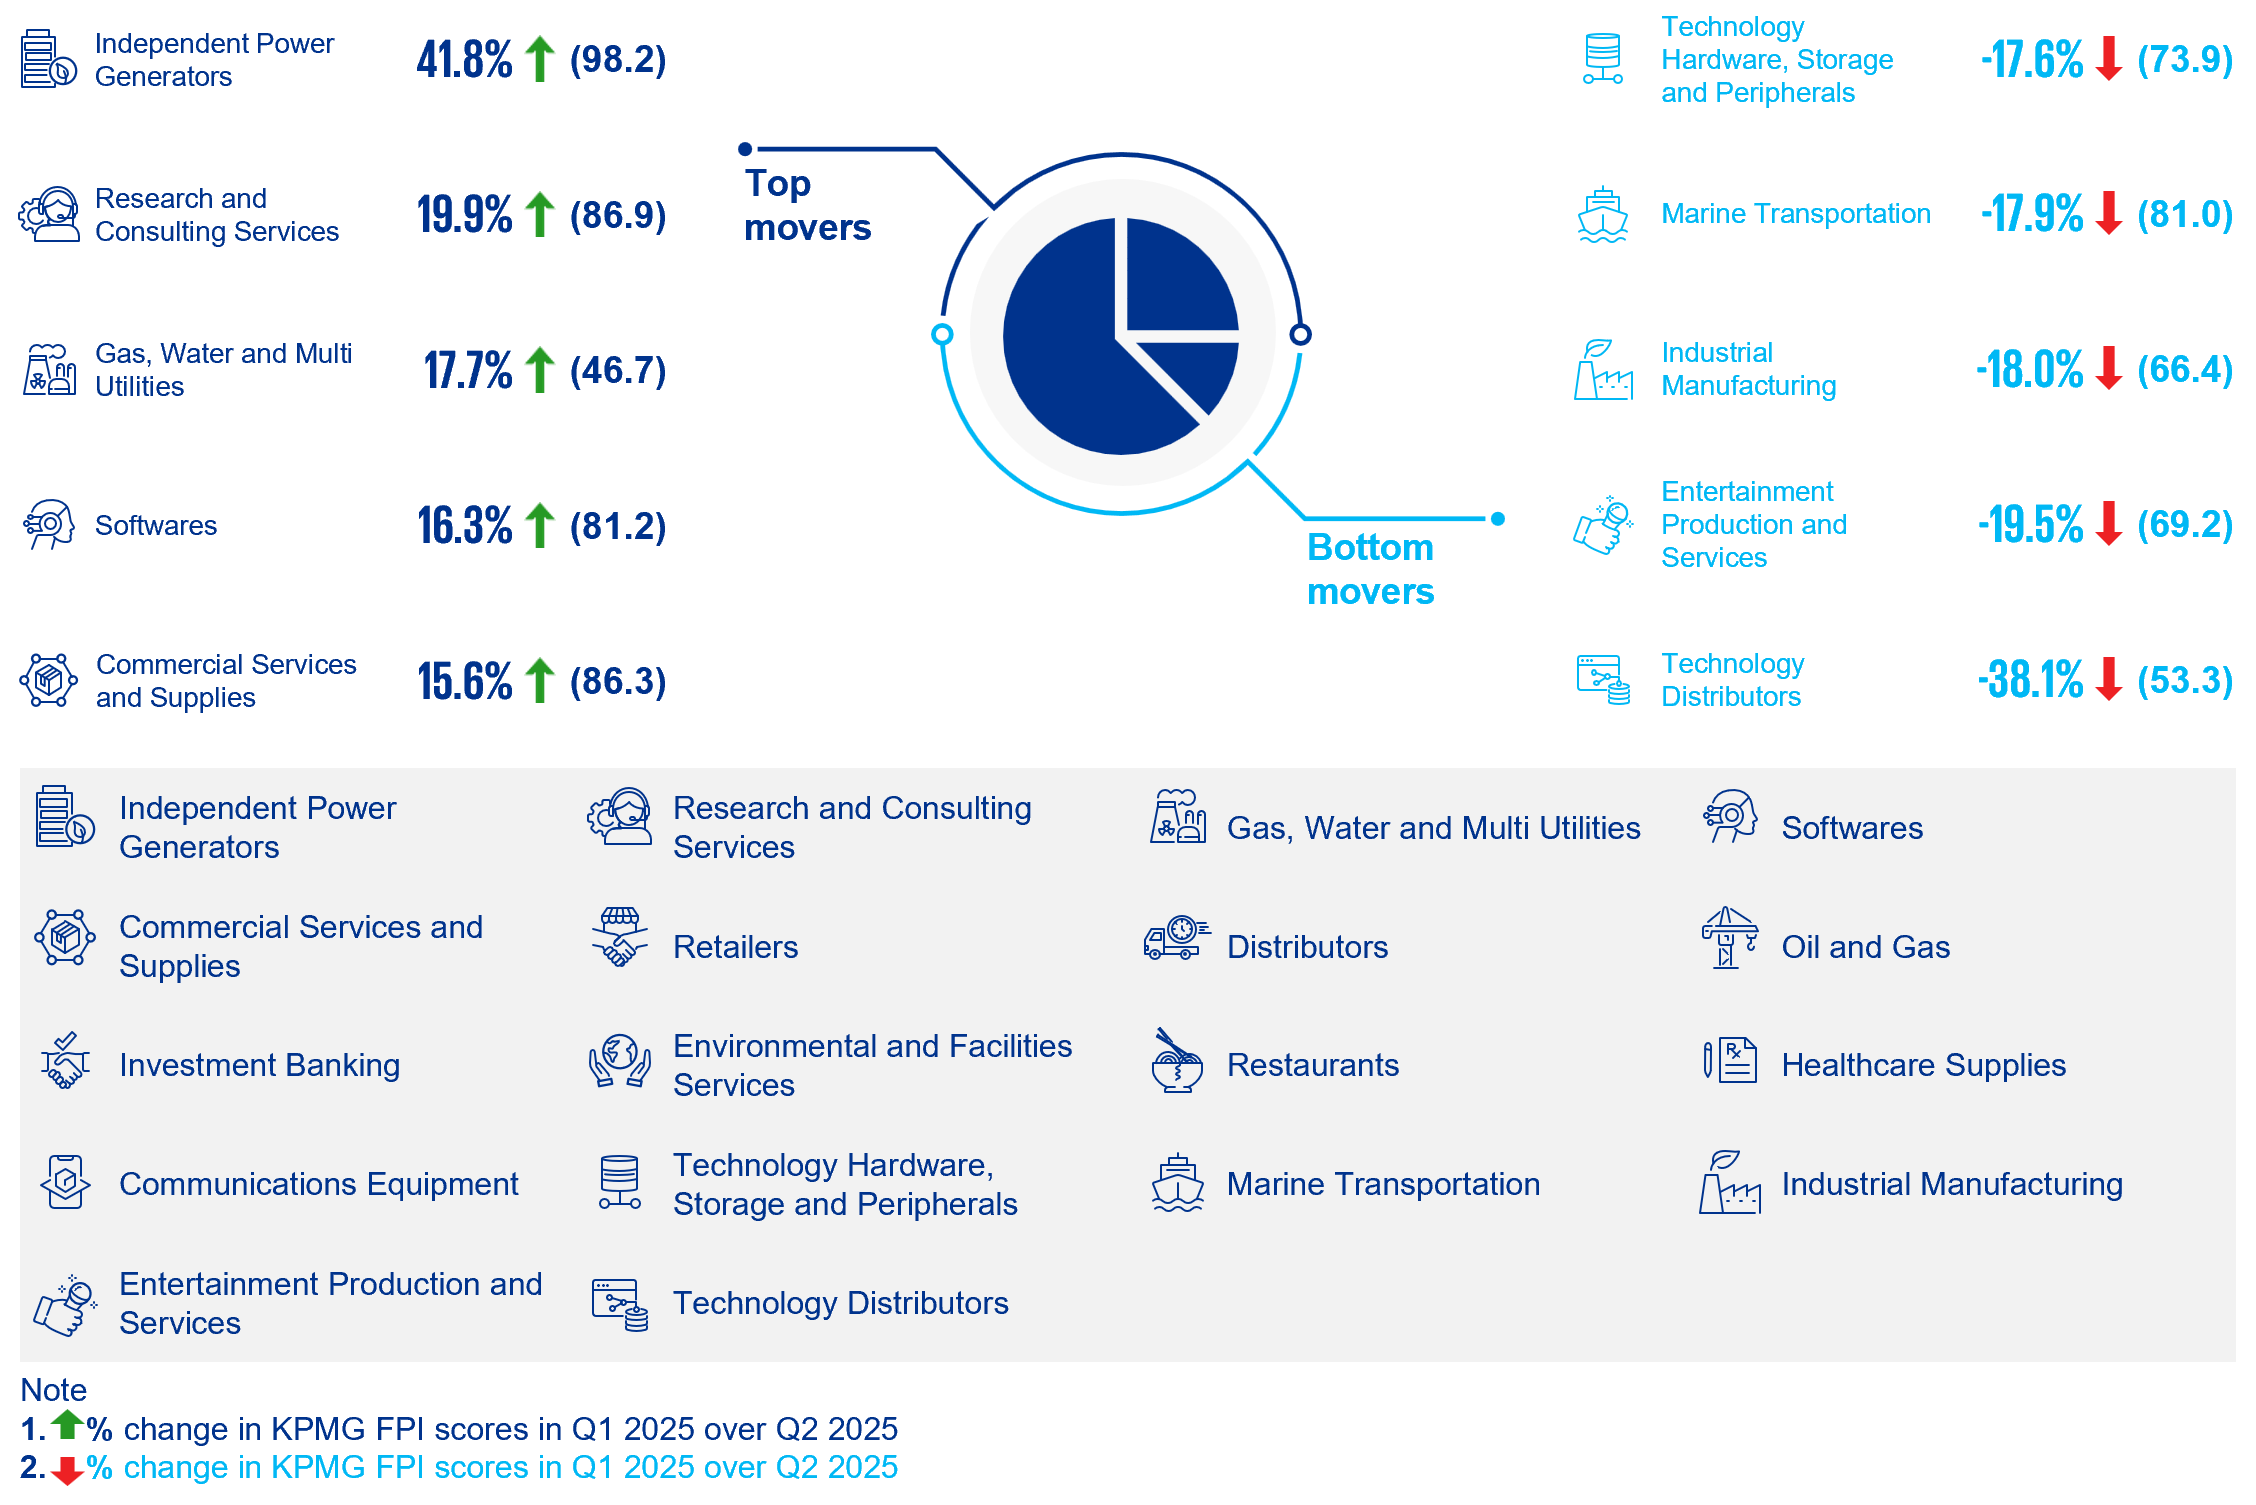
- During 1Q25 to 2Q25, among 46 sub-sectors, 16 experienced growth, 29 showed a negative trend, and 1 remained neutral. Notably, Technology Distributors sub sector faced the steepest decline to an FPI score of 53.3 (Dropped 38.1% from 86.1).
- Marine Transportation sub-sector declined by 17.9% to 81.0, driven by reduced sea cargo volumes as the gains in container throughput were offset by a sharp drop in oil-in-bulk cargo. (https://www.mti.gov.sg/-/media/MTI/Resources/Economic-Survey-of-Singapore/2025/Economic-Survey-of-Singapore-Second-Quarter-2025/BA_2Q25.pdf).
- Industrial Manufacturing sub-sector saw an 18% drop to 66.4, weighed down by tariff uncertainties, trade tensions, and muted output growth, reflecting cautious sector sentiment.(Business Sentiments for July 2025 – December 2025 | Singapore EDB, Industrial MarketBeat Report | SG | Cushman & Wakefield).
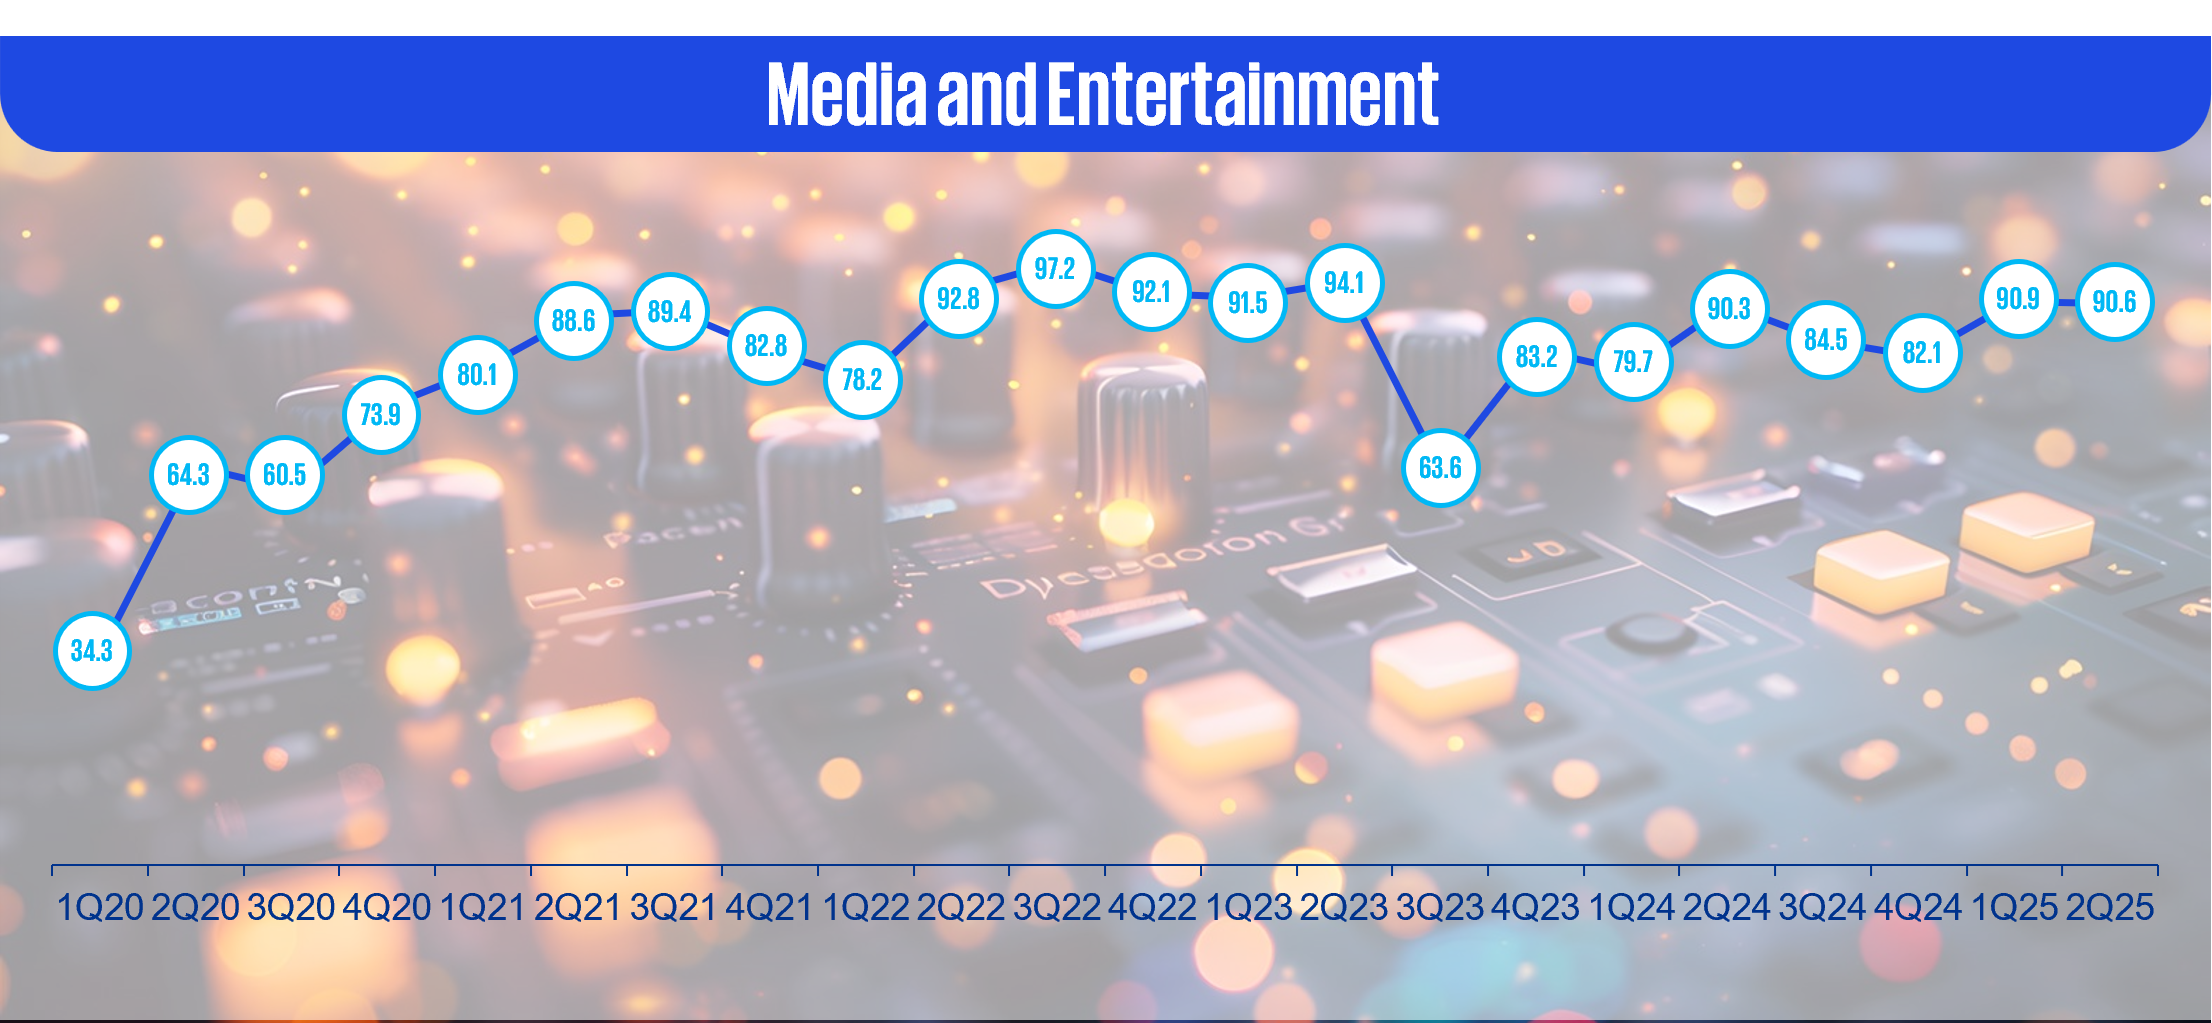
- Entertainment Production and Services sub-sector declined 19.5% to 69.2, reflecting continued pressure from the shift away from traditional media toward digital, on-demand content formats. ( Media - Singapore | Statista Market Forecast).
- Technology Distributors and Hardware sub-sectors declined by 38.1% and 17.6%, with FPI scores dropping to 53.3 and 73.9, respectively. The drop reflects demand normalisation following front-loading—where firms accelerated purchases ahead of anticipated U.S. tariff hikes in Q1 2025. (Singapore Sidesteps Recession with 4.3% growth in Q2 2025 but warns of ‘significant uncertainty’).
From March 2025 to June 2025
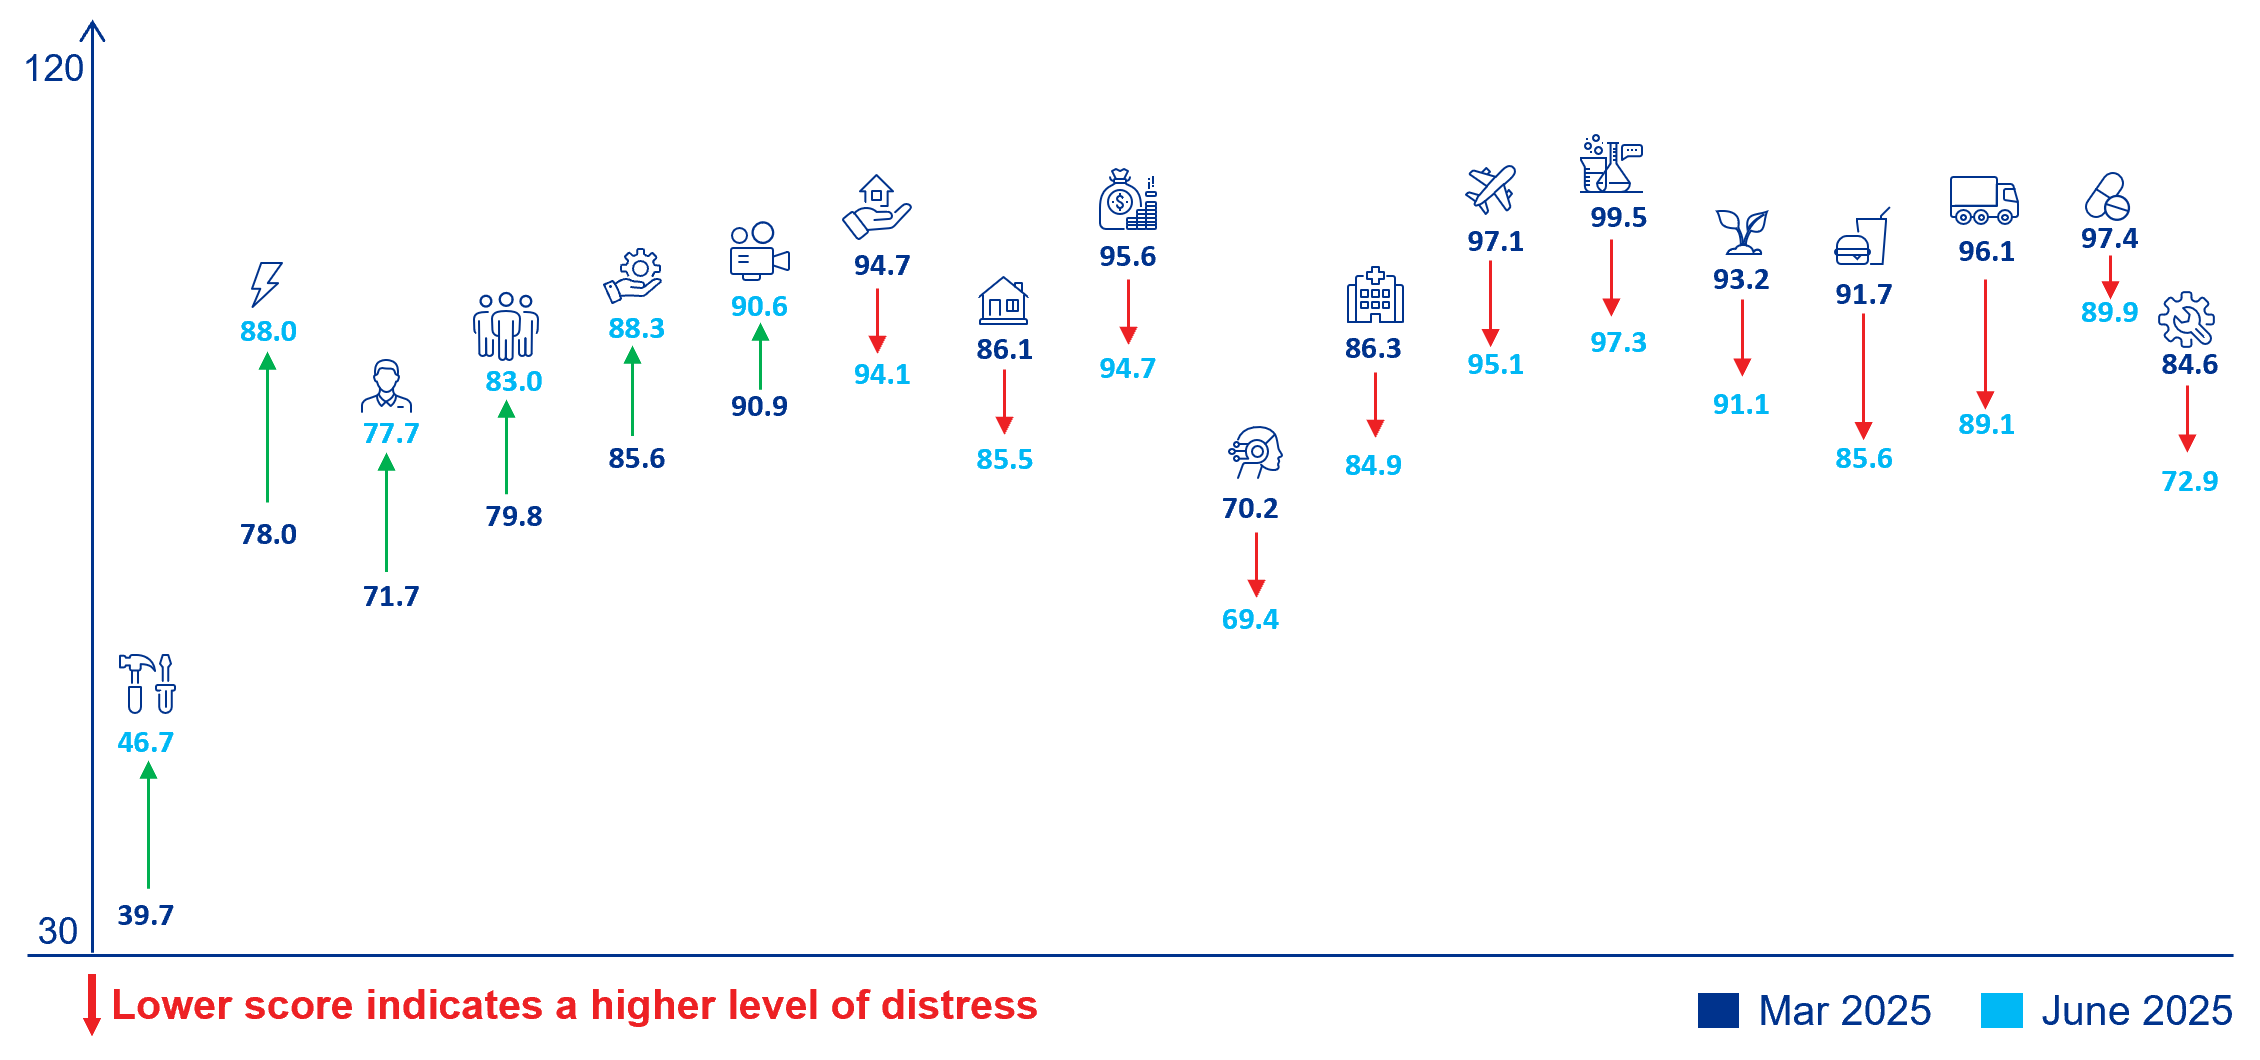
Strongest and weakest sector outperformers
From March 2025 to June 2025
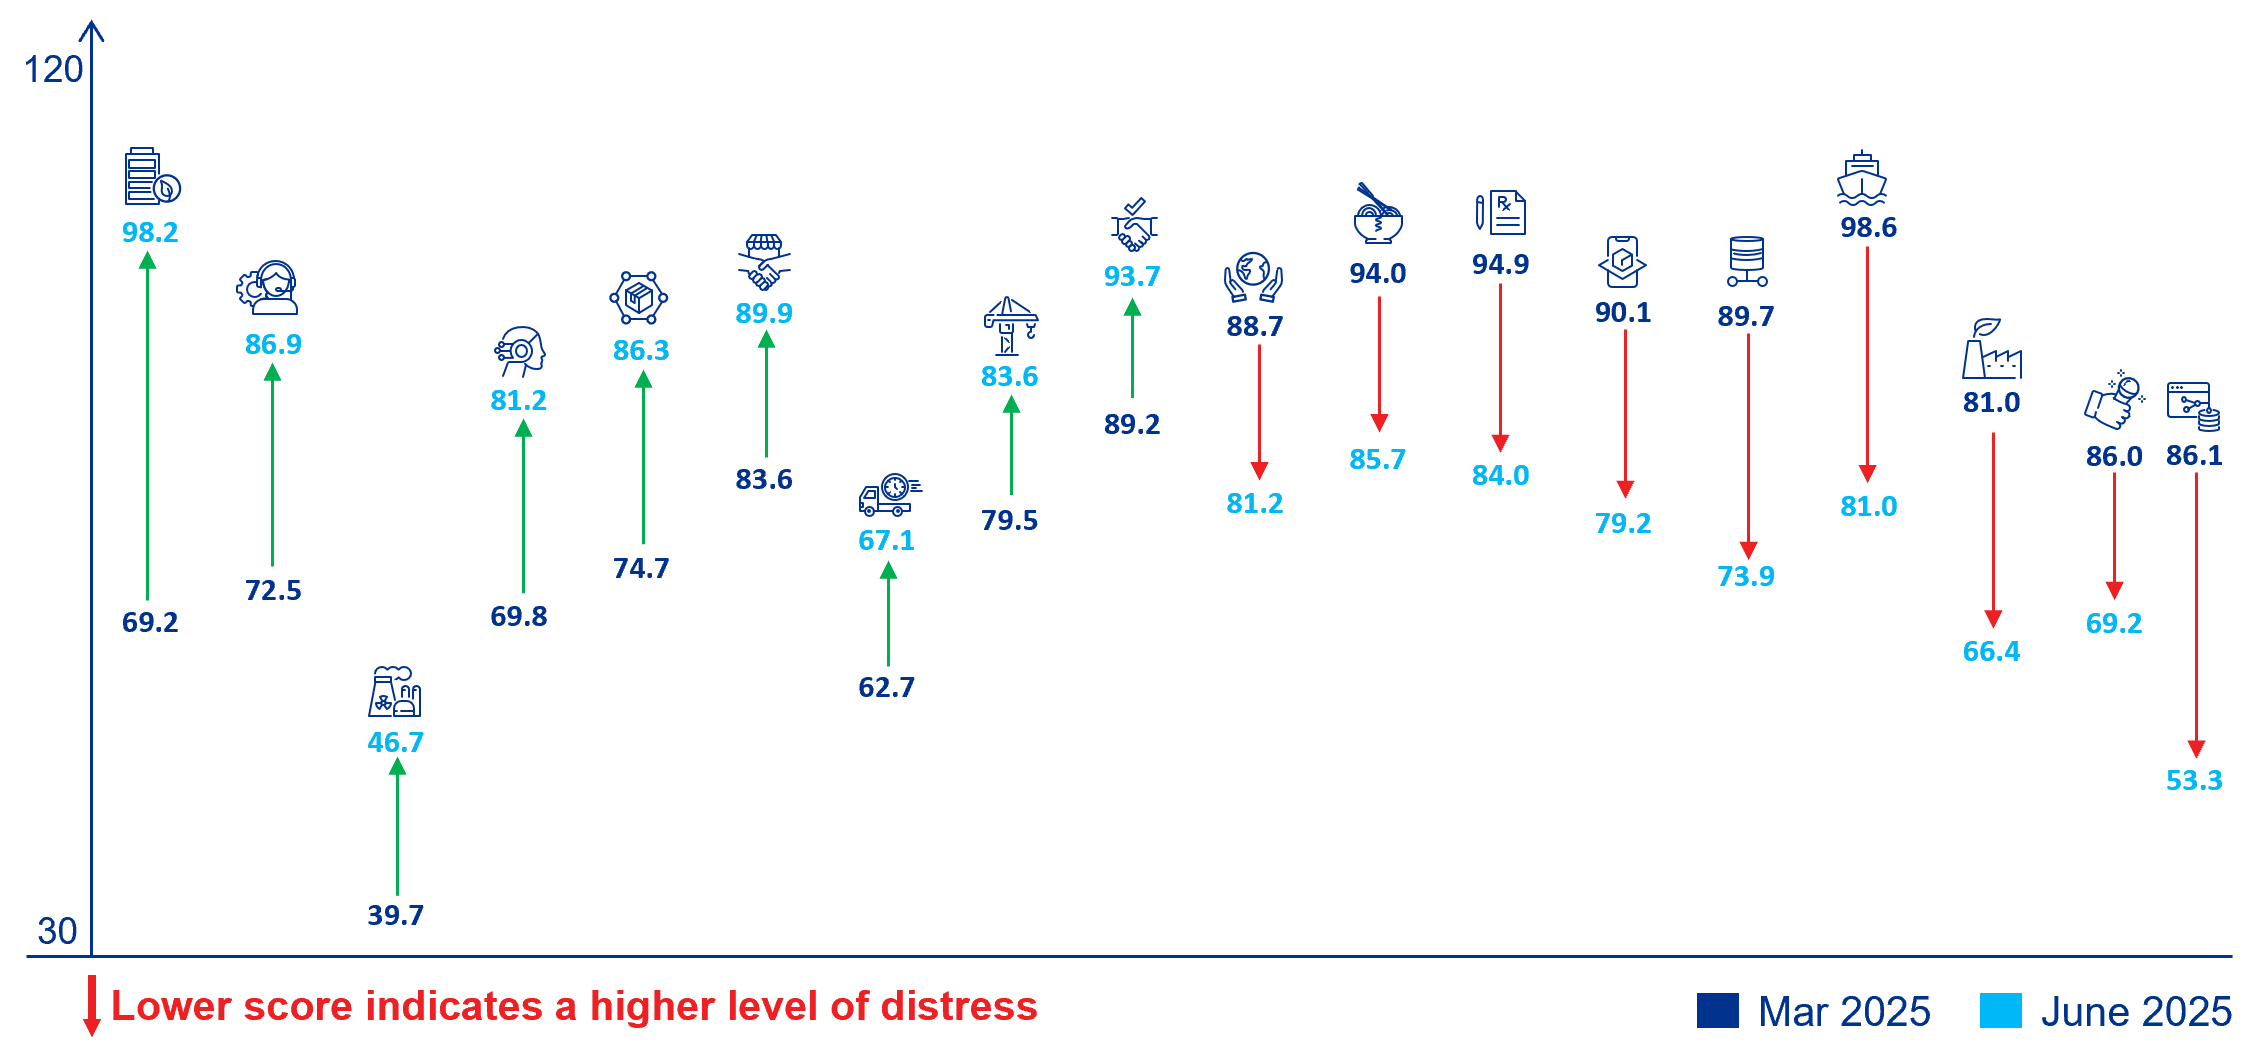
Strongest and weakest sub-sector outperformers
Singapore economy and landscape
- Singapore’s FPI score experienced a slight decline, easing from 87.8 in 1Q25 to 86.3 in 2Q25. During the same period, the economy grew by 4.3% year-on-year. GDP rose 1.4% quarter-on-quarter, rebounding from a 0.5% contraction in Q1. (Singapore GDP Surges to 4.3% in Q2 2025, Beating Expectations)
- Despite a marginal decline in its FPI score, placing it in the bottom quartile among Asian economies, Singapore continues to outperform several regional peers, including Thailand, Bangladesh, Malaysia, and Hong Kong SAR.
- Singapore continues to pursue strategic neutrality amid US-China tensions, maintaining balanced ties with both nations while advancing its role as Southeast Asia’s carbon trading hub and expanding its network of free-trade agreements (FTAs). (EIU database)
- Private sector economists have cut Singapore’s 2025 growth forecast from 2.6% to 1.7%, citing risks from US tariffs that could impact the country’s export-driven economy, according to the MAS survey. (Economists cut Singapore’s 2025 growth forecast to 1.7% on geopolitical and trade tensions | The Straits Times)
- Consumer price inflation is anticipated to average 0.5% in 2025, with core inflation at a similar level, supported by falling oil prices, the sustained strength of the Singapore dollar and subdued external cost pressures as global demand weakens. (EIU database)
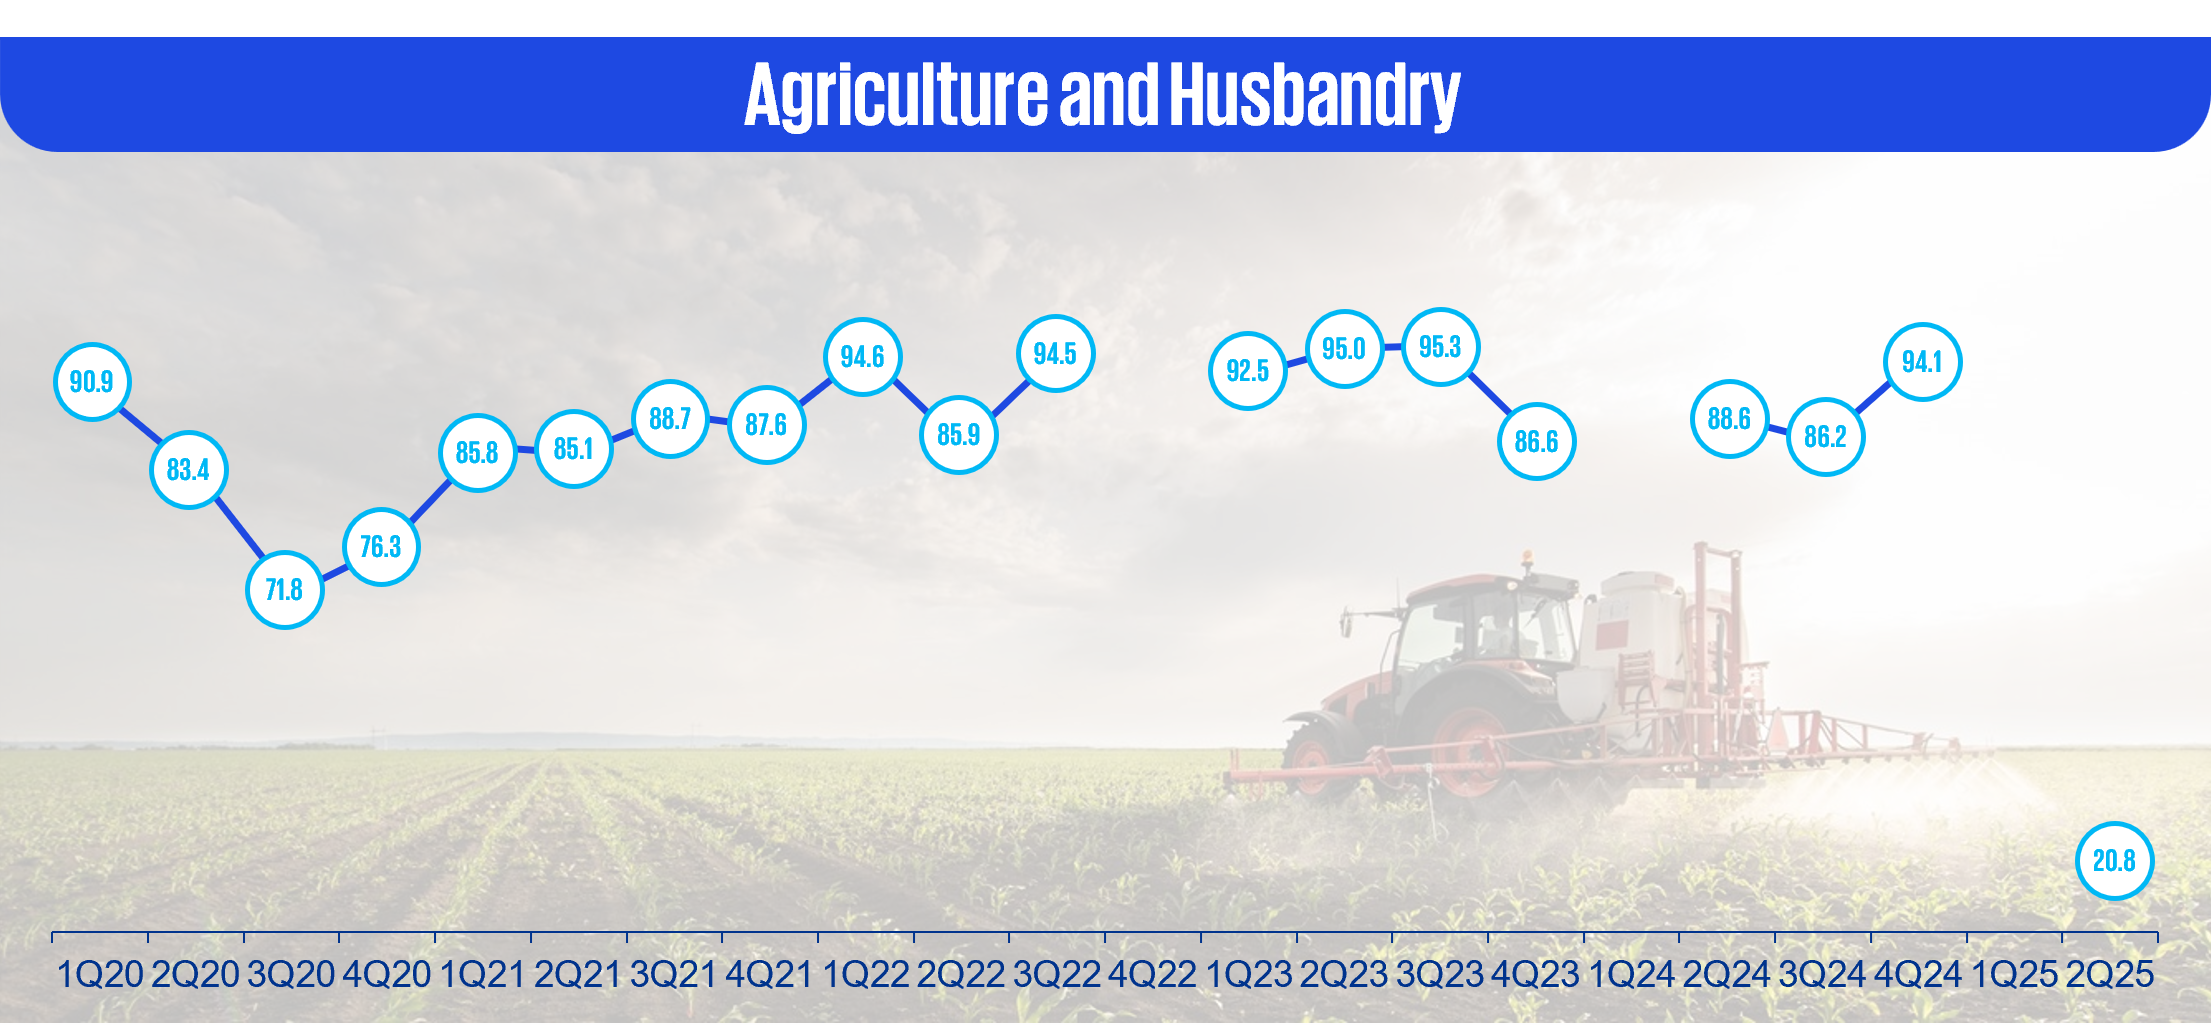
- Agriculture and Husbandry
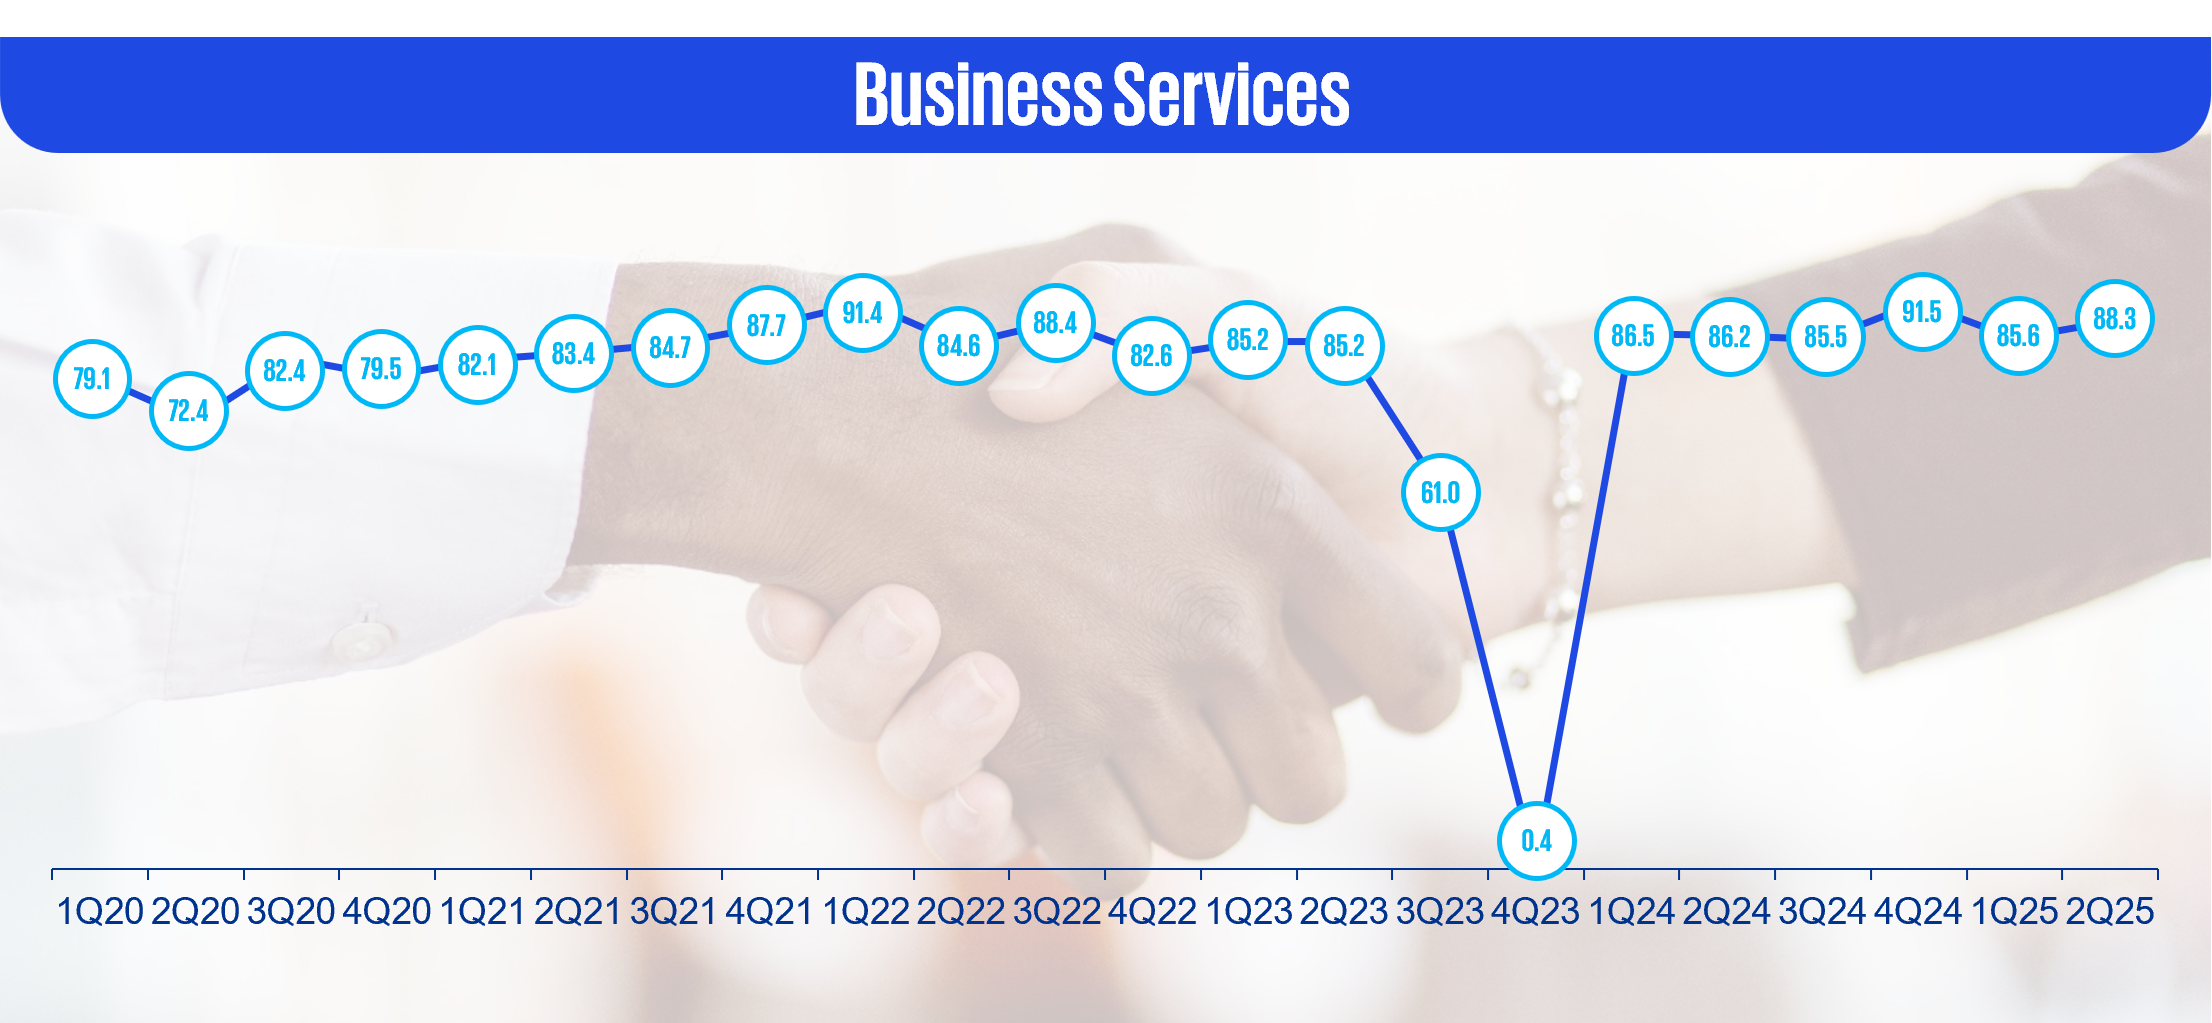
- Business Services
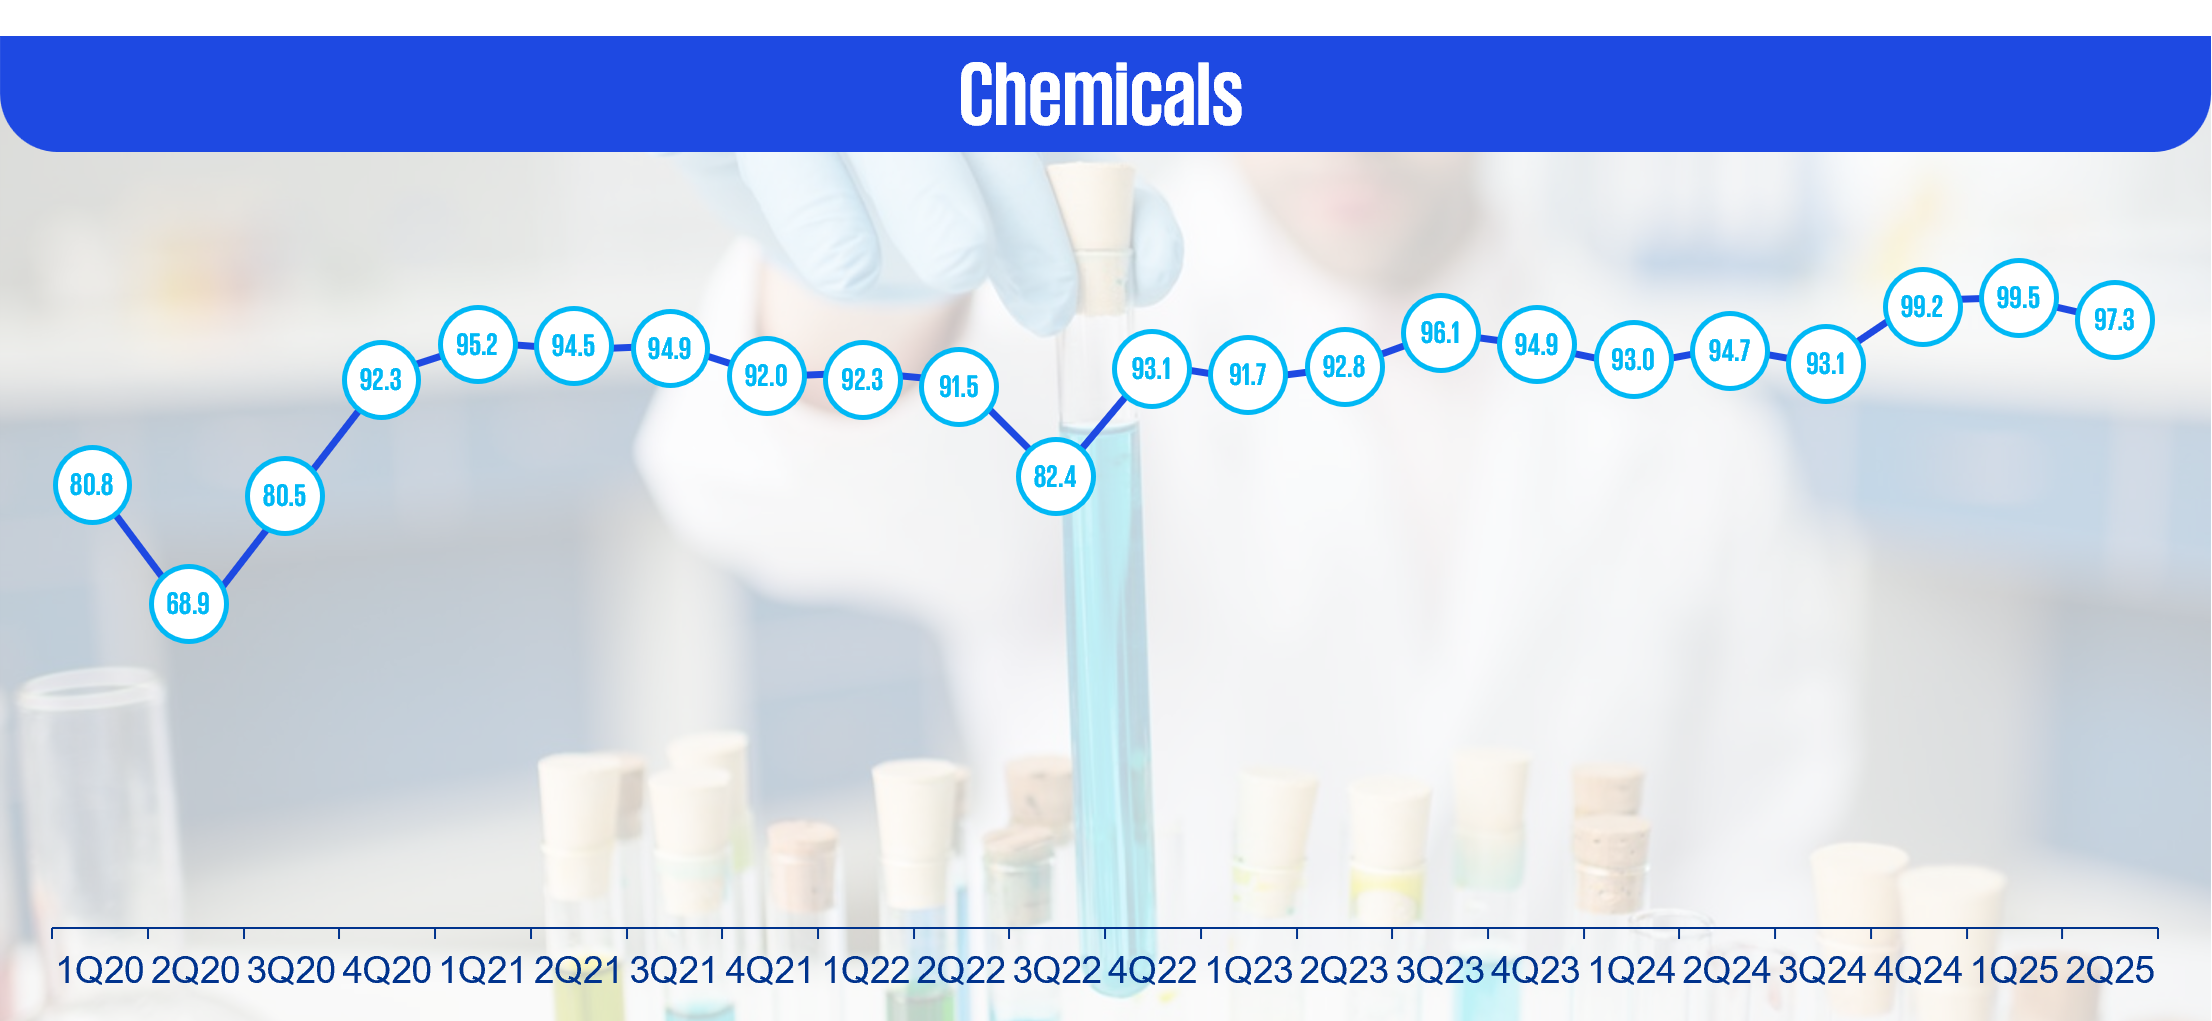
- Chemicals
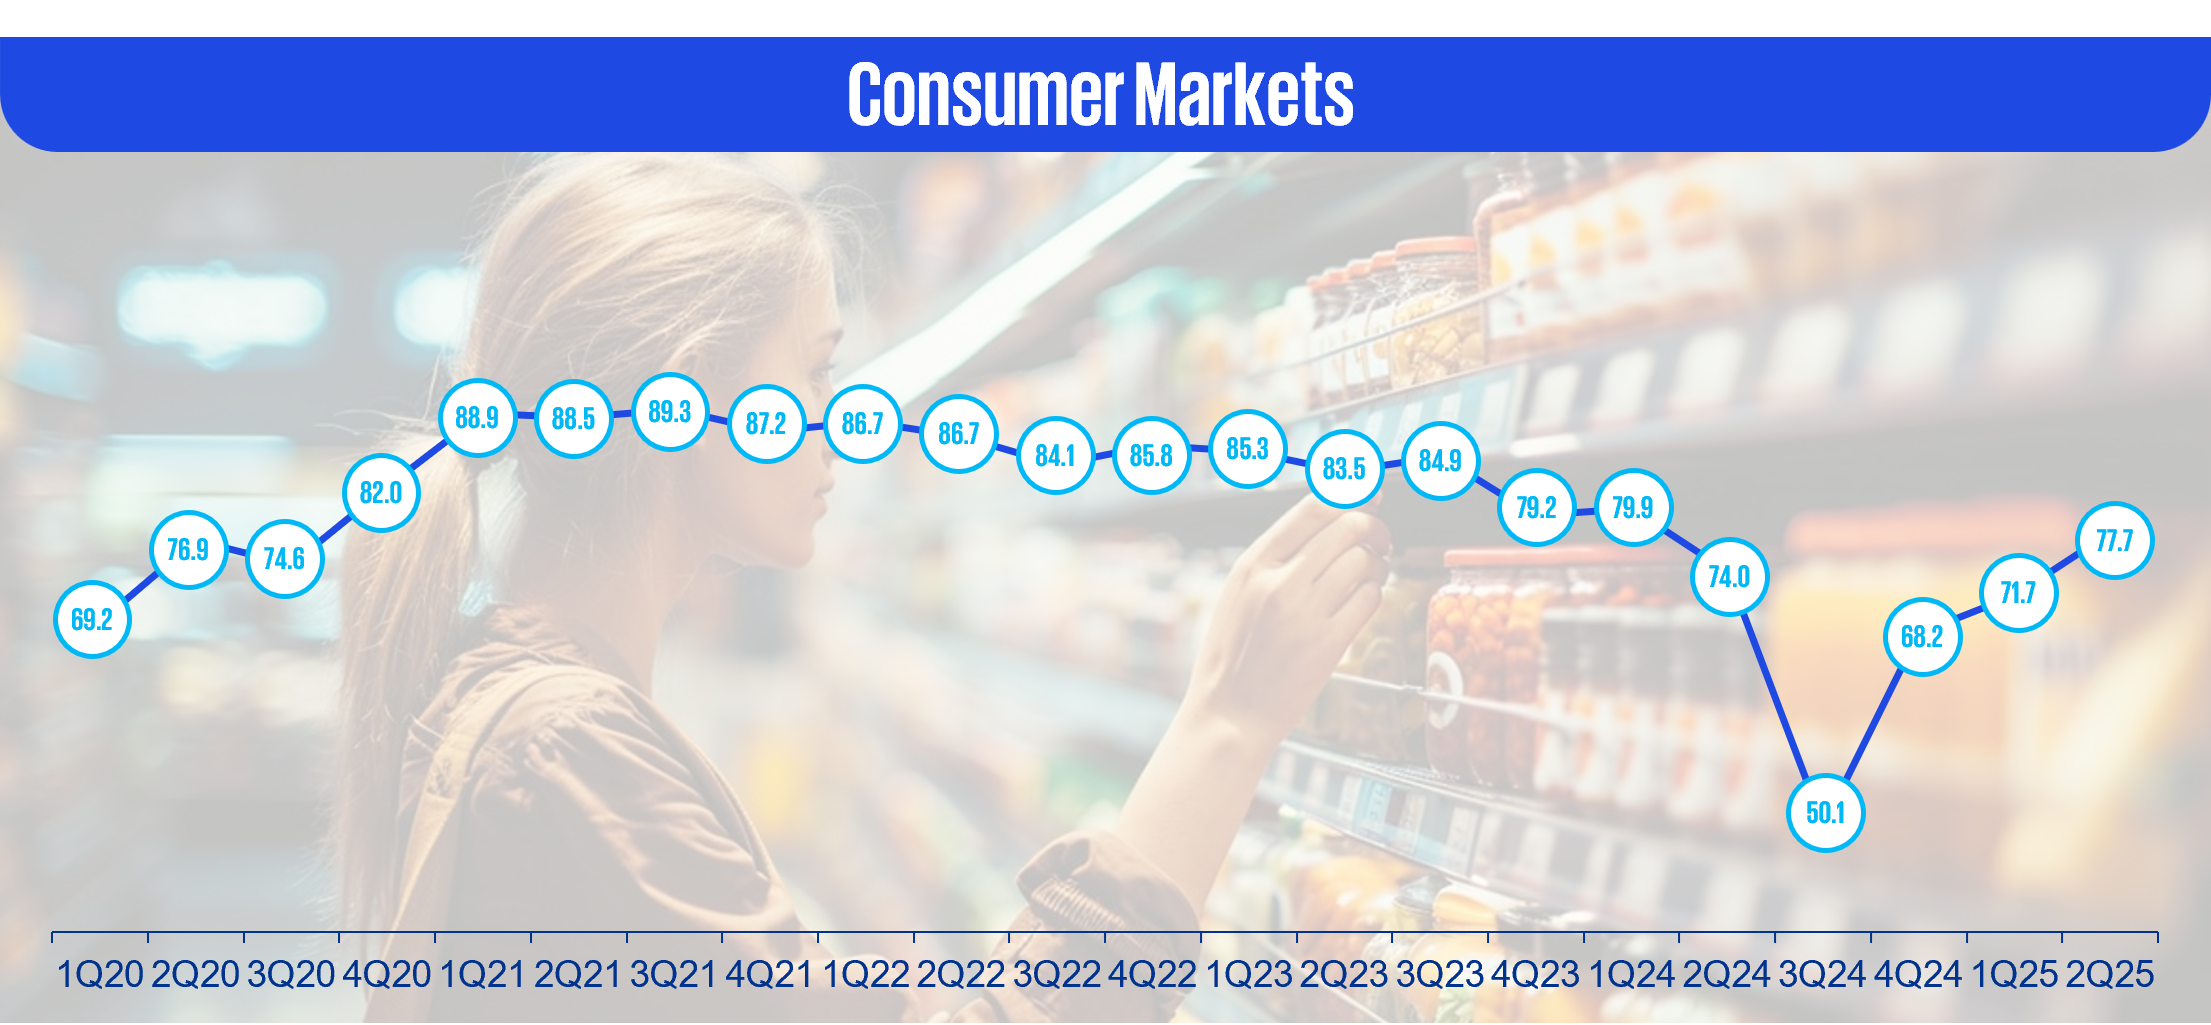
- Consumer Markets
- Energy
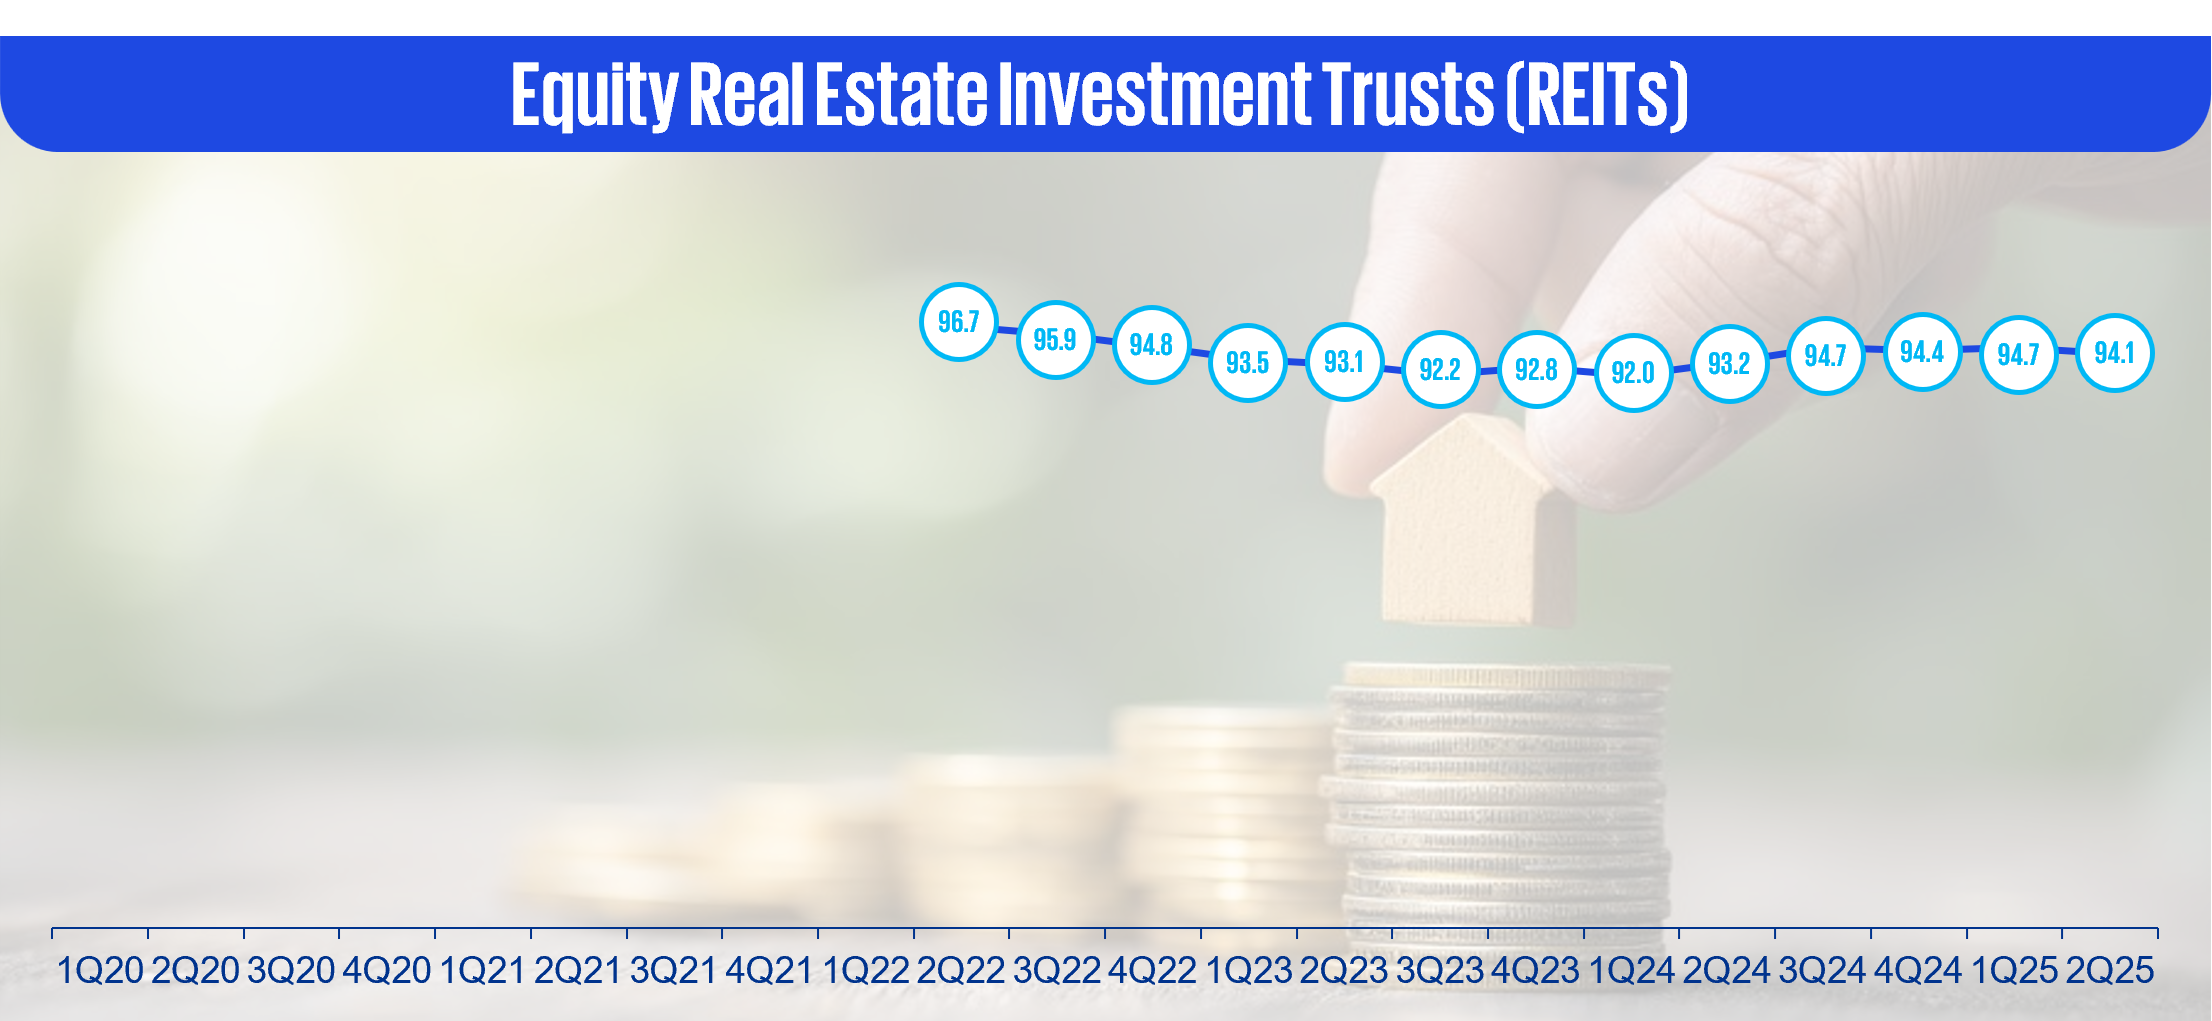
- Equity Real Estate Investment Trusts (REITs)
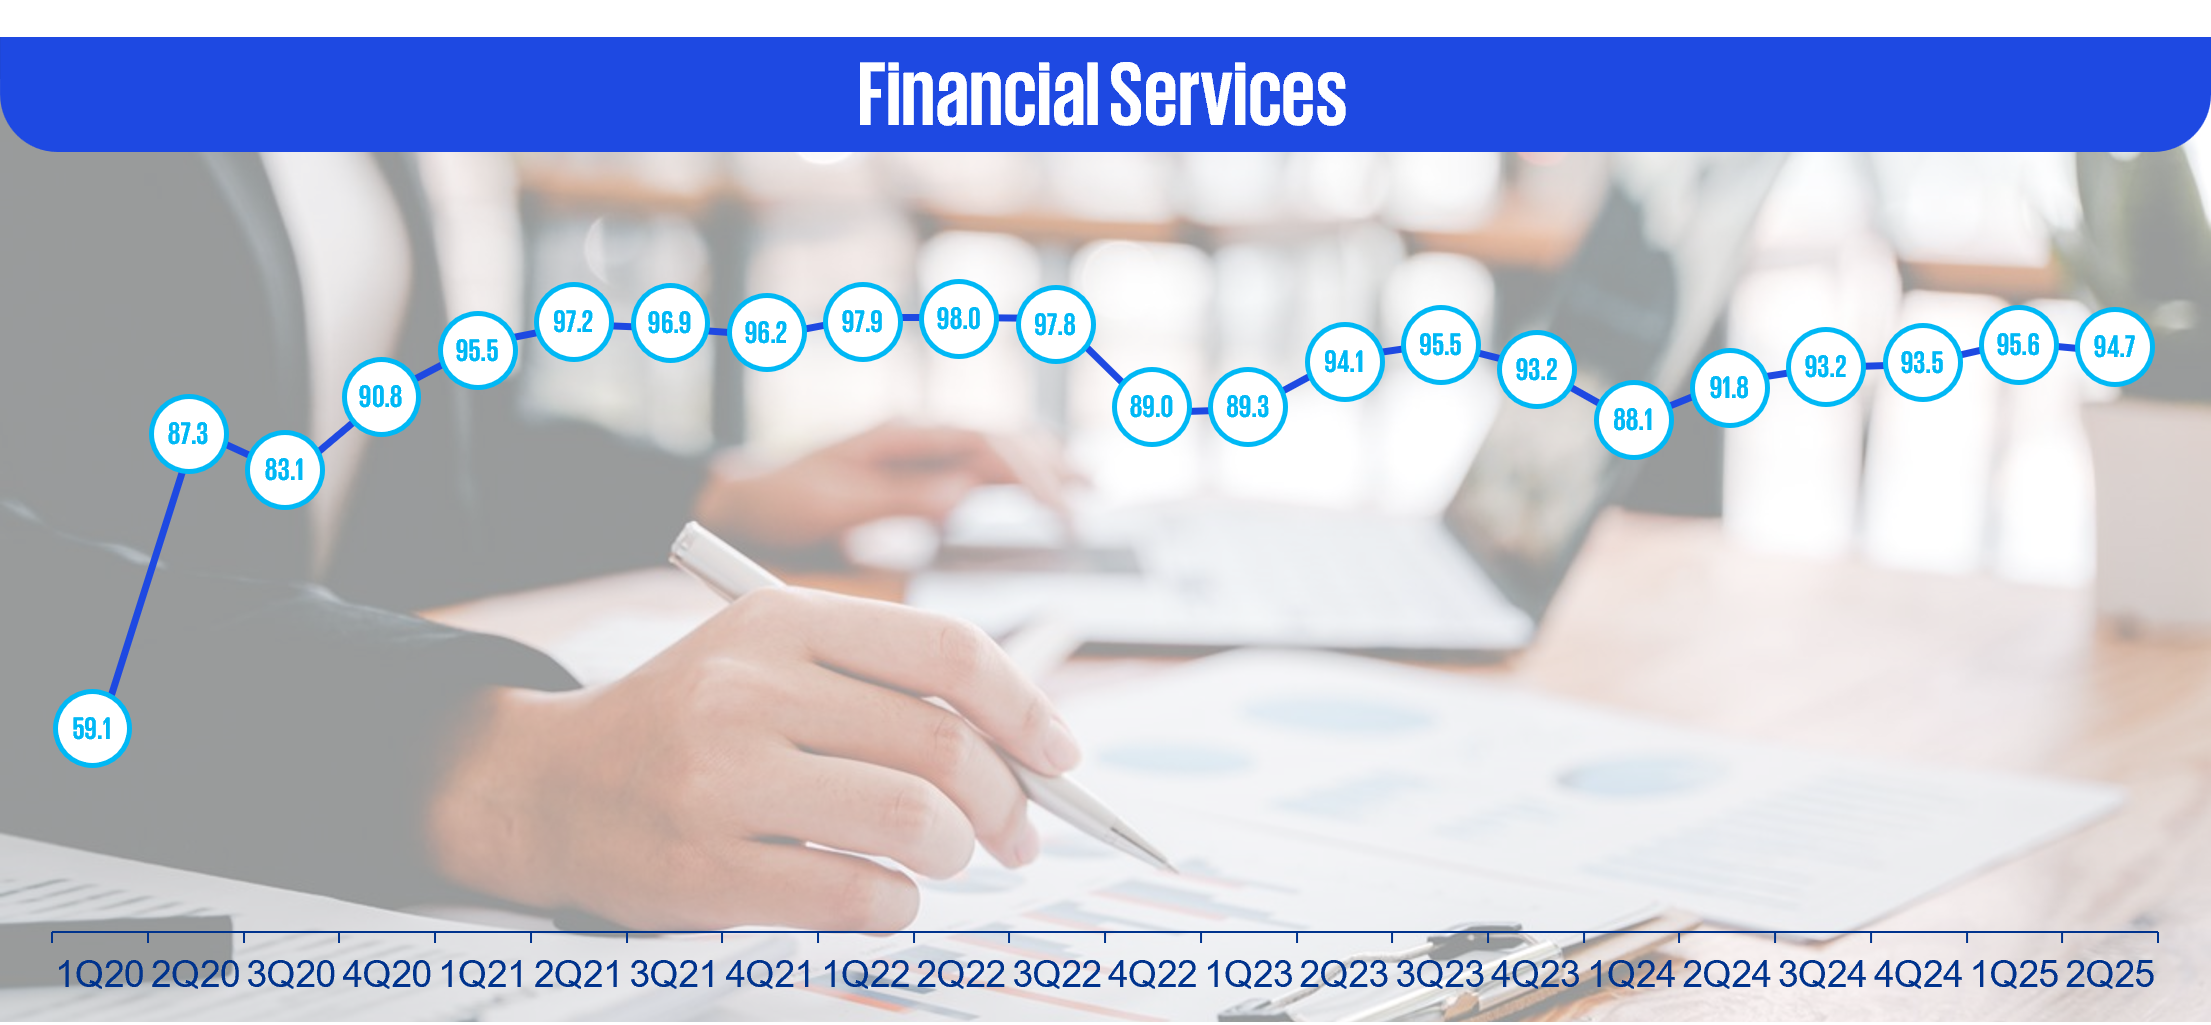
- Financial Services
- Food and Beverage
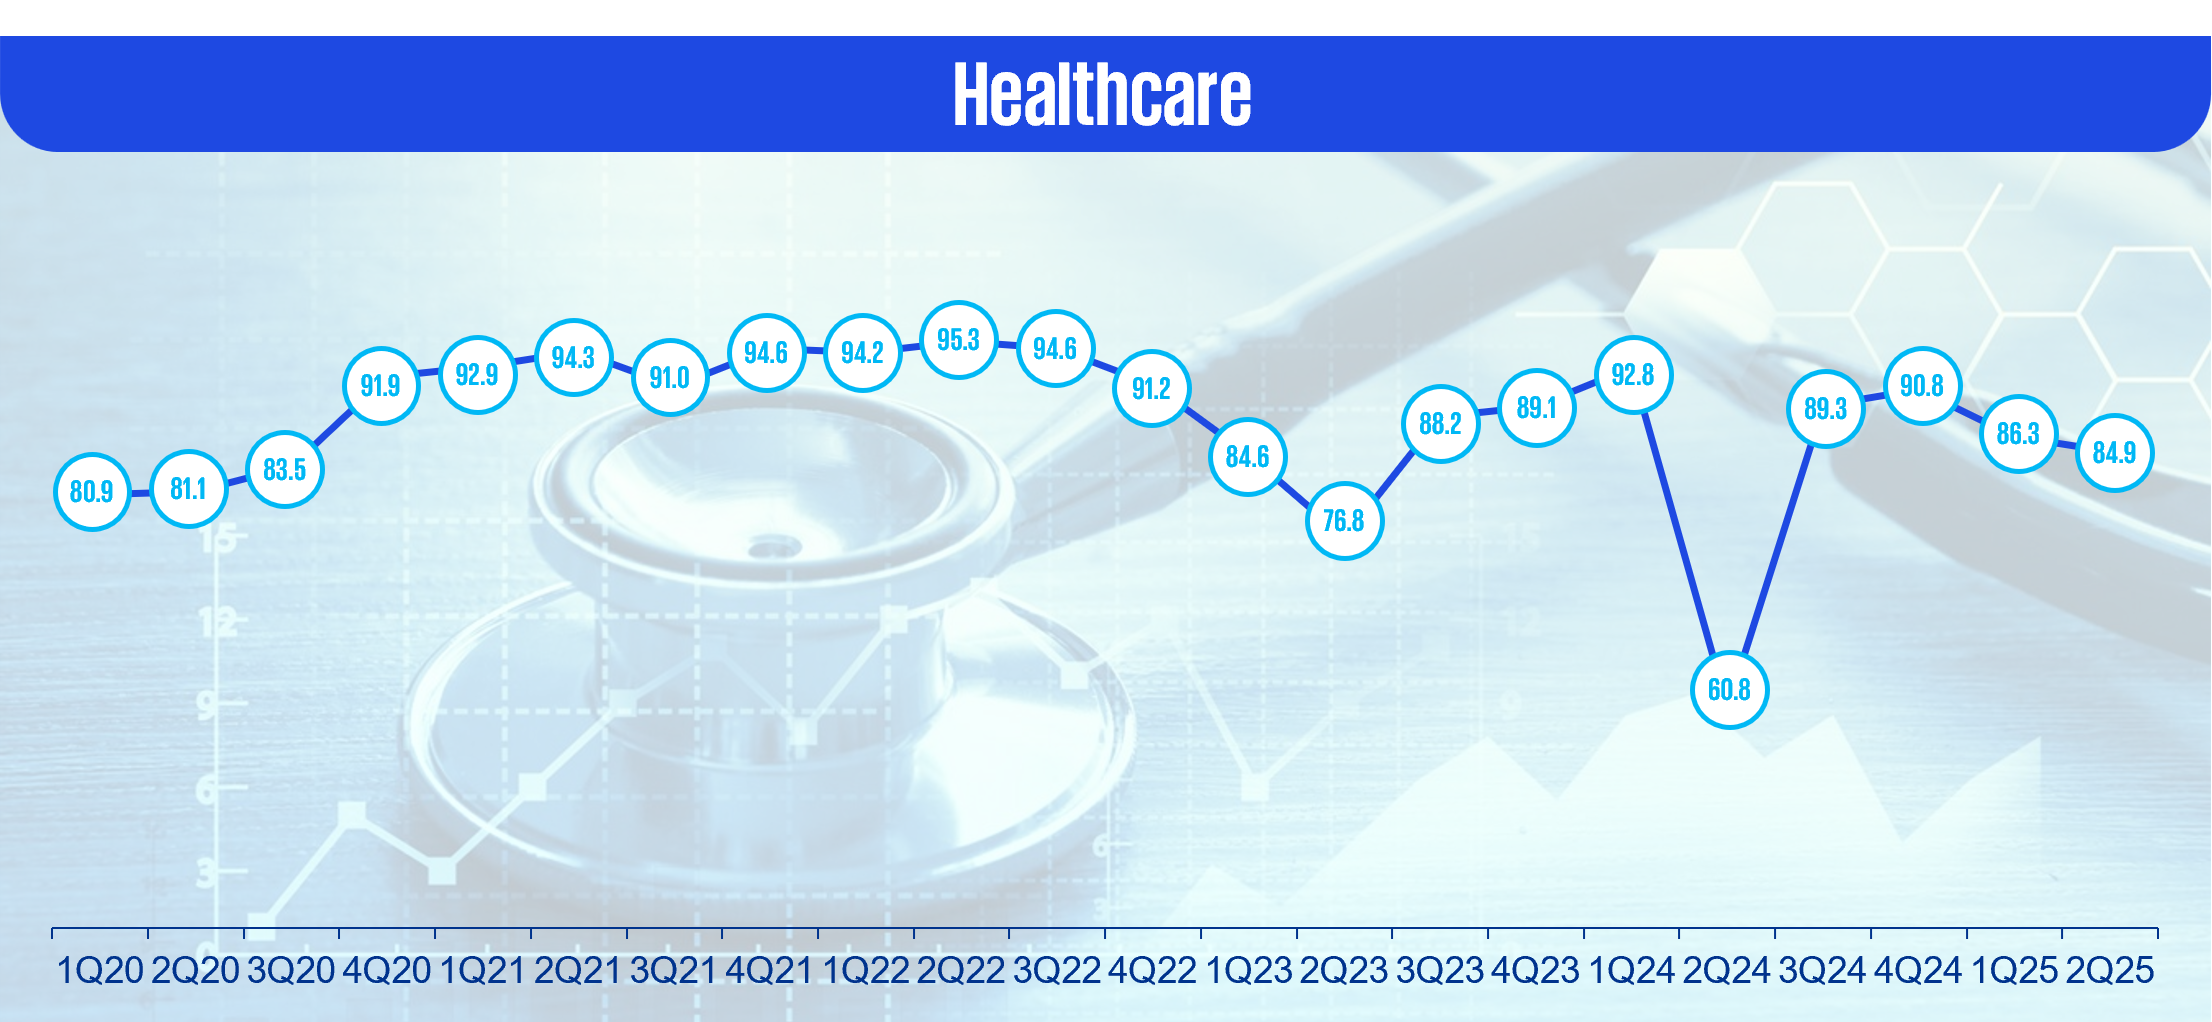
- Healthcare
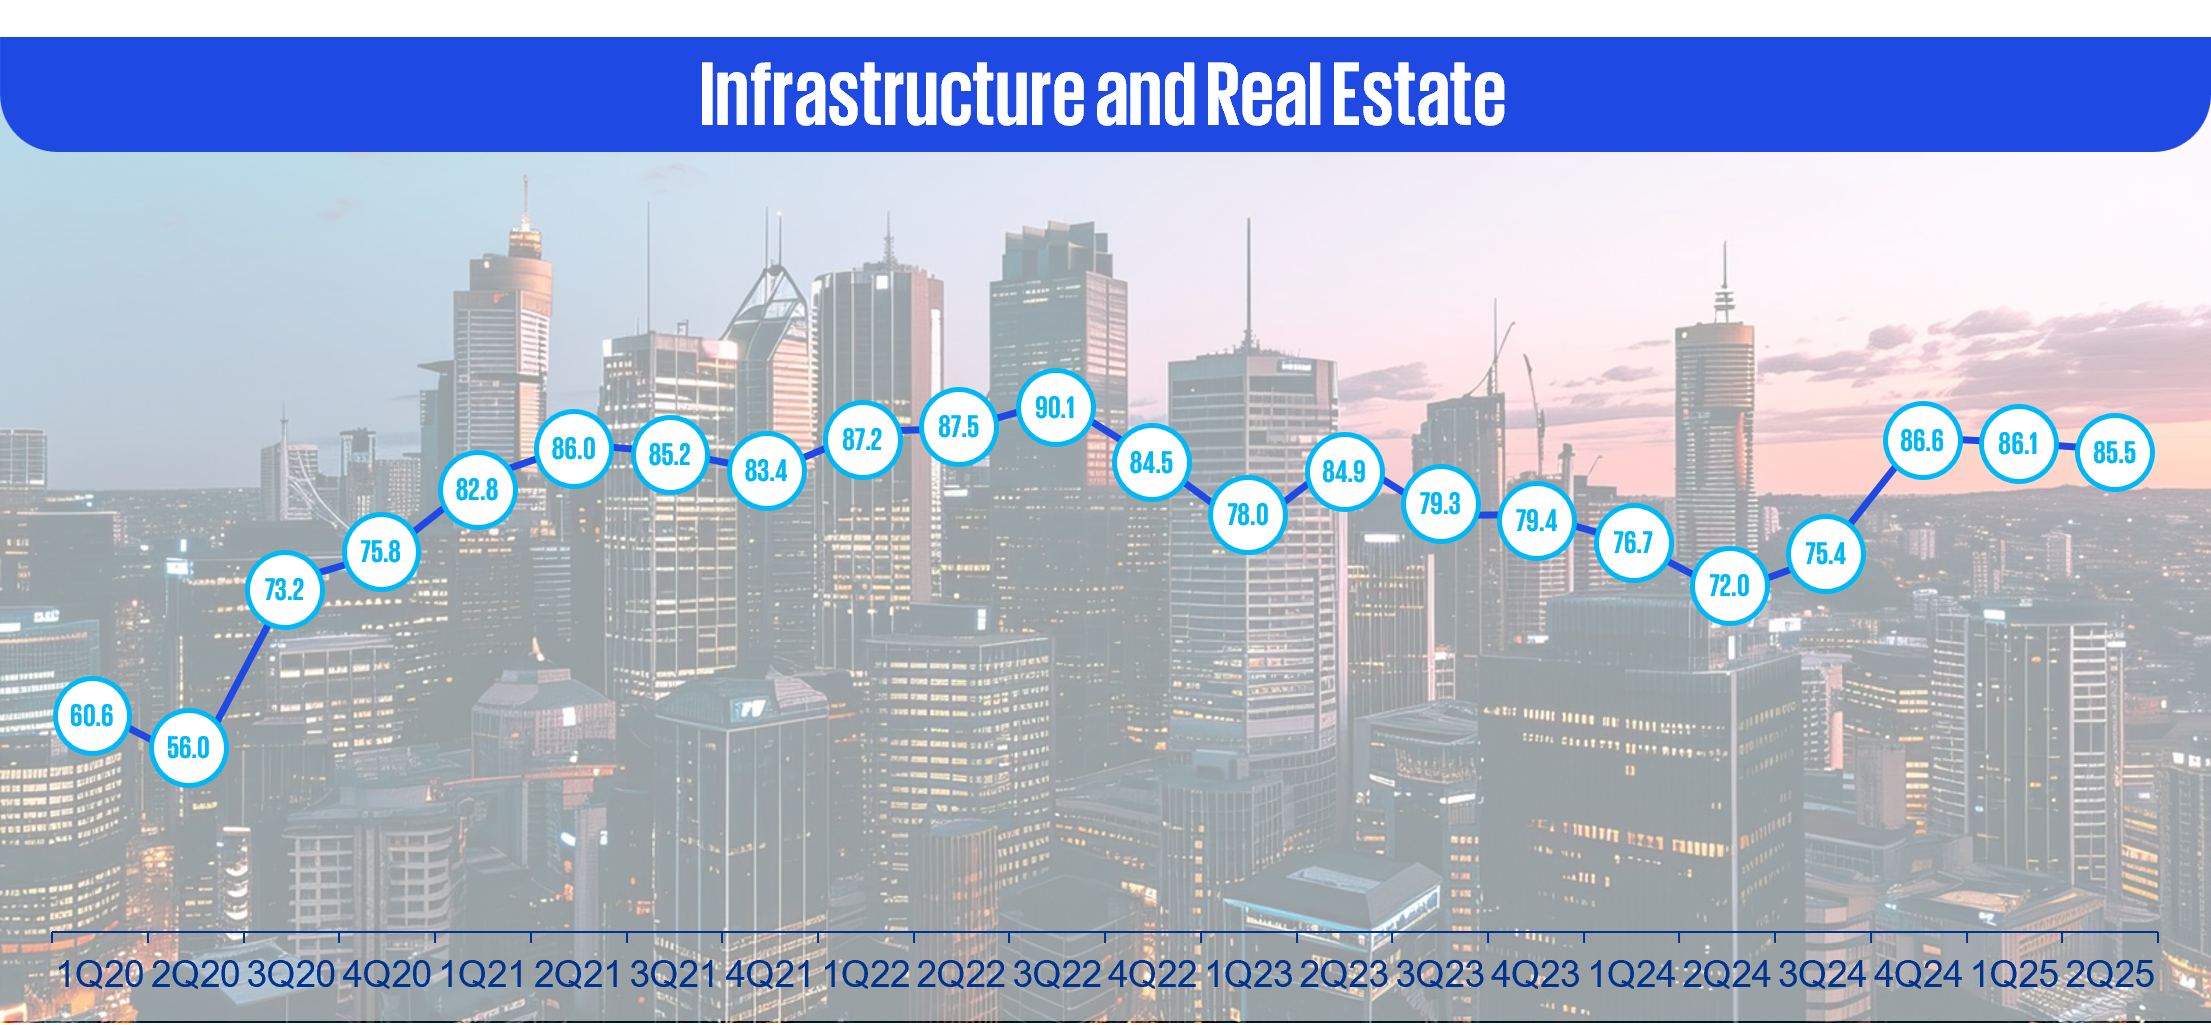
- Infrastructure and Real Estate
- Manufacturing
- Media and Entertainment
- Pharmaceuticals
- Raw Materials and Natural Resources
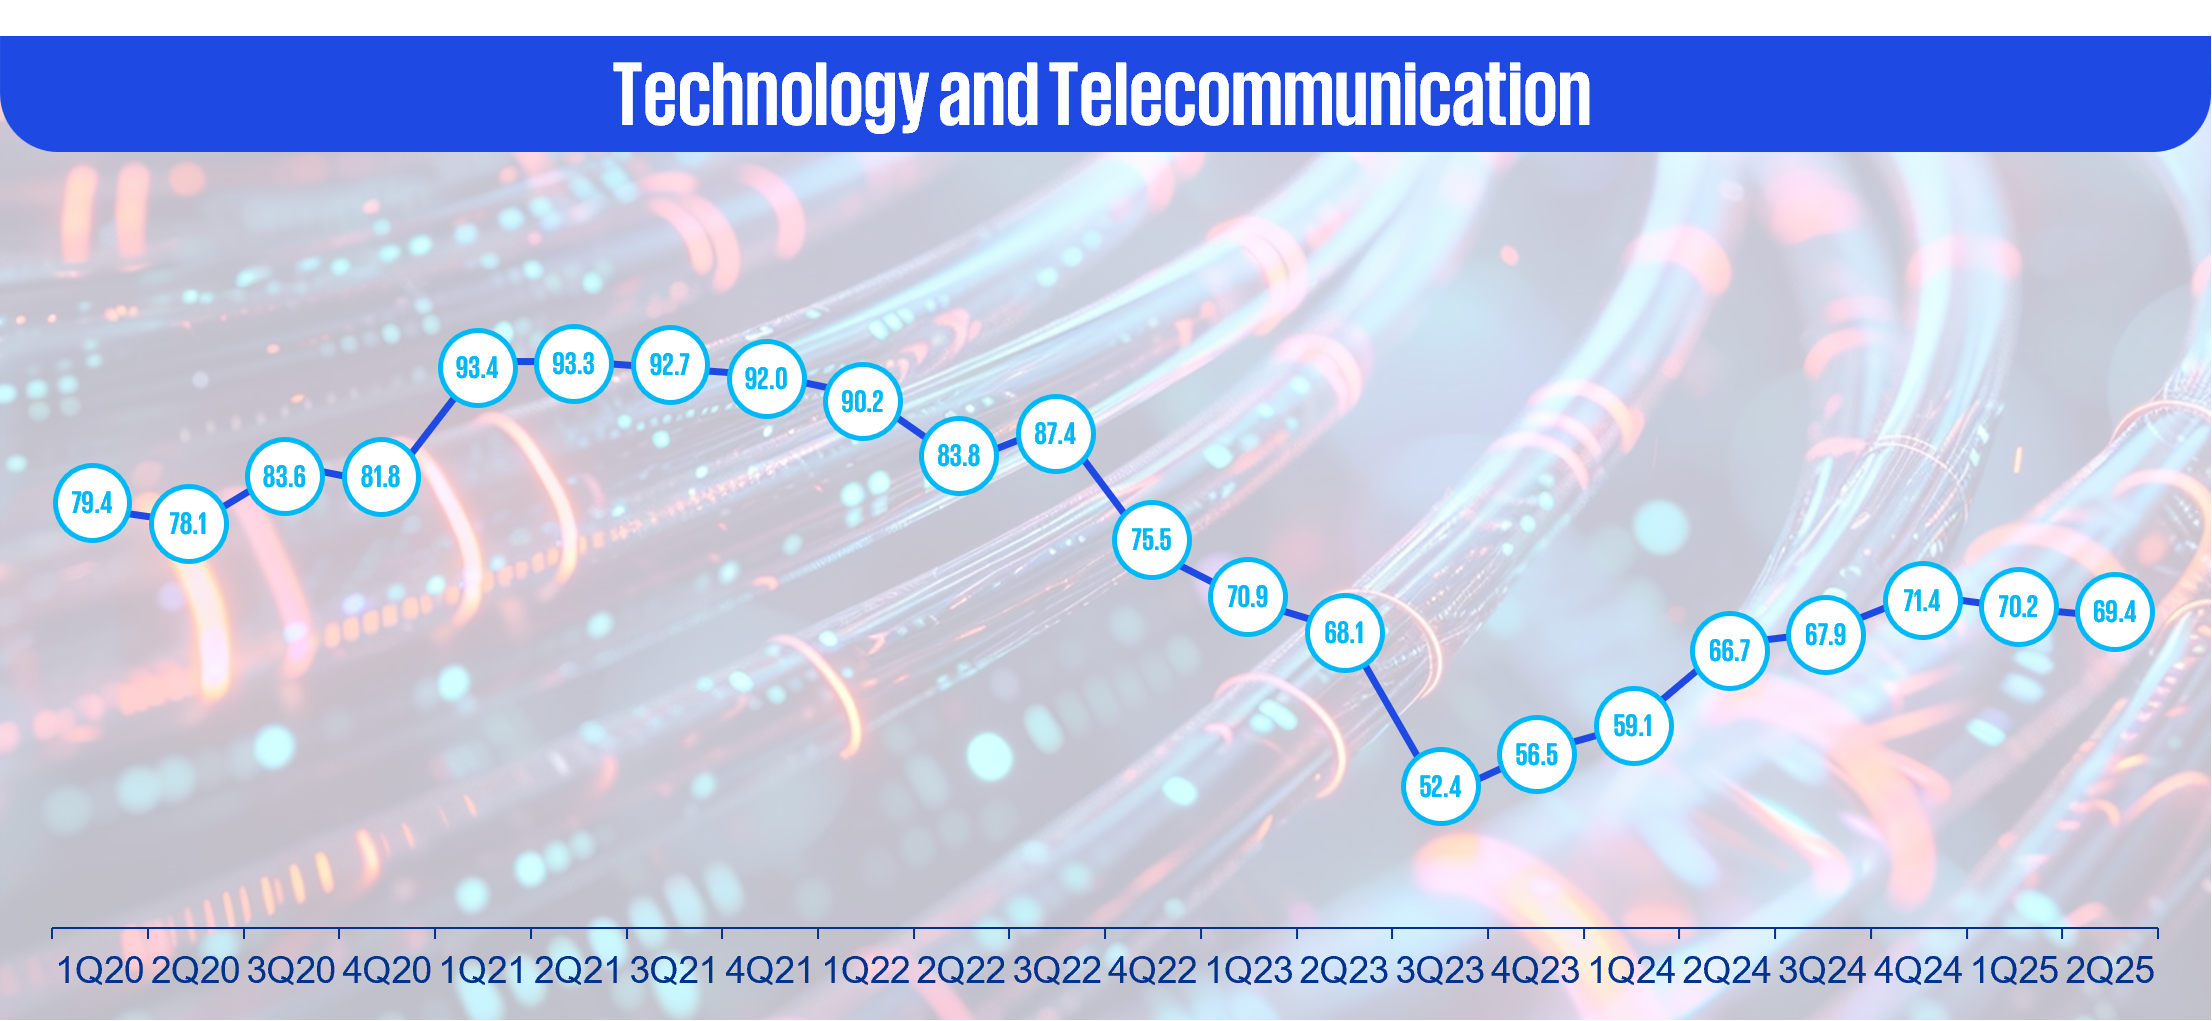
- Technology and Telecommunication
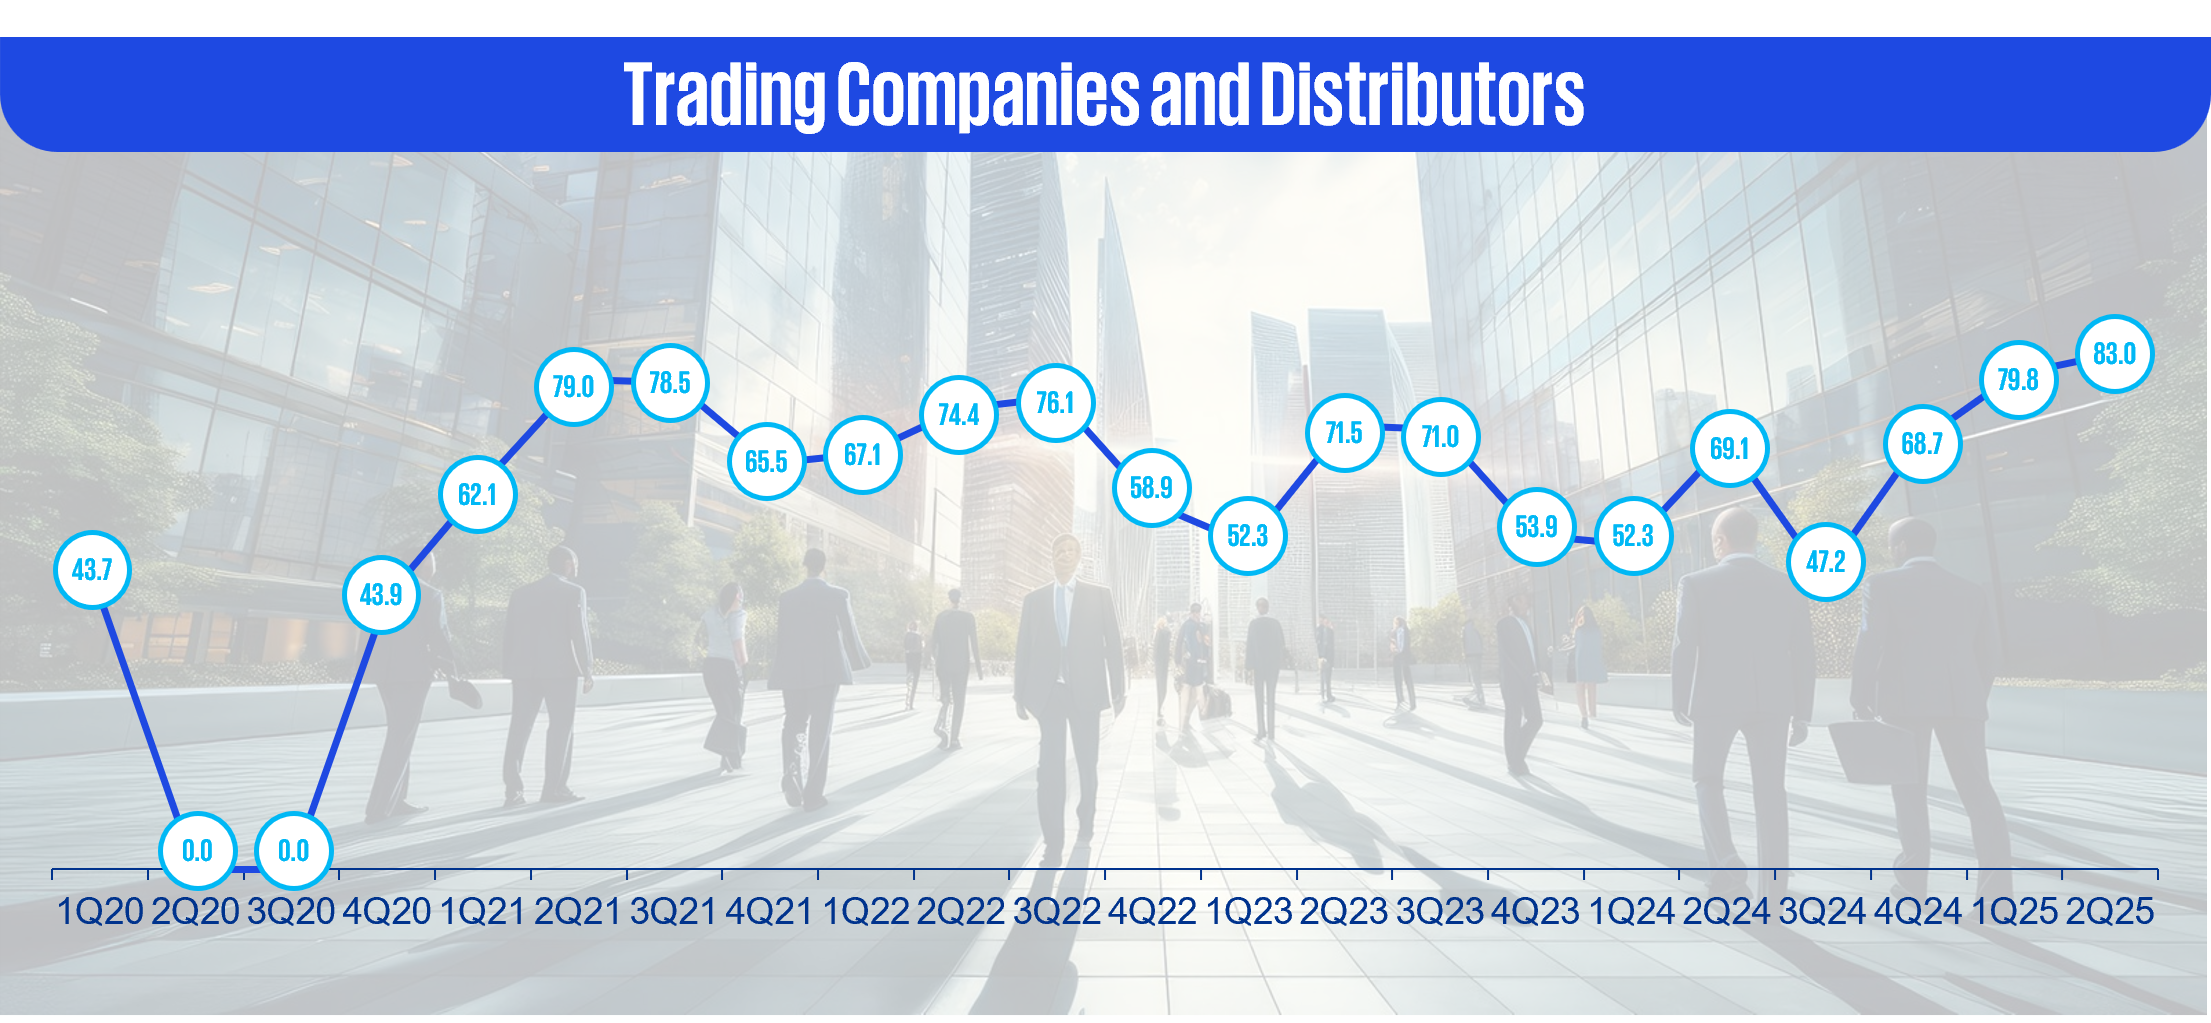
- Trading Companies and Distributors
- Transportation and Logistic
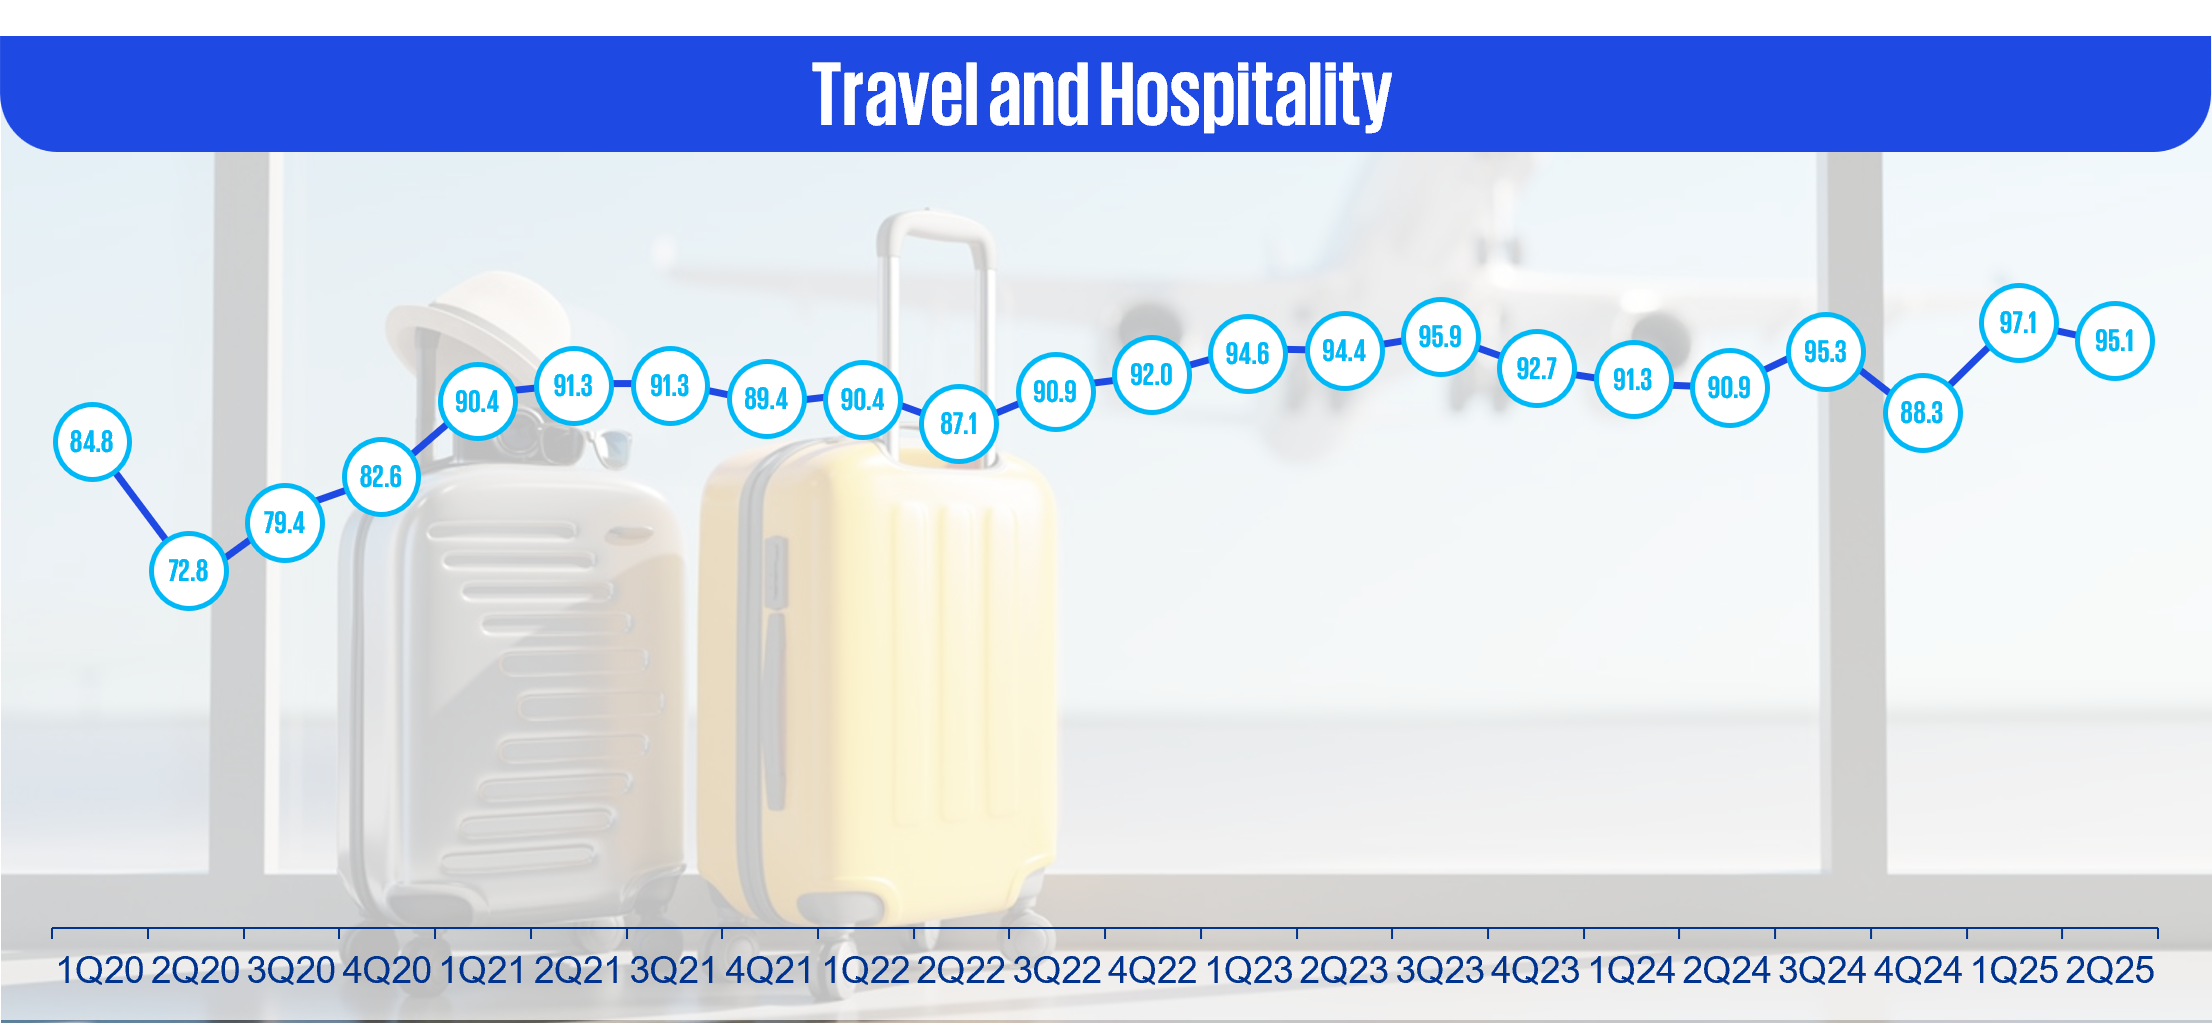
- Travel and Hospitality
- Utilities
Zombies
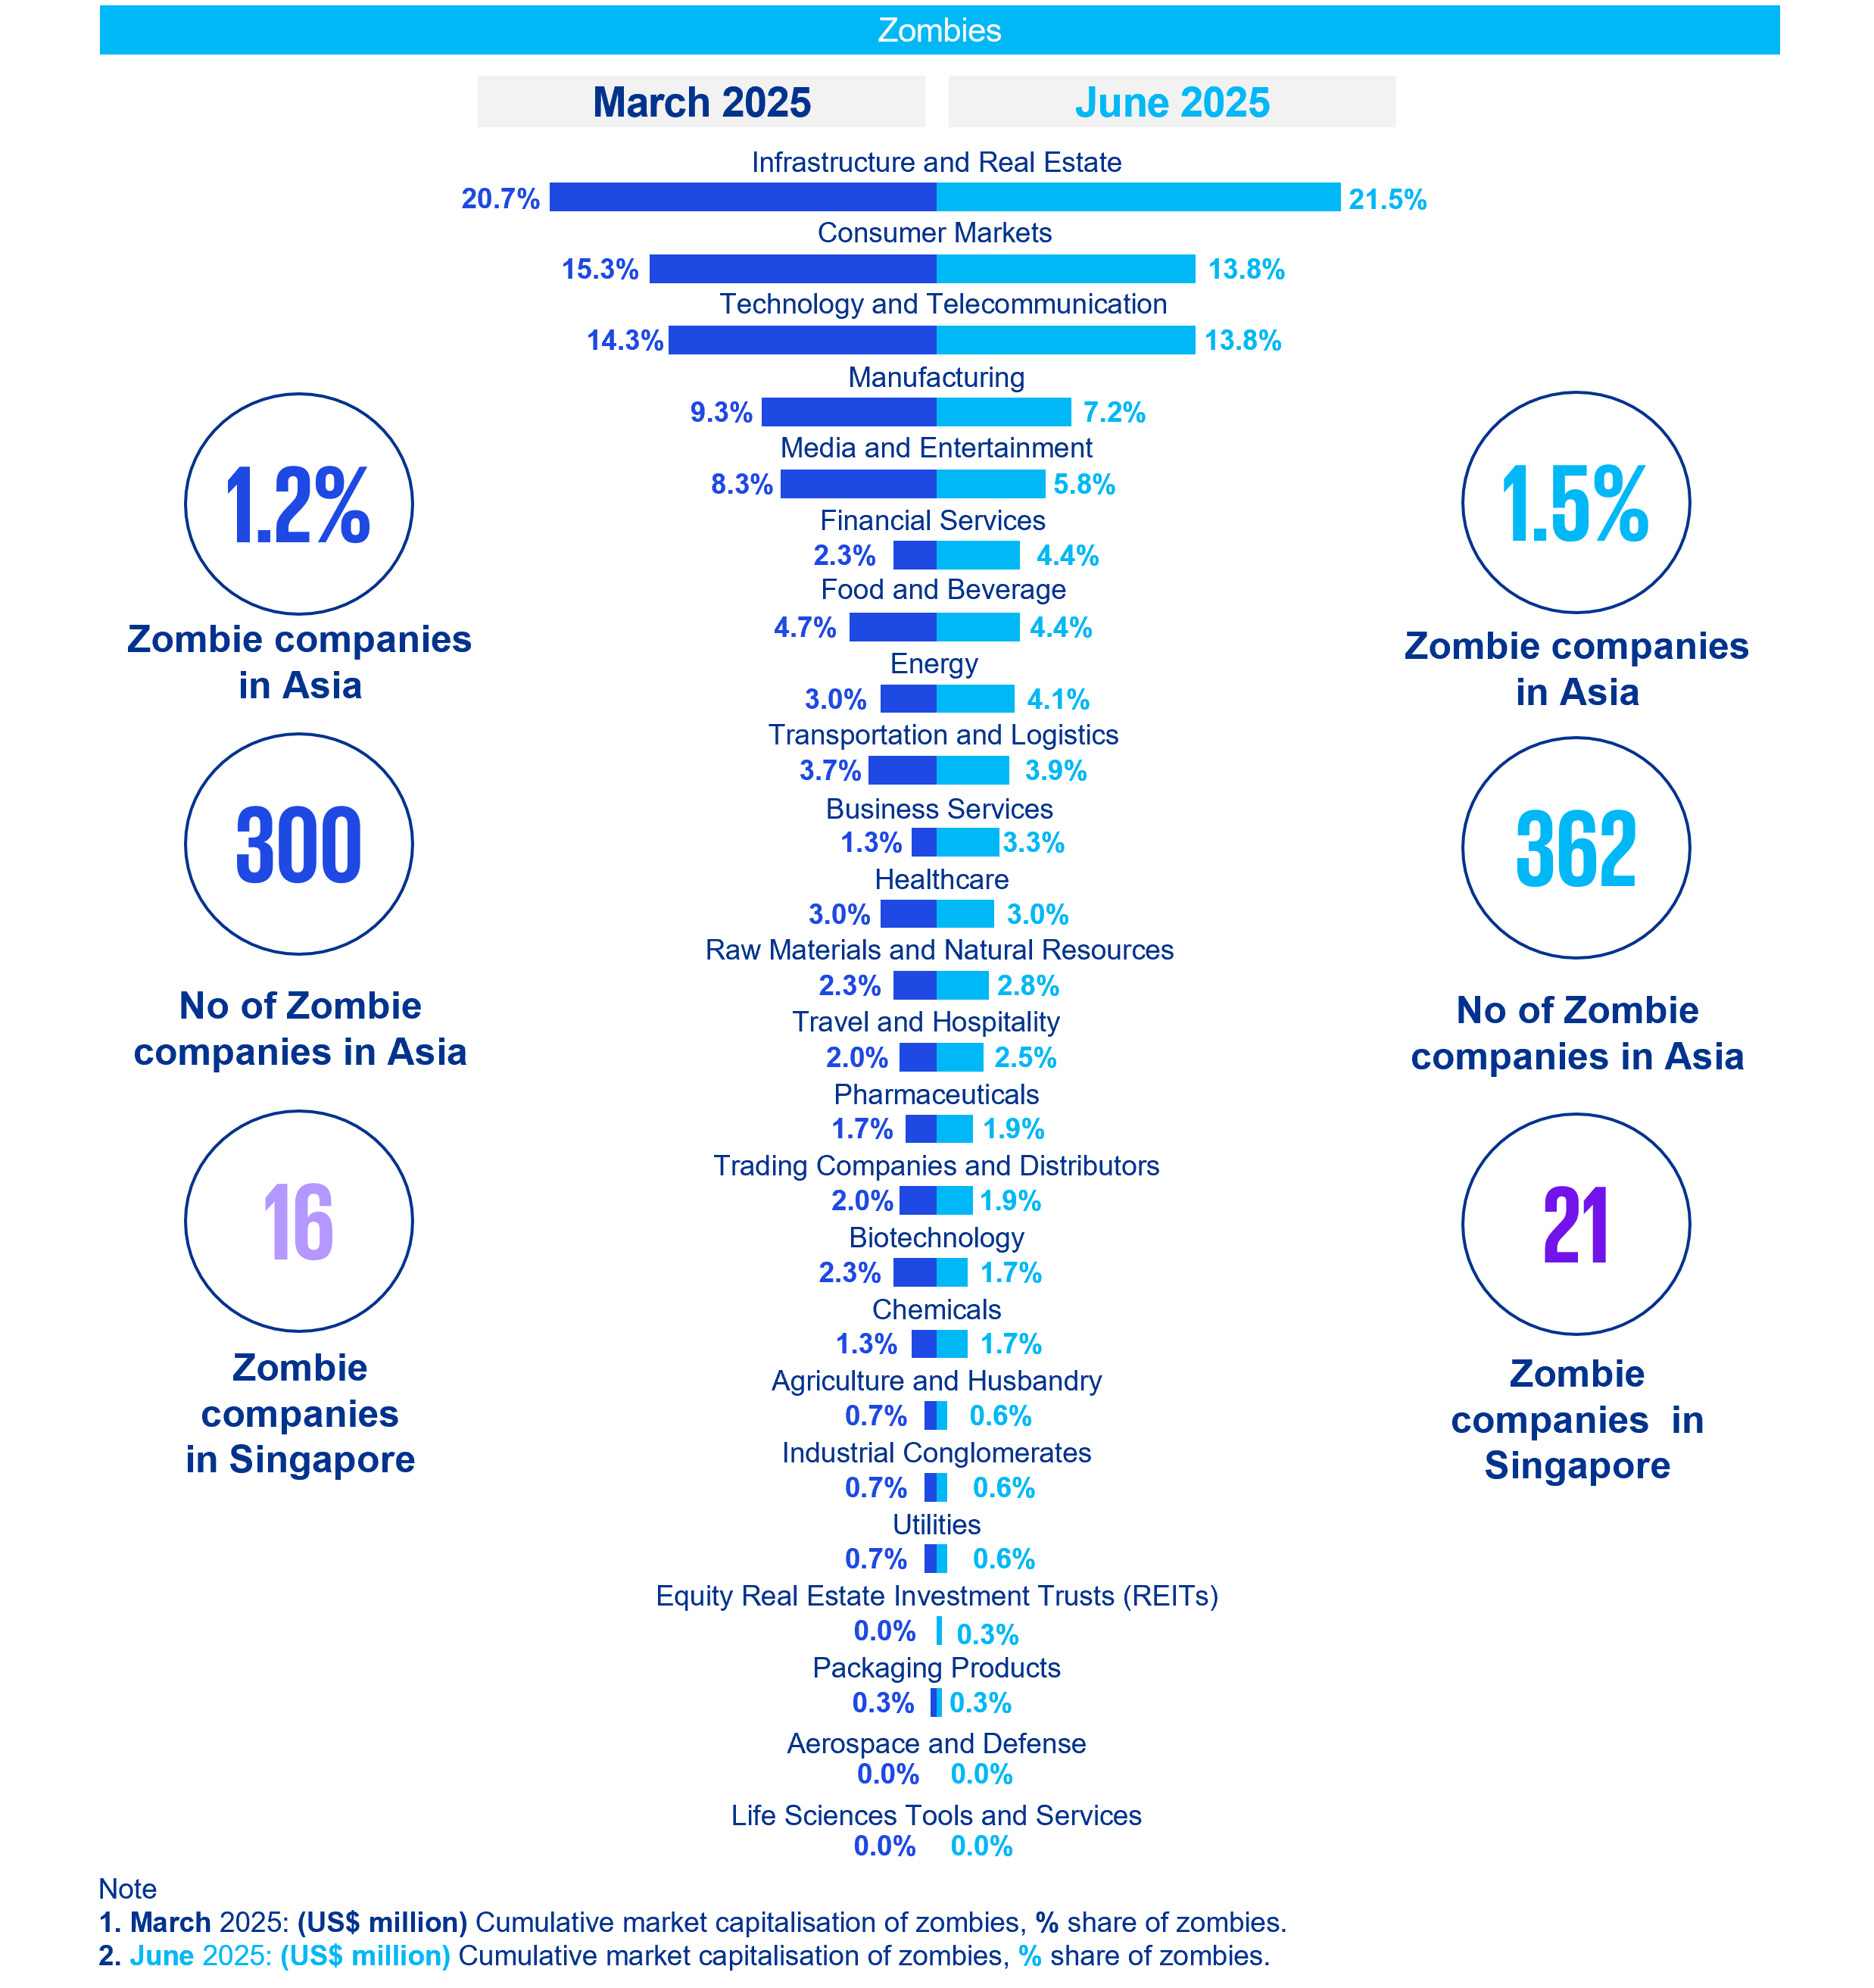
- Zombies are defined as companies close to default (scoring 0 on the KPMG FPI) for three or more consecutive quarters. These businesses might already be facing challenges or implementing restructuring plans.
- In Asia, the number of zombie companies rose from 300 in Q1 2025 to 362 in Q2 2025. The sectors with the highest concentration of these companies are Infrastructure and Real Estate, which together account for 21.5% of all zombies—consisting 3% of the total companies in that sector. Consumer Markets and Technology & Telecommunications follow, each contributing 13.8% of the zombie count, despite representing only 1.7% and 1.2% of their respective sector totals.
- Singapore’s count of zombies increased from 16 in 1Q25 to 21 in 2Q25. Notably 9 out of 21 zombies fall under the Technology and Telecommunication sector.
Trends of Zombies in the KPMG FPI
The KPMG Financial Performance Index measures the financial health of individual companies. Based on an initial pool of more than 40,000 companies globally, KPMG FPI identifies those companies, sectors, regions, countries, and territories that are performing well and those that are underperforming. A higher score on the KPMG FPI represents strong performance.
The KPMG FPI model draws from the Logit Probability to Financial Default model (developed by John Campbell, Jens Hilscher and Jan Szilagyi), which is based on eight explanatory variables encompassing financial and market variables, to arrive at the overall financial health of a company. The KPMG FPI is based on raw data from S&P Capital IQ database.
Global analysis
The global version of this tool is also available.
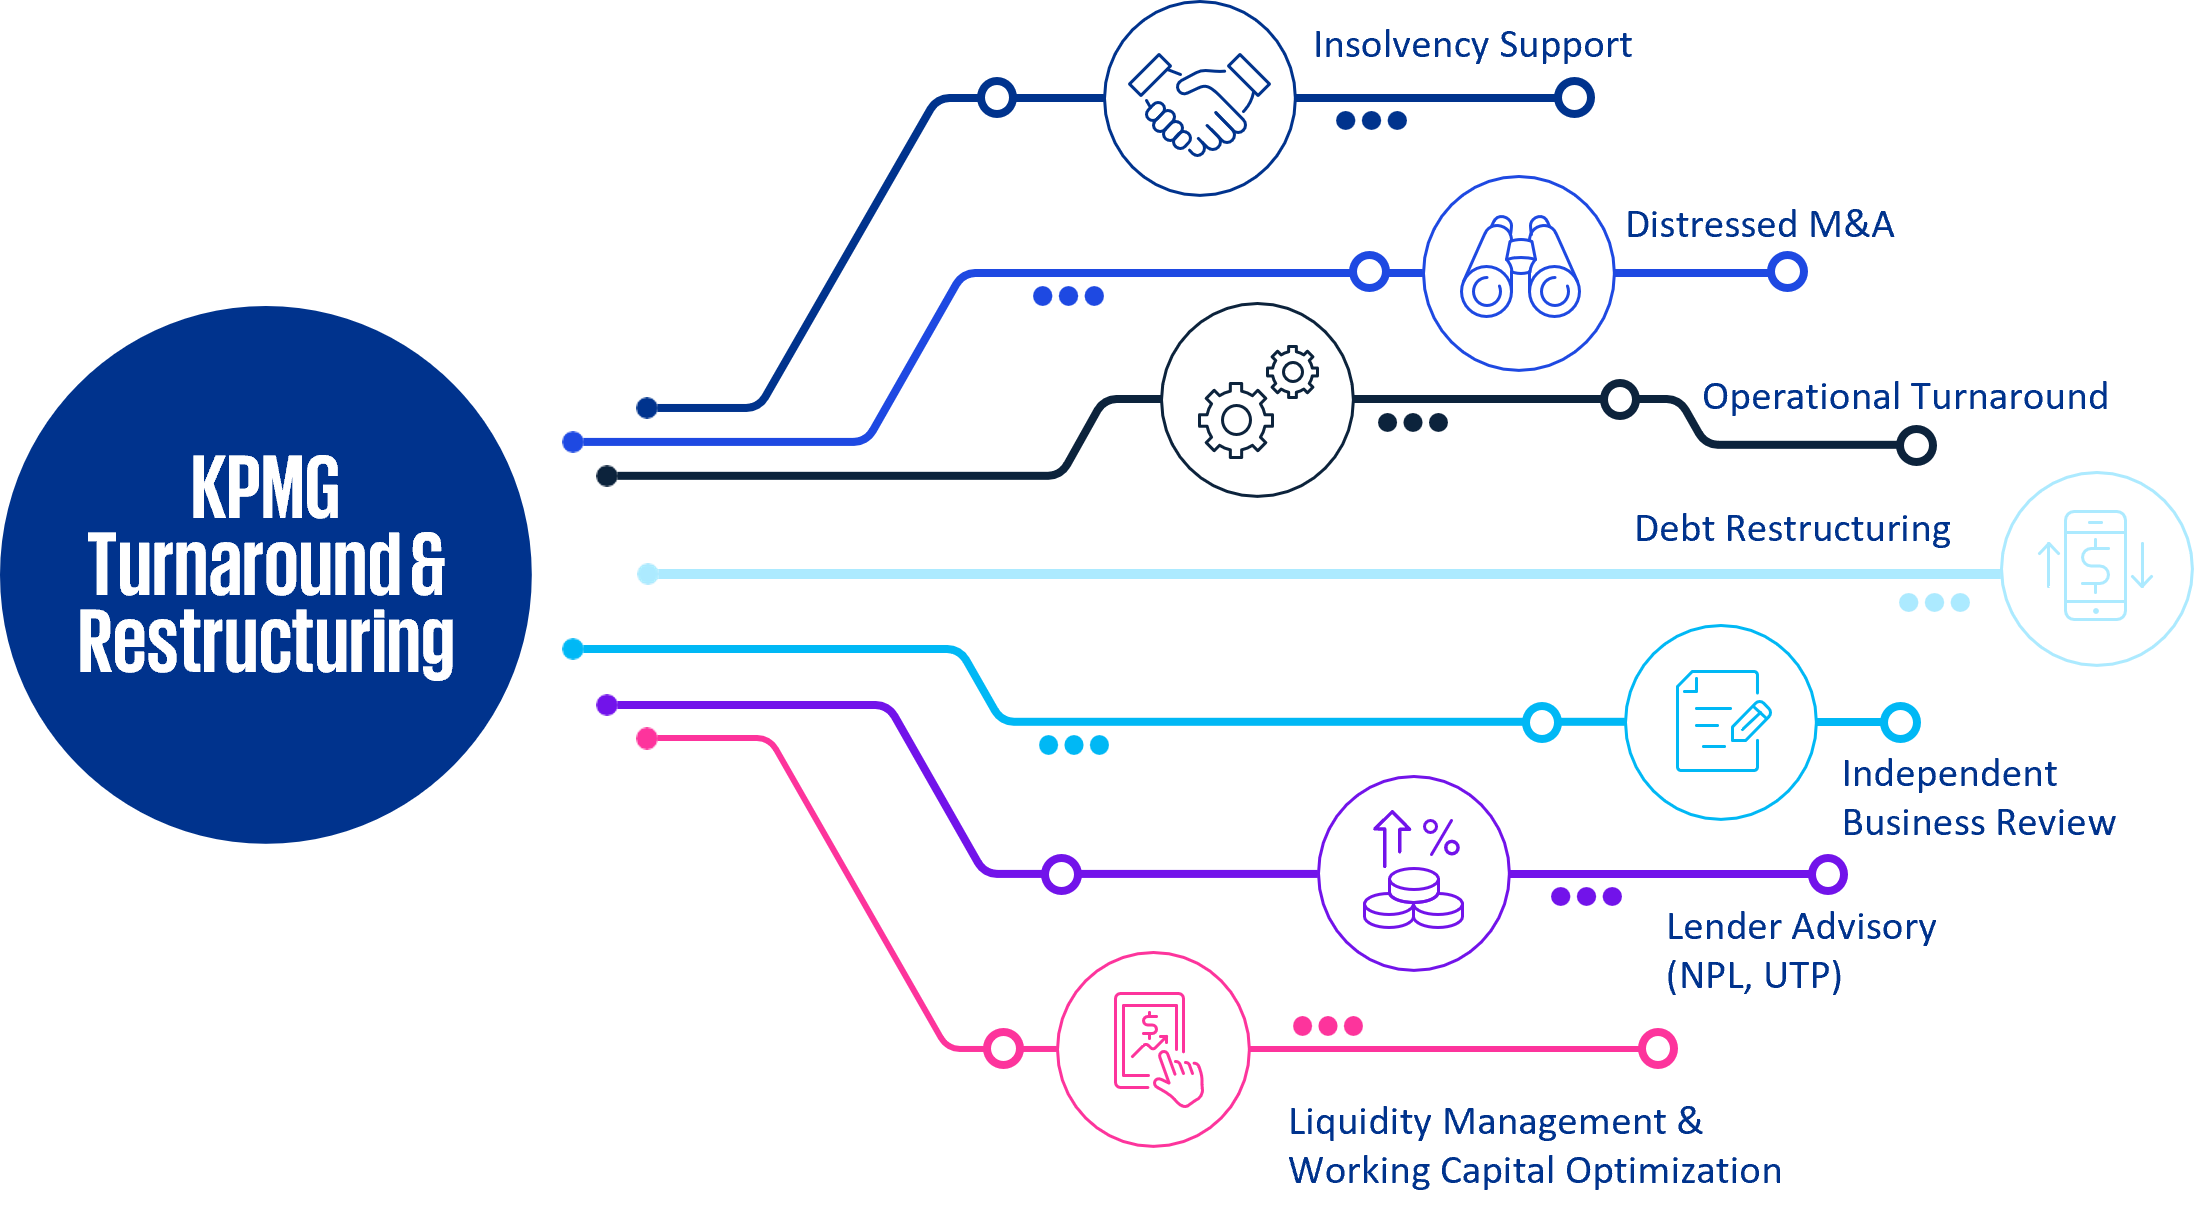
How we can help
To understand your company’s current index score, or to uncover deeper insights about specific markets or segments, contact us today. KPMG’s global network of professionals have the data, sector, and geographic expertise to help you understand your score and tie it back to your business needs. Whether it is benchmarking, identifying targets, comparing sectors, or looking for trends over time, KPMG professionals can connect you to the information you need to capitalise on your opportunities.
Related content


Our people


