We are pleased to share with you the fifth edition of our quarterly KPMG Financial Performance Index (FPI) publication. This publication provides insights into the changing state of corporate health across all companies listed and headquarter in Singapore across all sectors, following the end of the reporting season for the three months to March 2025. KPMG FPI data is refreshed on a quarterly basis. For more information, visit the KPMG FPI page.
Singapore FPI performance comparison
KPMG Financial Performance Index (KPMG FPI Singapore) analysed across:

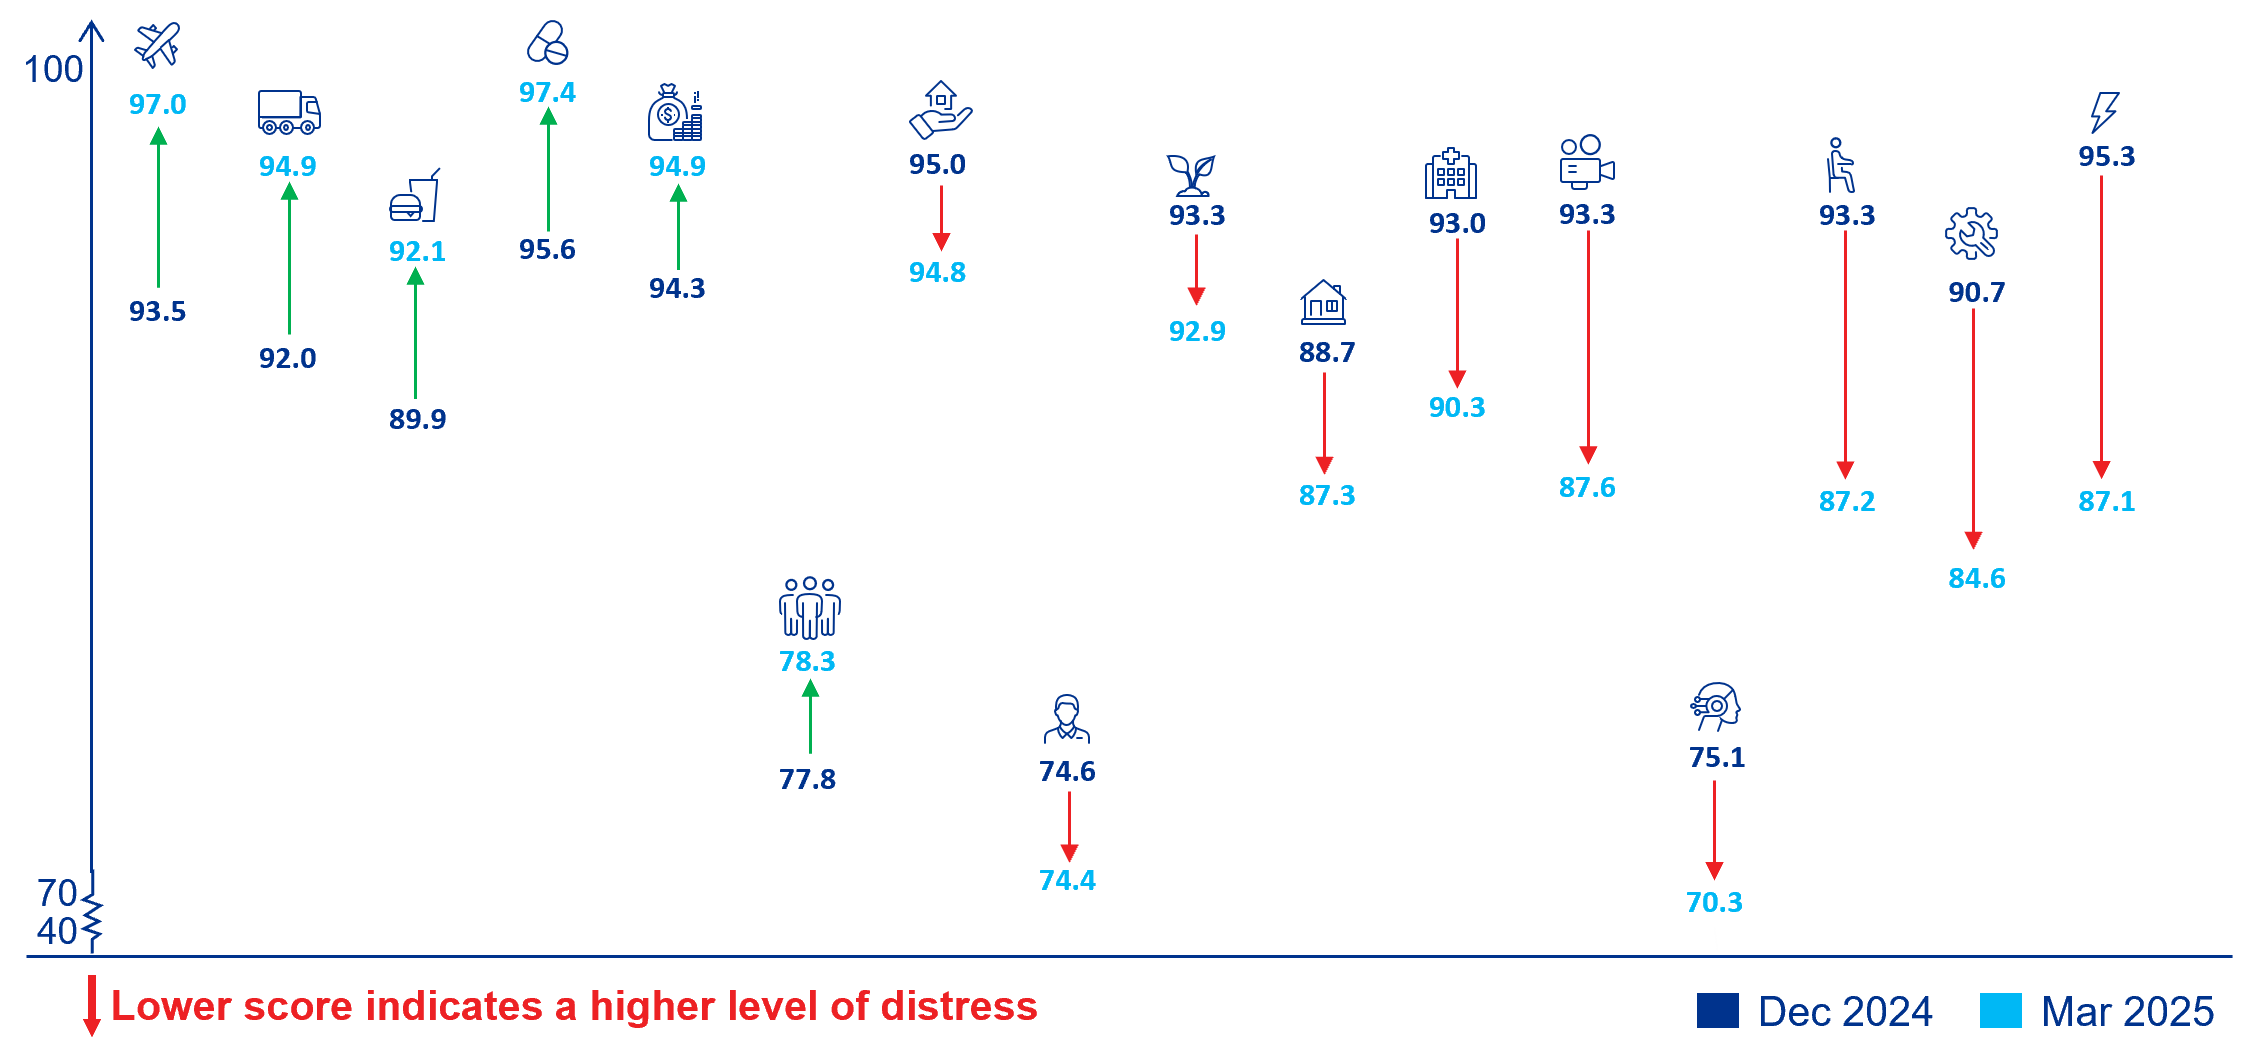
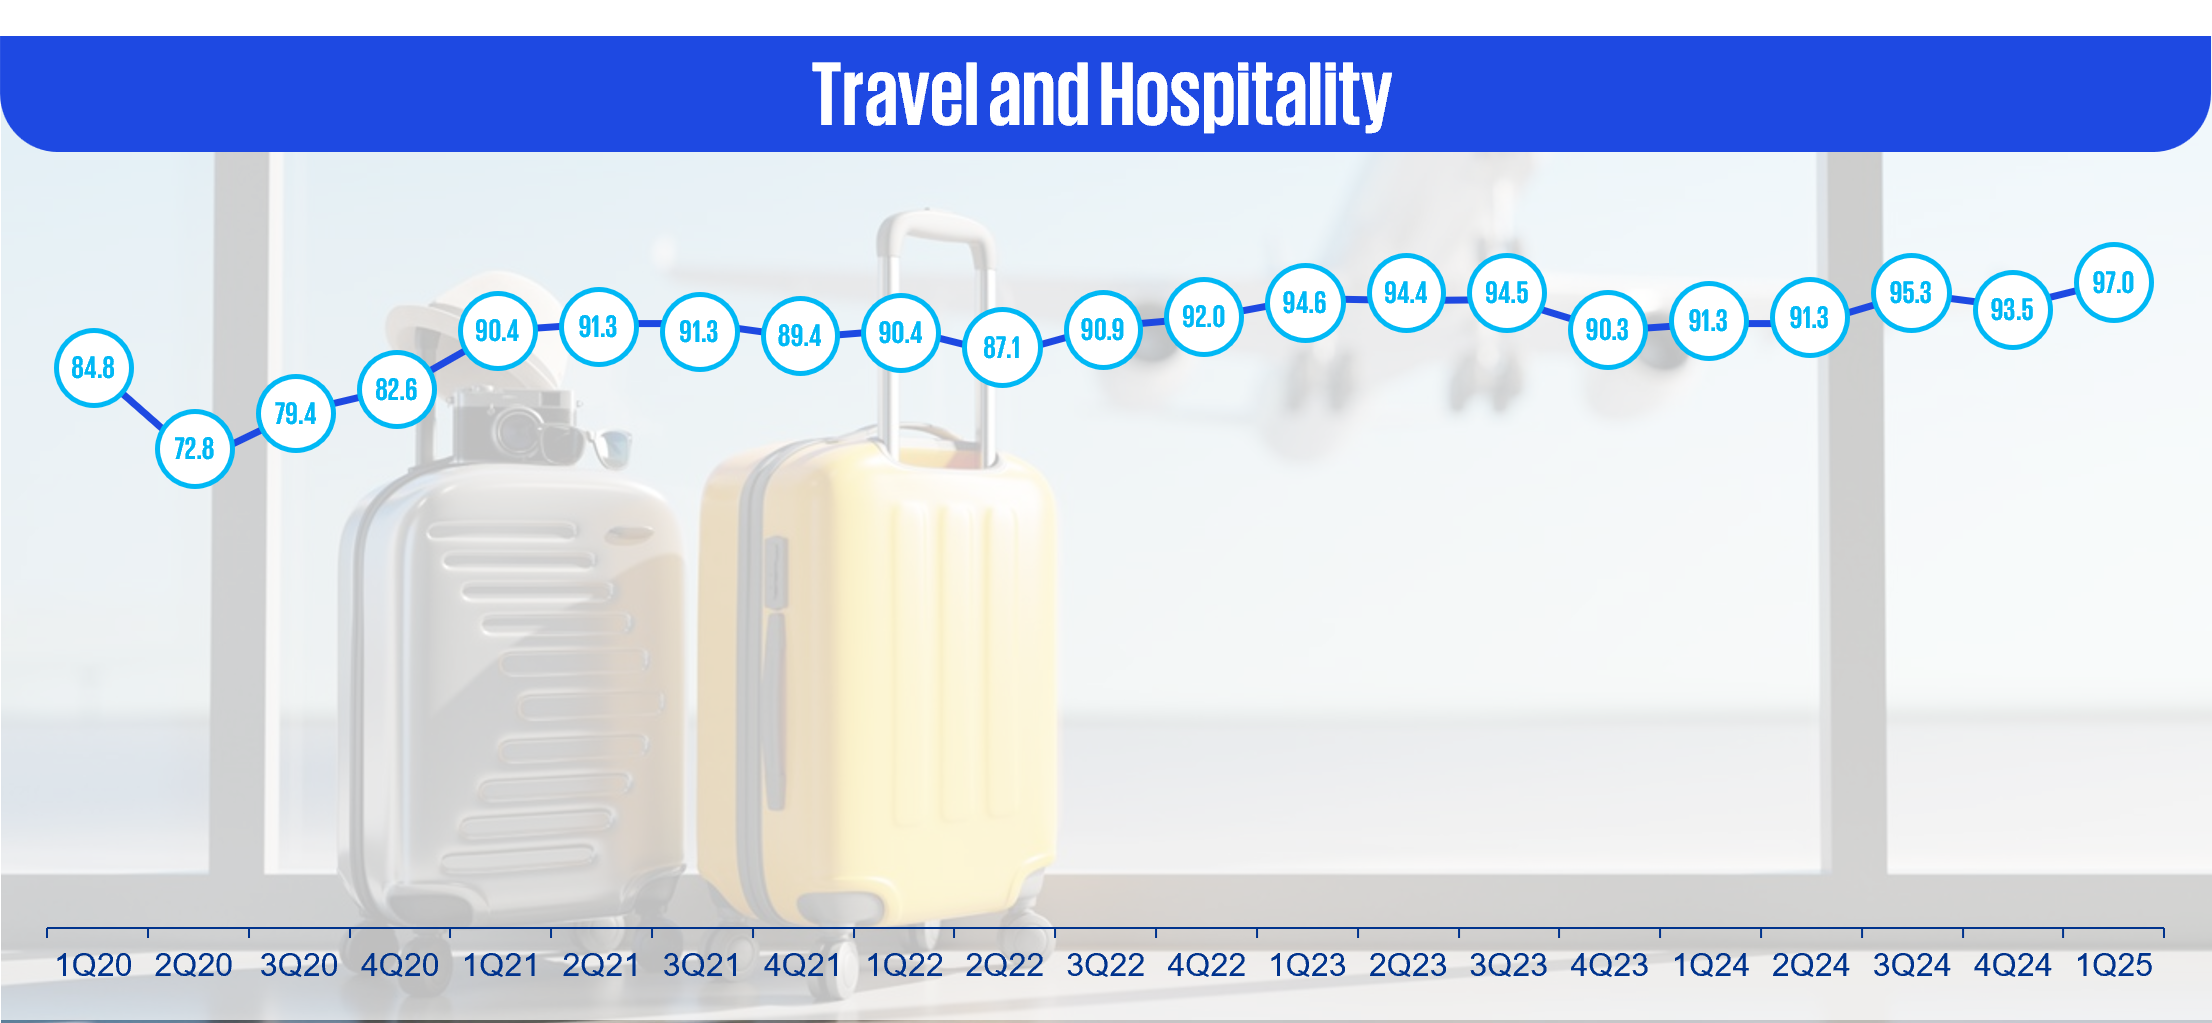
- From December 2024 to March 2025, Singapore's financial corporate health saw a slight decrease in FPI scores from 88.8 to 88.4. FPI scores for sectors like Travel and Hospitality (93.5 to 97.0), Transportation and Logistics (92.0 to 94.9), and Food and Beverage (89.9 to 92.1) increased significantly. However, Energy (95.3 to 87.1) registered the highest decline amongst all sectors, followed by Manufacturing (90.7 to 84.6)
- Singapore’s economy expanded by 3.9% Y-o-Y in Q1 2025, moderating from 5.0% in the previous quarter—a trend that aligns with the slight dip in FPI scores. Nonetheless, the country continues to outperform several neighboring economies. External trade remains robust, with household consumption improving amid easing inflation.
- The Ministry of Trade and Industry maintained its GDP growth forecast at 1.0%–3.0% for 2025, citing ongoing global uncertainties. Inflation is expected to average 1.6%, with core inflation lower, supported by favorable currency strength and declining global cost pressures.
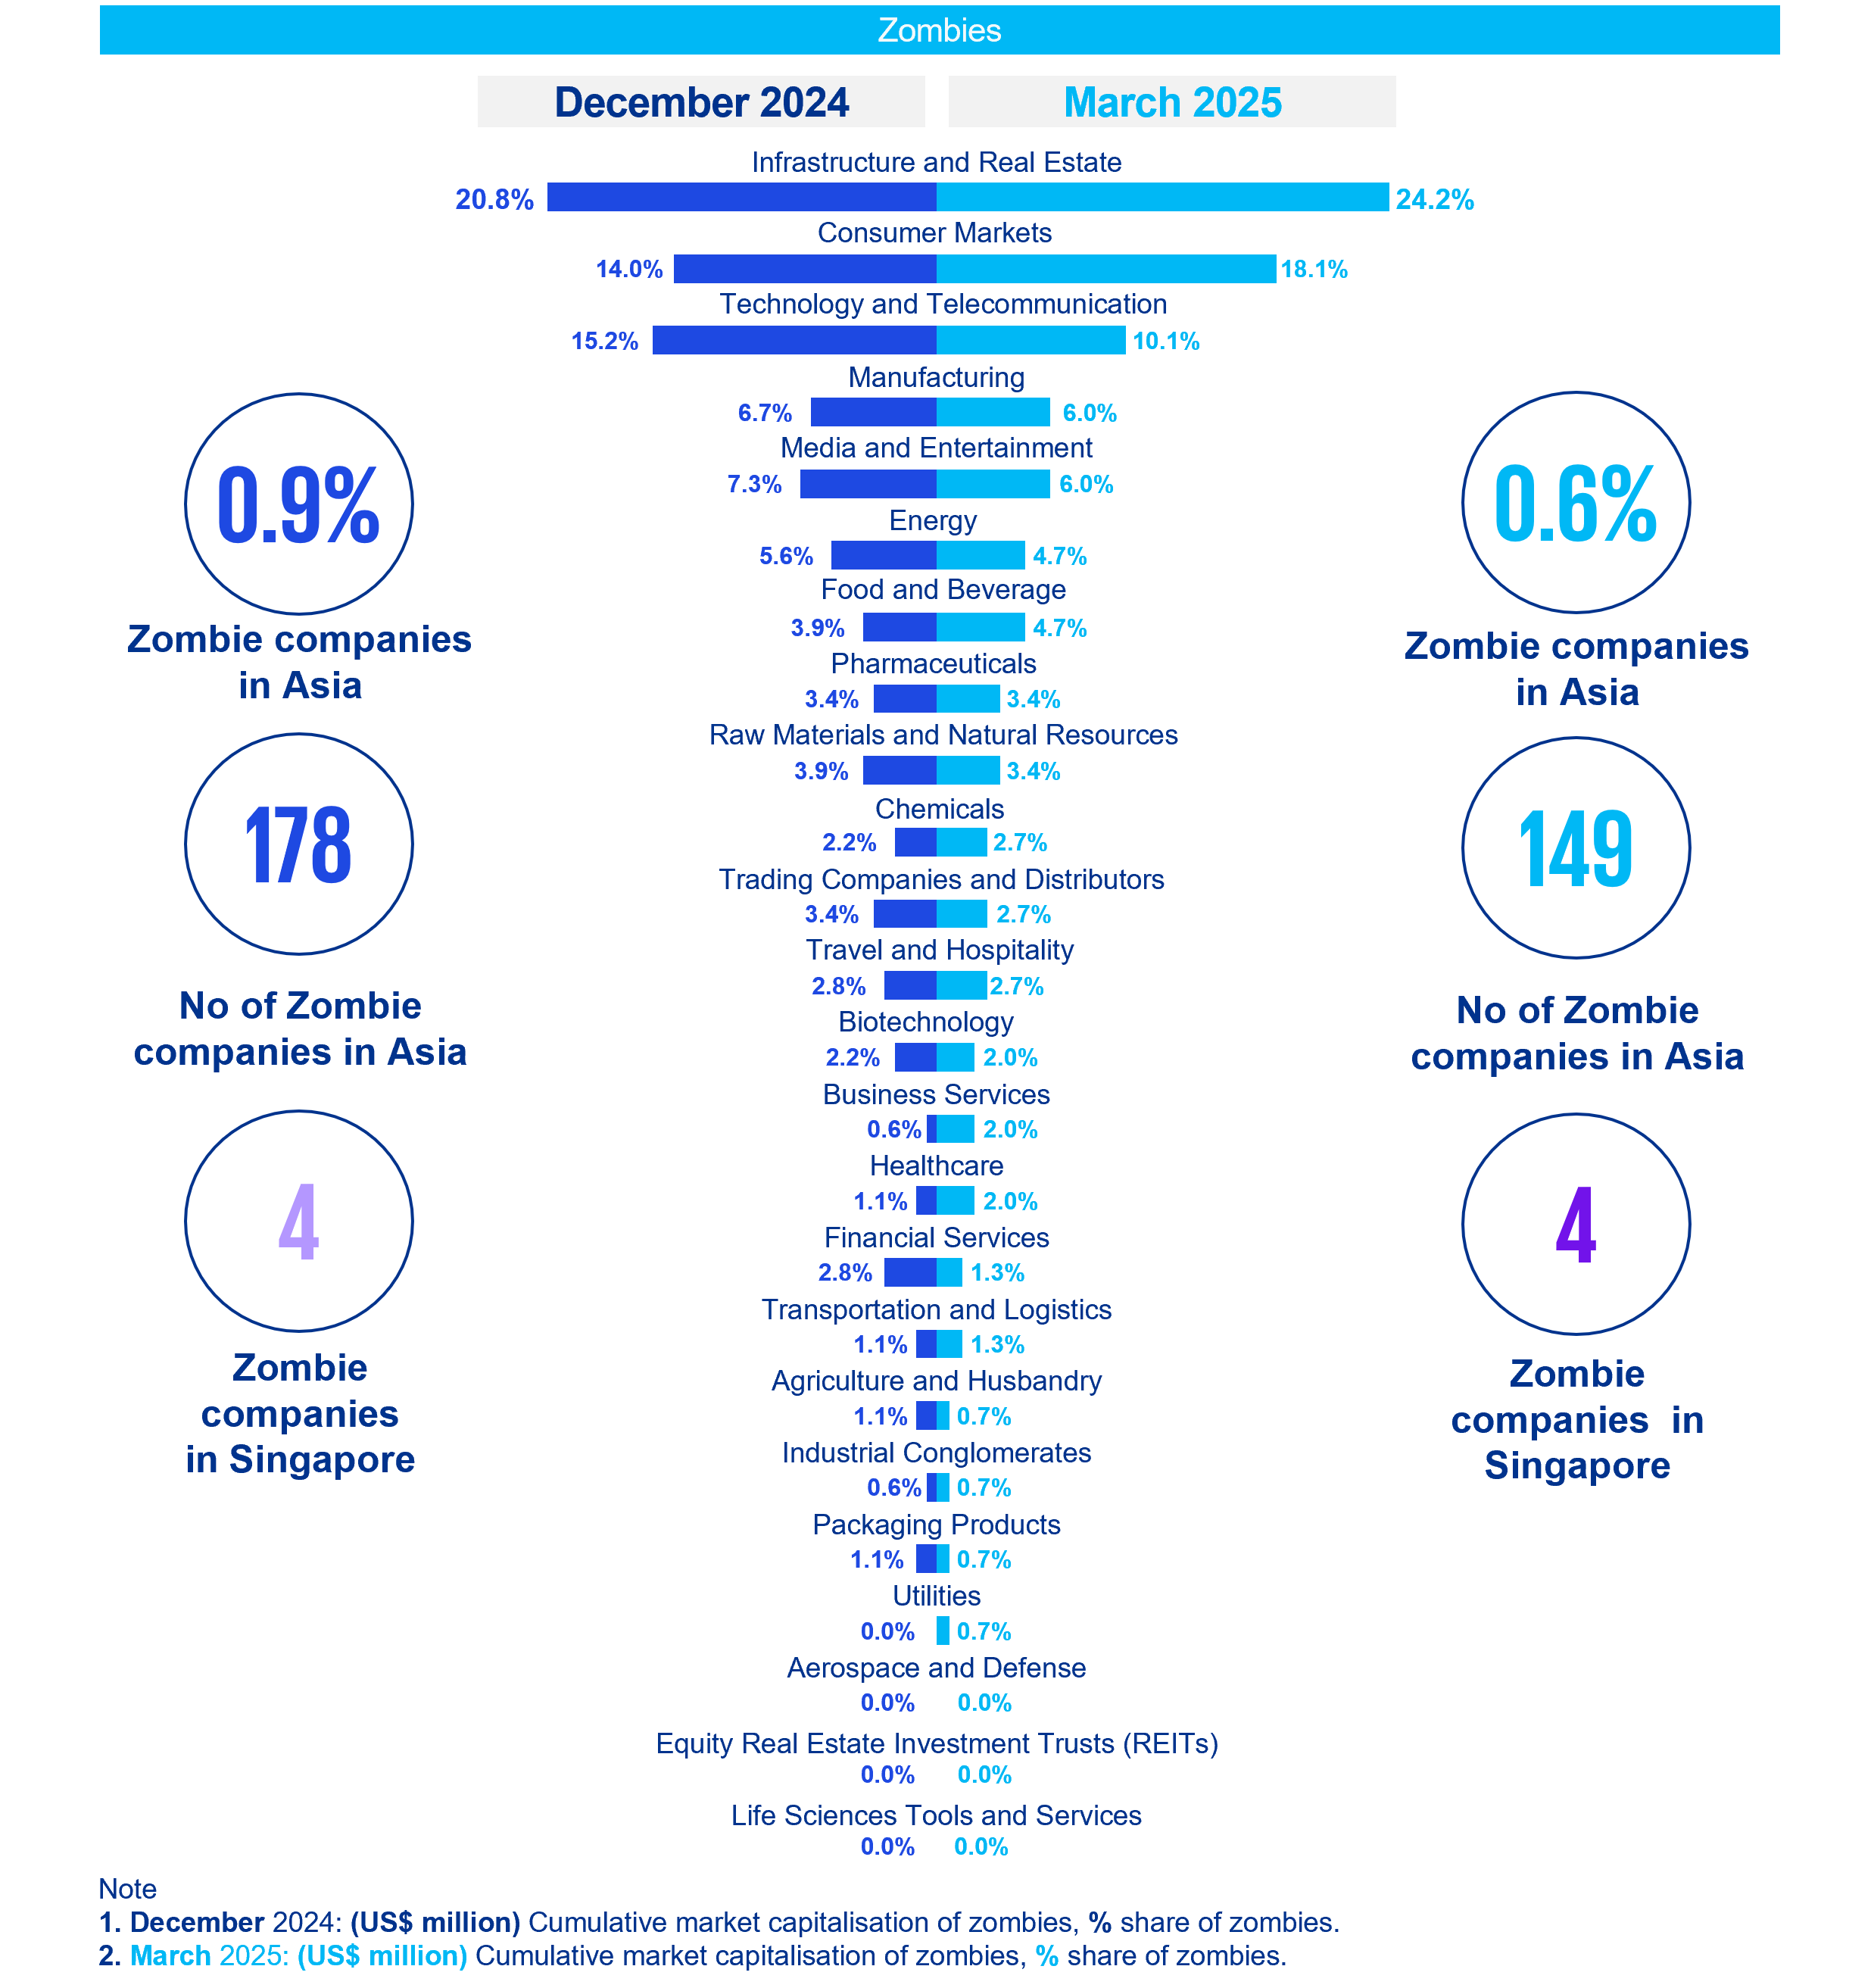
- The number of zombie companies in Singapore stayed consistent at 4 in both 4Q24 and 1Q25, while the Asian trend showcased a fall in the zombie companies from 178 in 4Q24 to 149 in 1Q25. Consumer Market and Technology & Telecommunication are the only two sectors containing zombie numbers in Singapore for the current quarter.
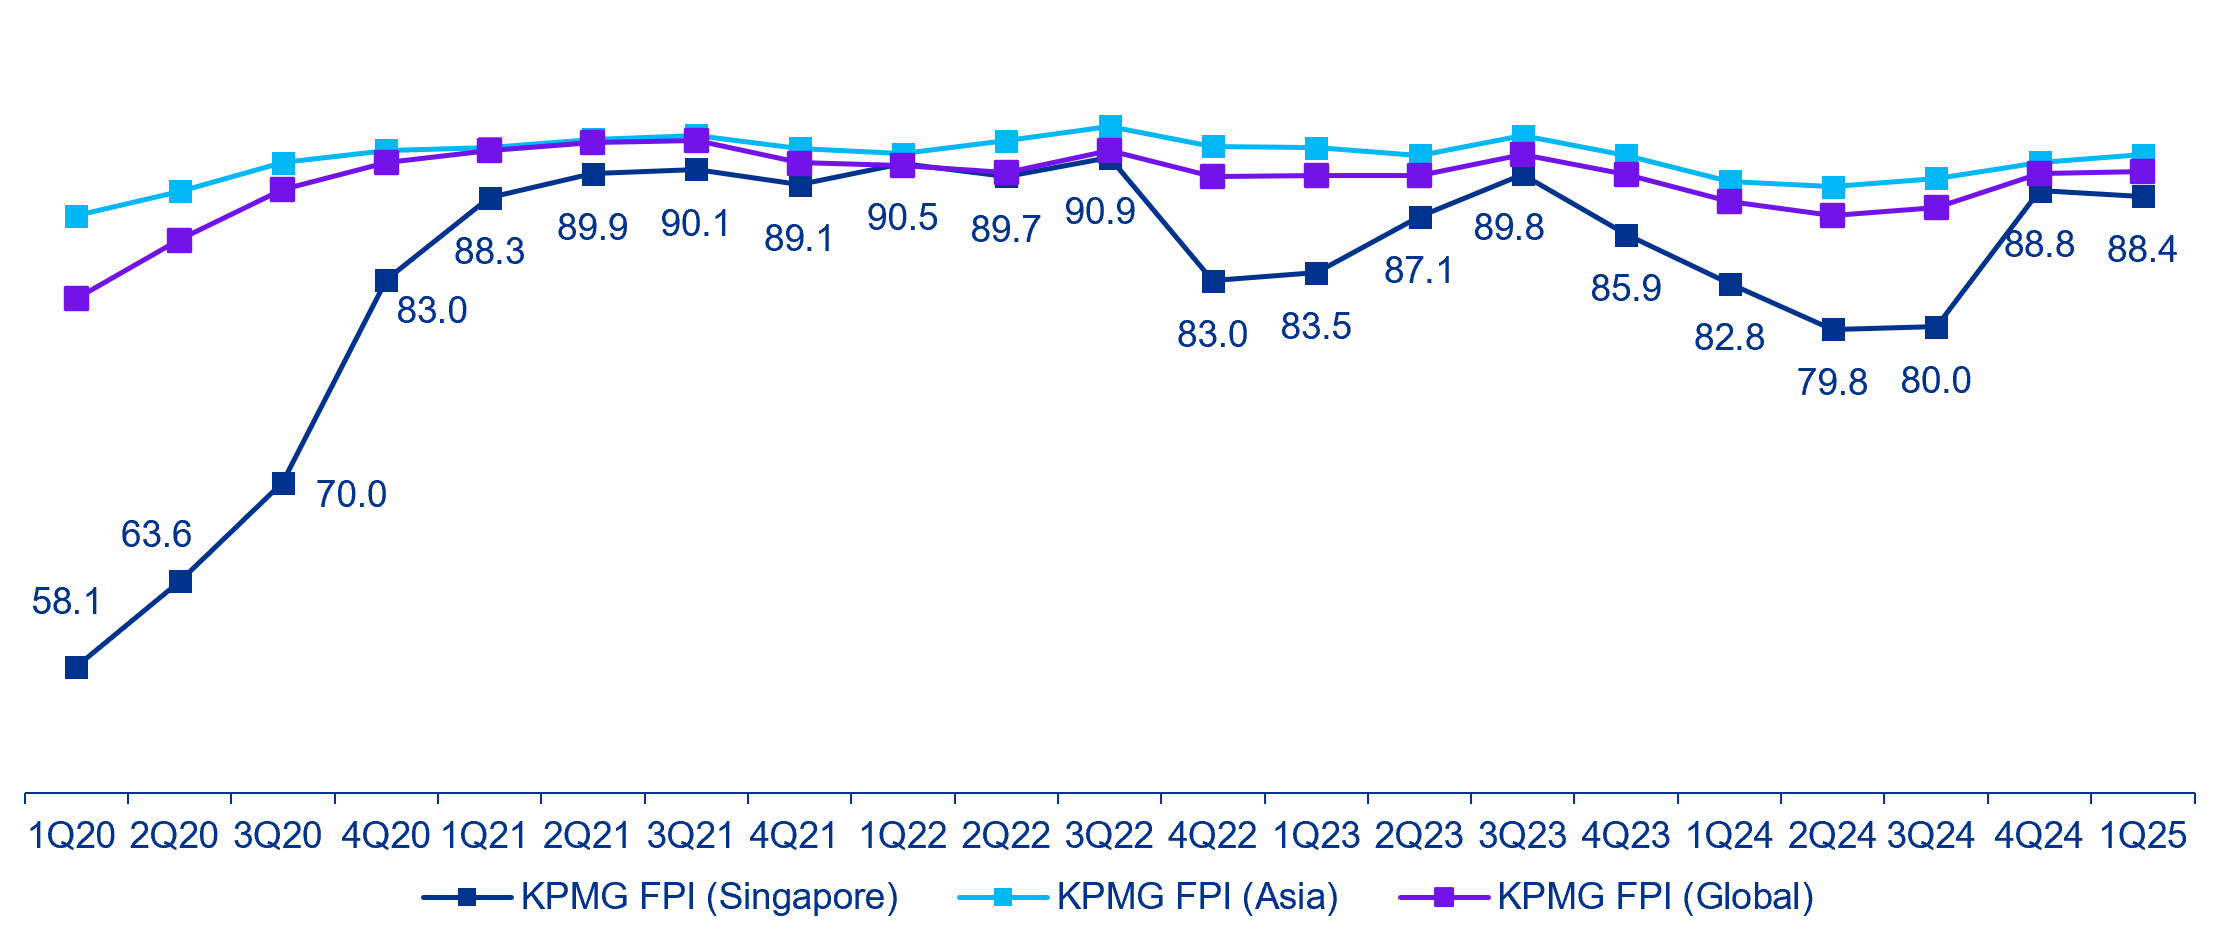
Historic FPI movement of Singapore with respect to Asia and Global trends
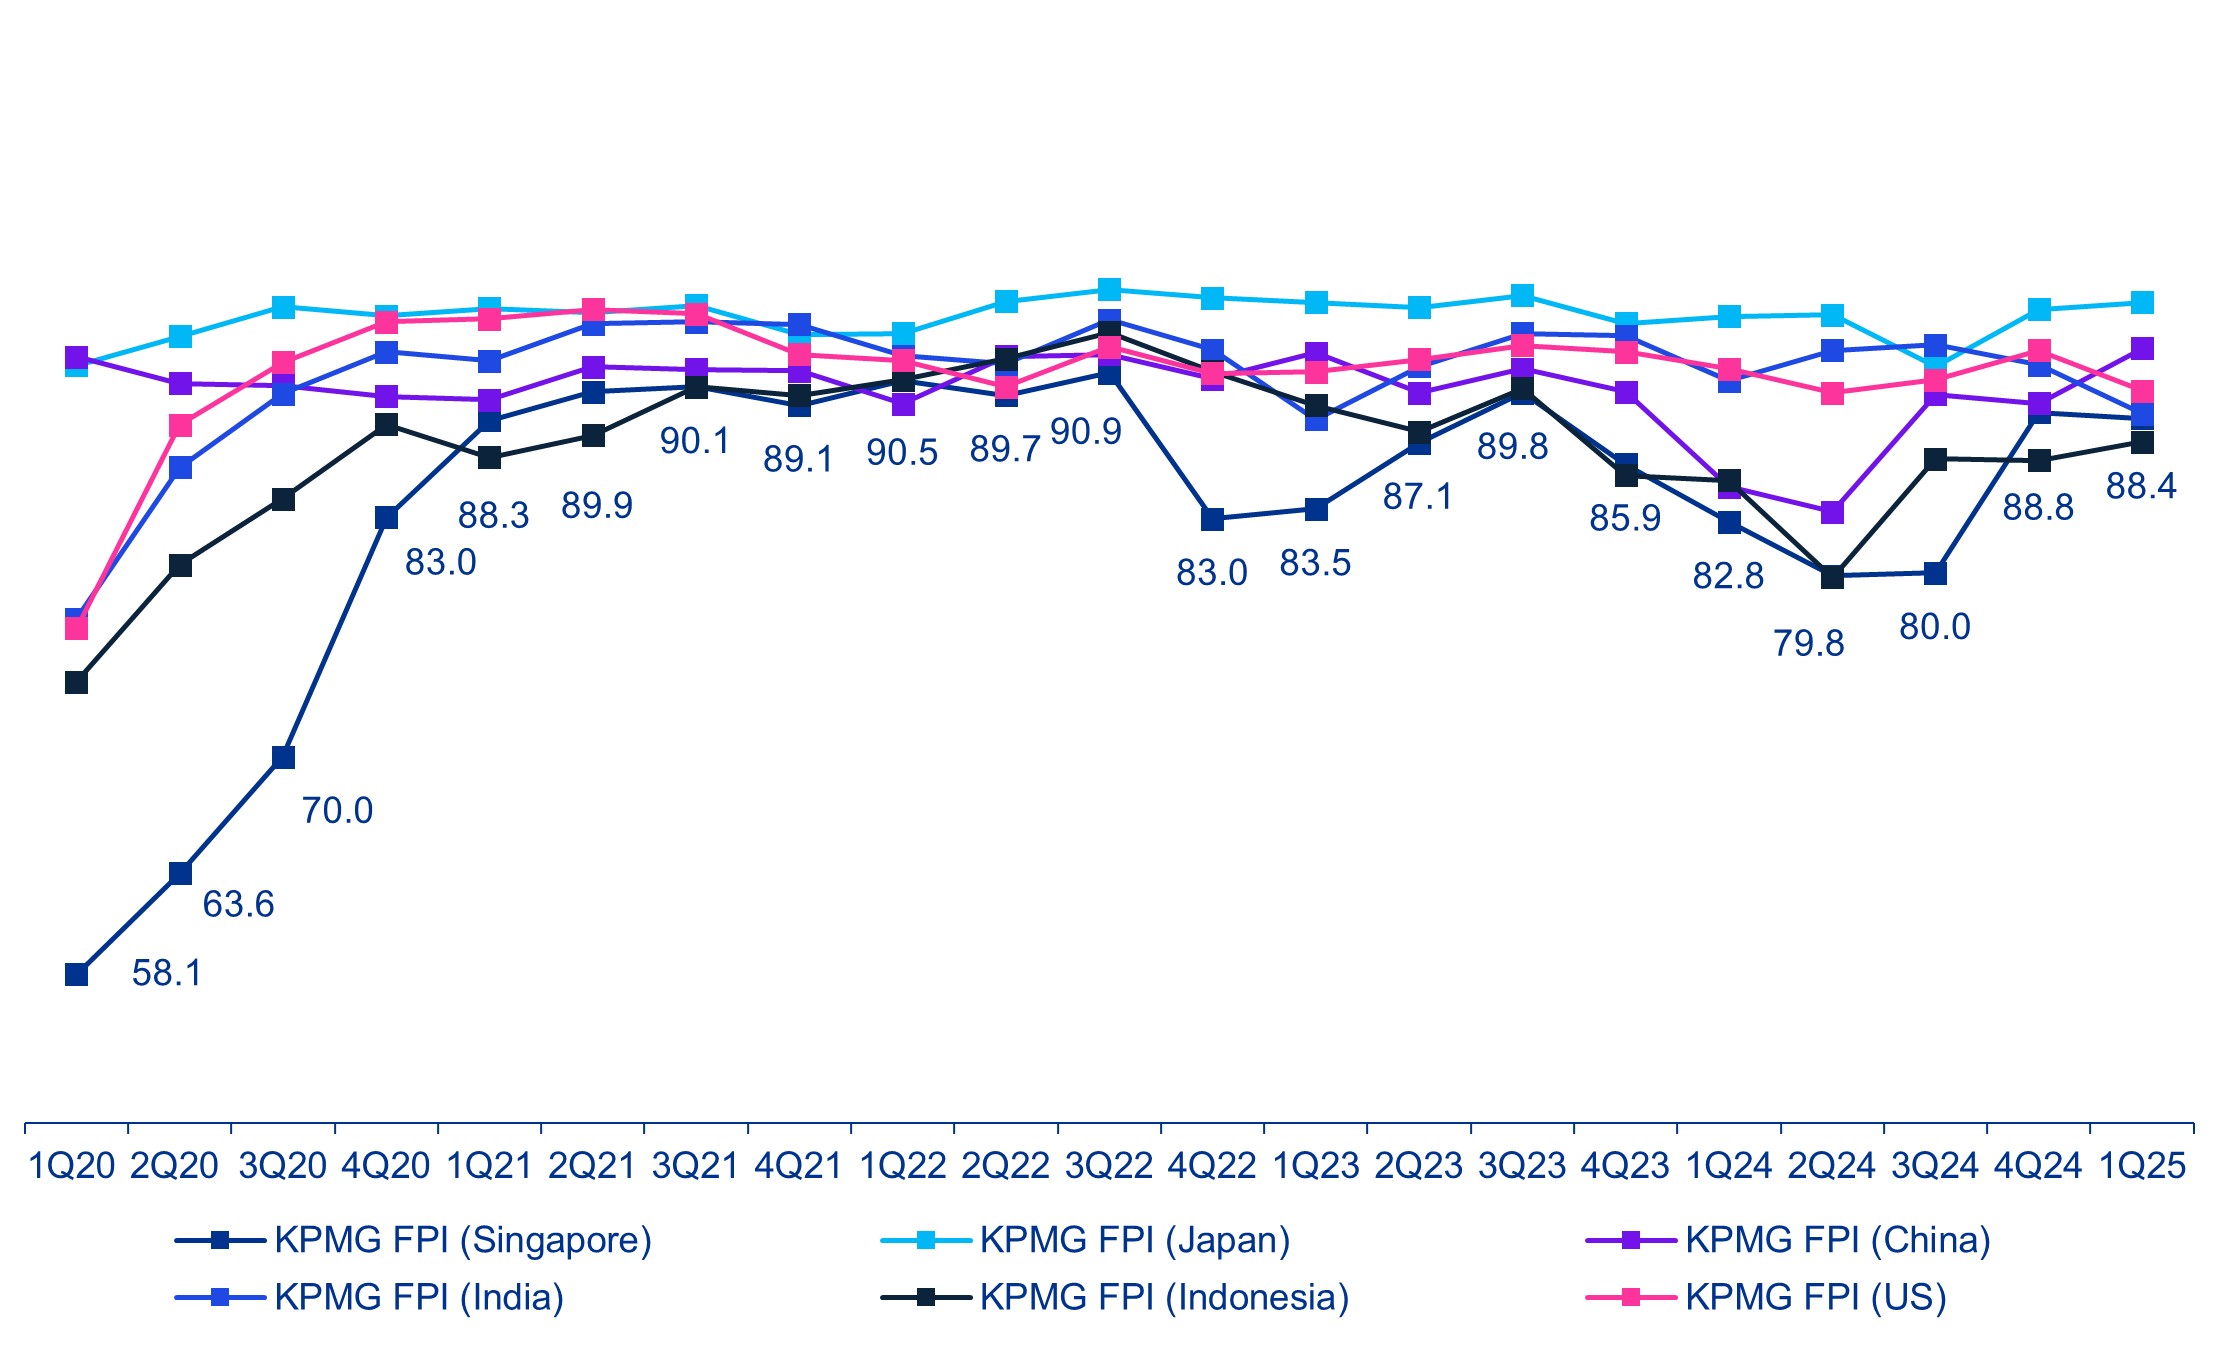
Historic FPI movement of Singapore with respect to India, Japan, China, Indonesia, and US
Sector movers
- Singapore's FPI score experienced a slight dip of 0.4 points, reaching 88.4 in Q1 2025. This adjustment reflects a broader trend, with 11 out of 17 sectors recording decreases in their individual FPI scores.
- Out of the sectors, Travel and Hospitality experienced a 3.7% rise (to an FPI score of 97.0), followed by Transportation and Logistics which registered a 3.2% rise (to an FPI score of 94.9). However, Energy witnessed the steepest decline, with FPI scores dropping by 8.5% (to an FPI score of 87.1).
- The Travel and Hospitality sector see strong momentum with FPI score rising from 93.5 in 4Q24 to 97.0 in 1Q25. The country expects 16 million visitors in 2025—9.6% above pre-COVID levels. Tourism receipts are projected to grow from SGD22.4 billion in 2024 to SGD30.5 billion in 2025, driven by better air links, visa waivers, and its appeal as a long-haul stopover.
- Transportation and Logistics sector’s FPI score rose from 92.0 in 4Q24 to 94.9 in 1Q25, with Y-o-Y growth accelerating from 3.7% to 5.2%. This was driven by increased passenger traffic, consistent demand for air travel and cargo services, and in water transport, reflecting higher container passing through Singapore's ports.
- Energy sector witnessed the steepest decline with FPI scores dropping from 95.3 in 4Q24 to 87.1 in 1Q25. Singapore, lacking native hydrocarbon resources, seeks to import up to 6 Gigawatt of low-carbon electricity annually by 2035. Agreements for 5.6 Gigawatt with Indonesia, Vietnam, and Cambodia begin in 2028; a 2-Gigawatt deal from Australia is anticipated in the early 2030s. These efforts aim to diversify energy sources and strengthen regional alliances. (EIU database, source in comments).
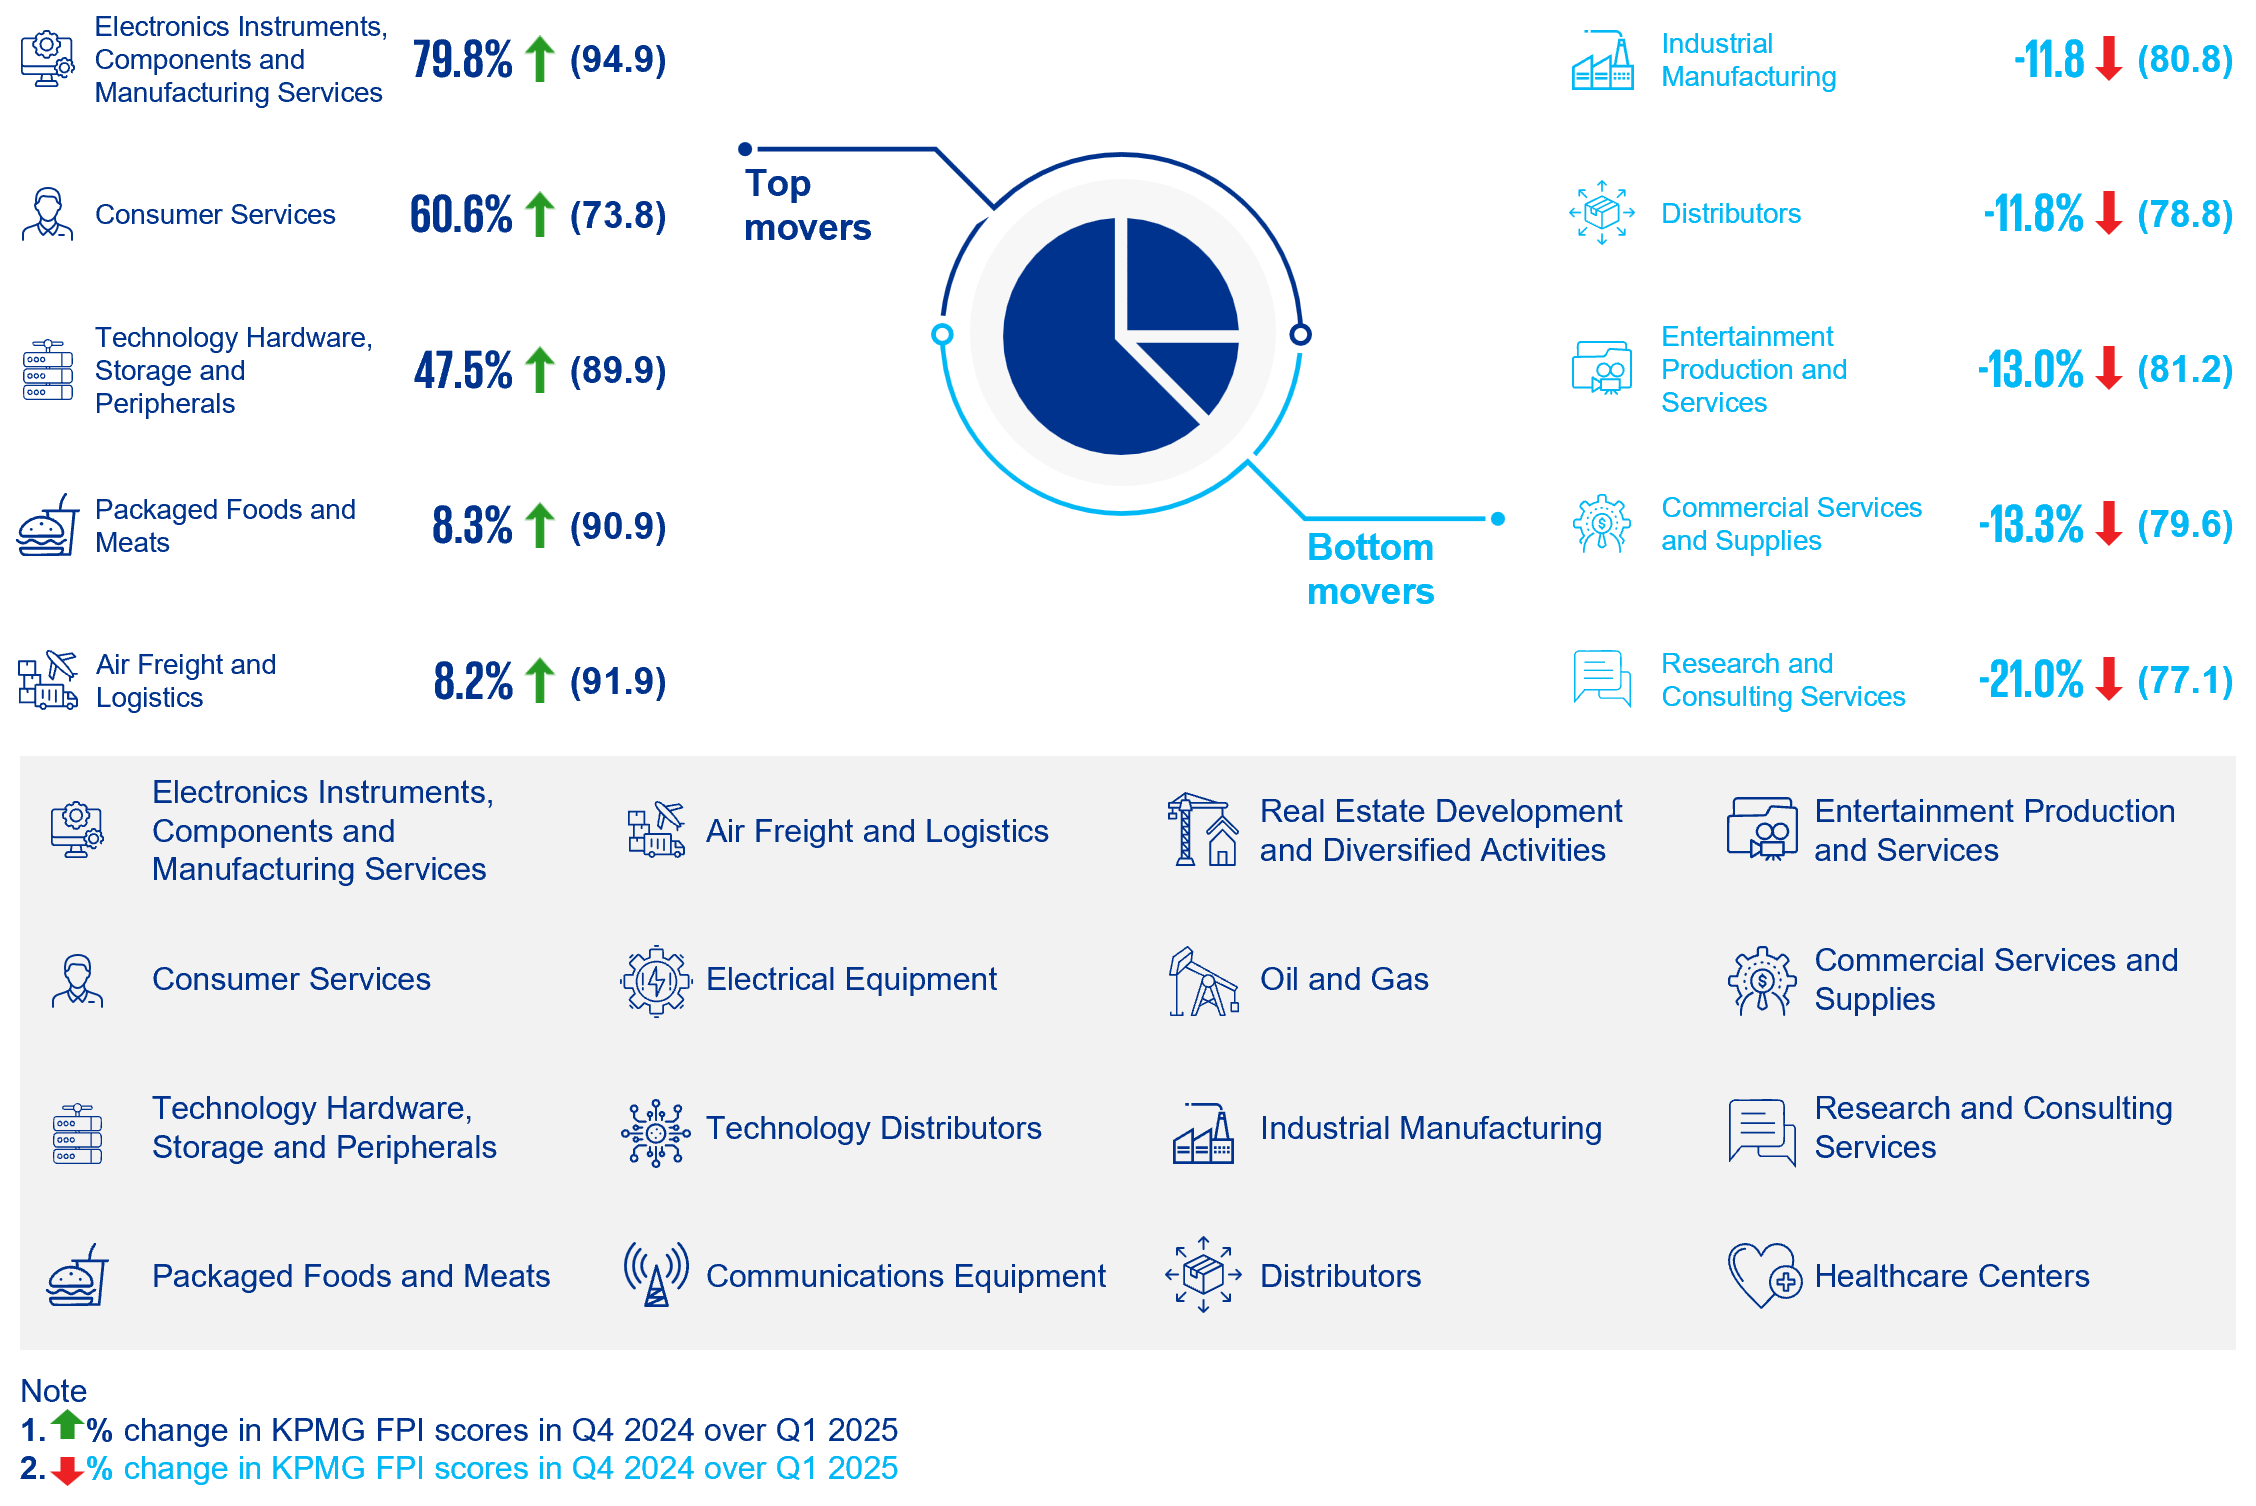
- During 4Q24 to 1Q25, among 78 sub-sectors, 21 experienced growth, 14 showed a negative trend, and 1 remained neutral. Notably, 5 sub-sectors with negative trends reported FPI scores below 85, averaging 79.5, reflecting a slight decline in economic financial health.
- The recent downturn in the bottom five sub-sector has been primarily driven by small-cap companies, whose FPI scores have declined significantly. This decline is largely attributed to a rise in total liabilities coupled with a reduction in net income, exerting downward pressure on the overall sub-sector performance.
From December 2024 to March 2025
Strongest and weakest sector outperformers
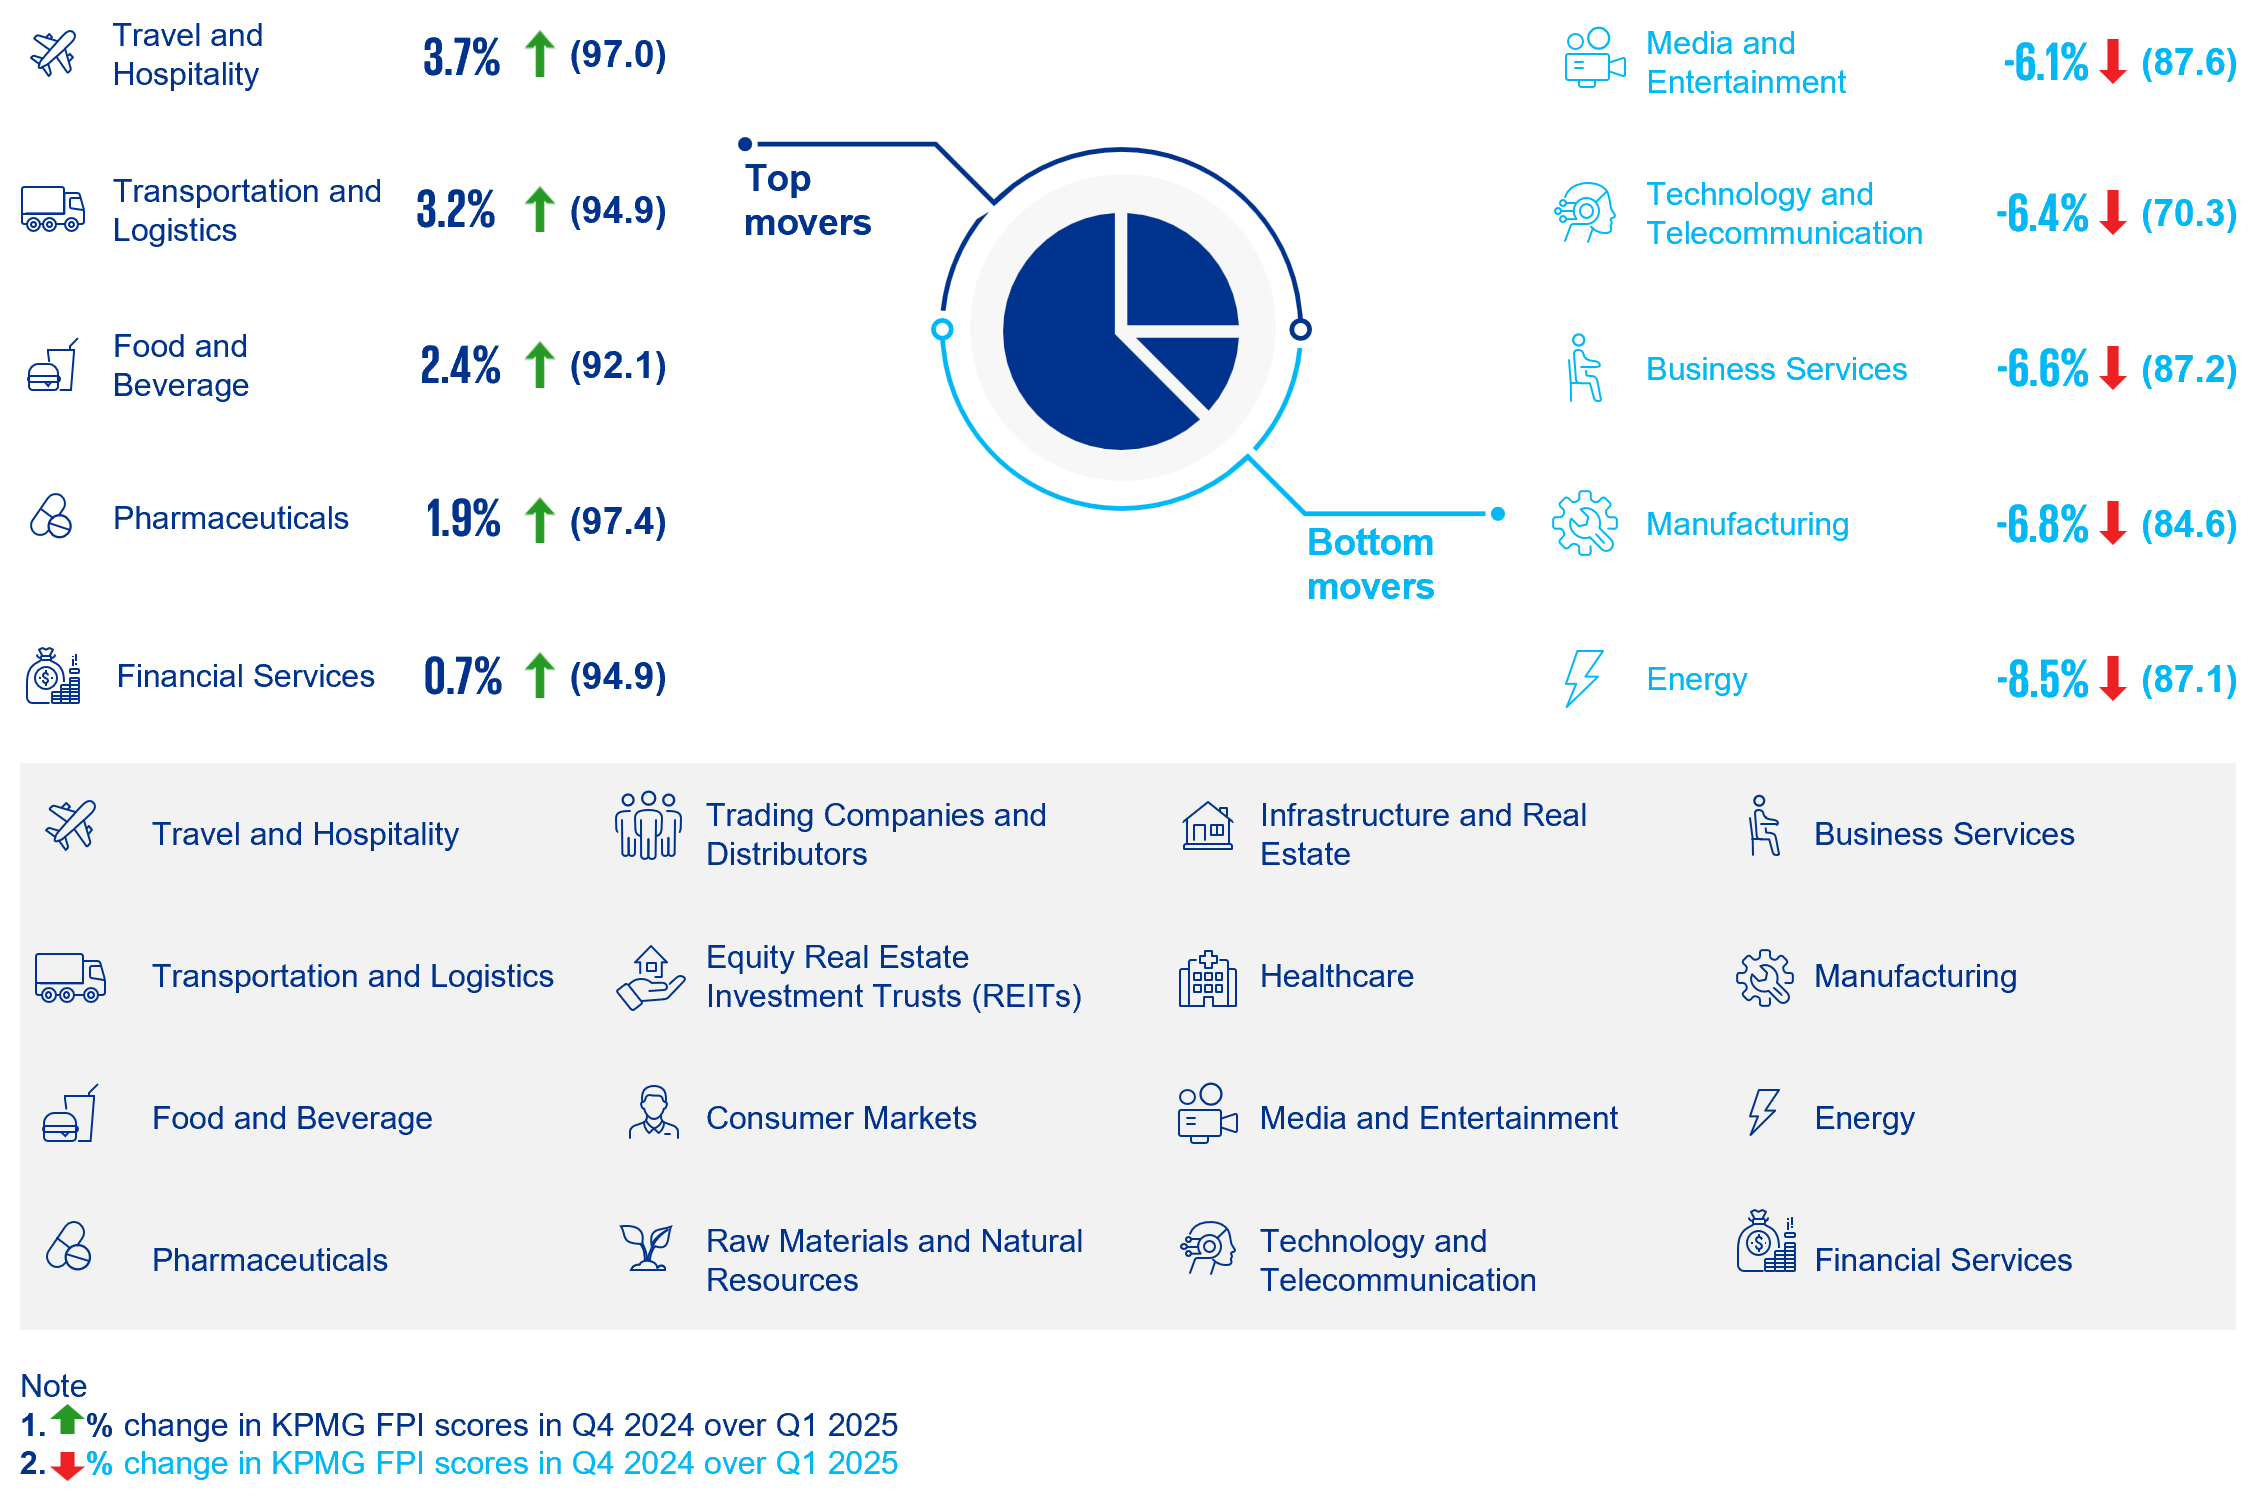
From December 2024 to March 2025
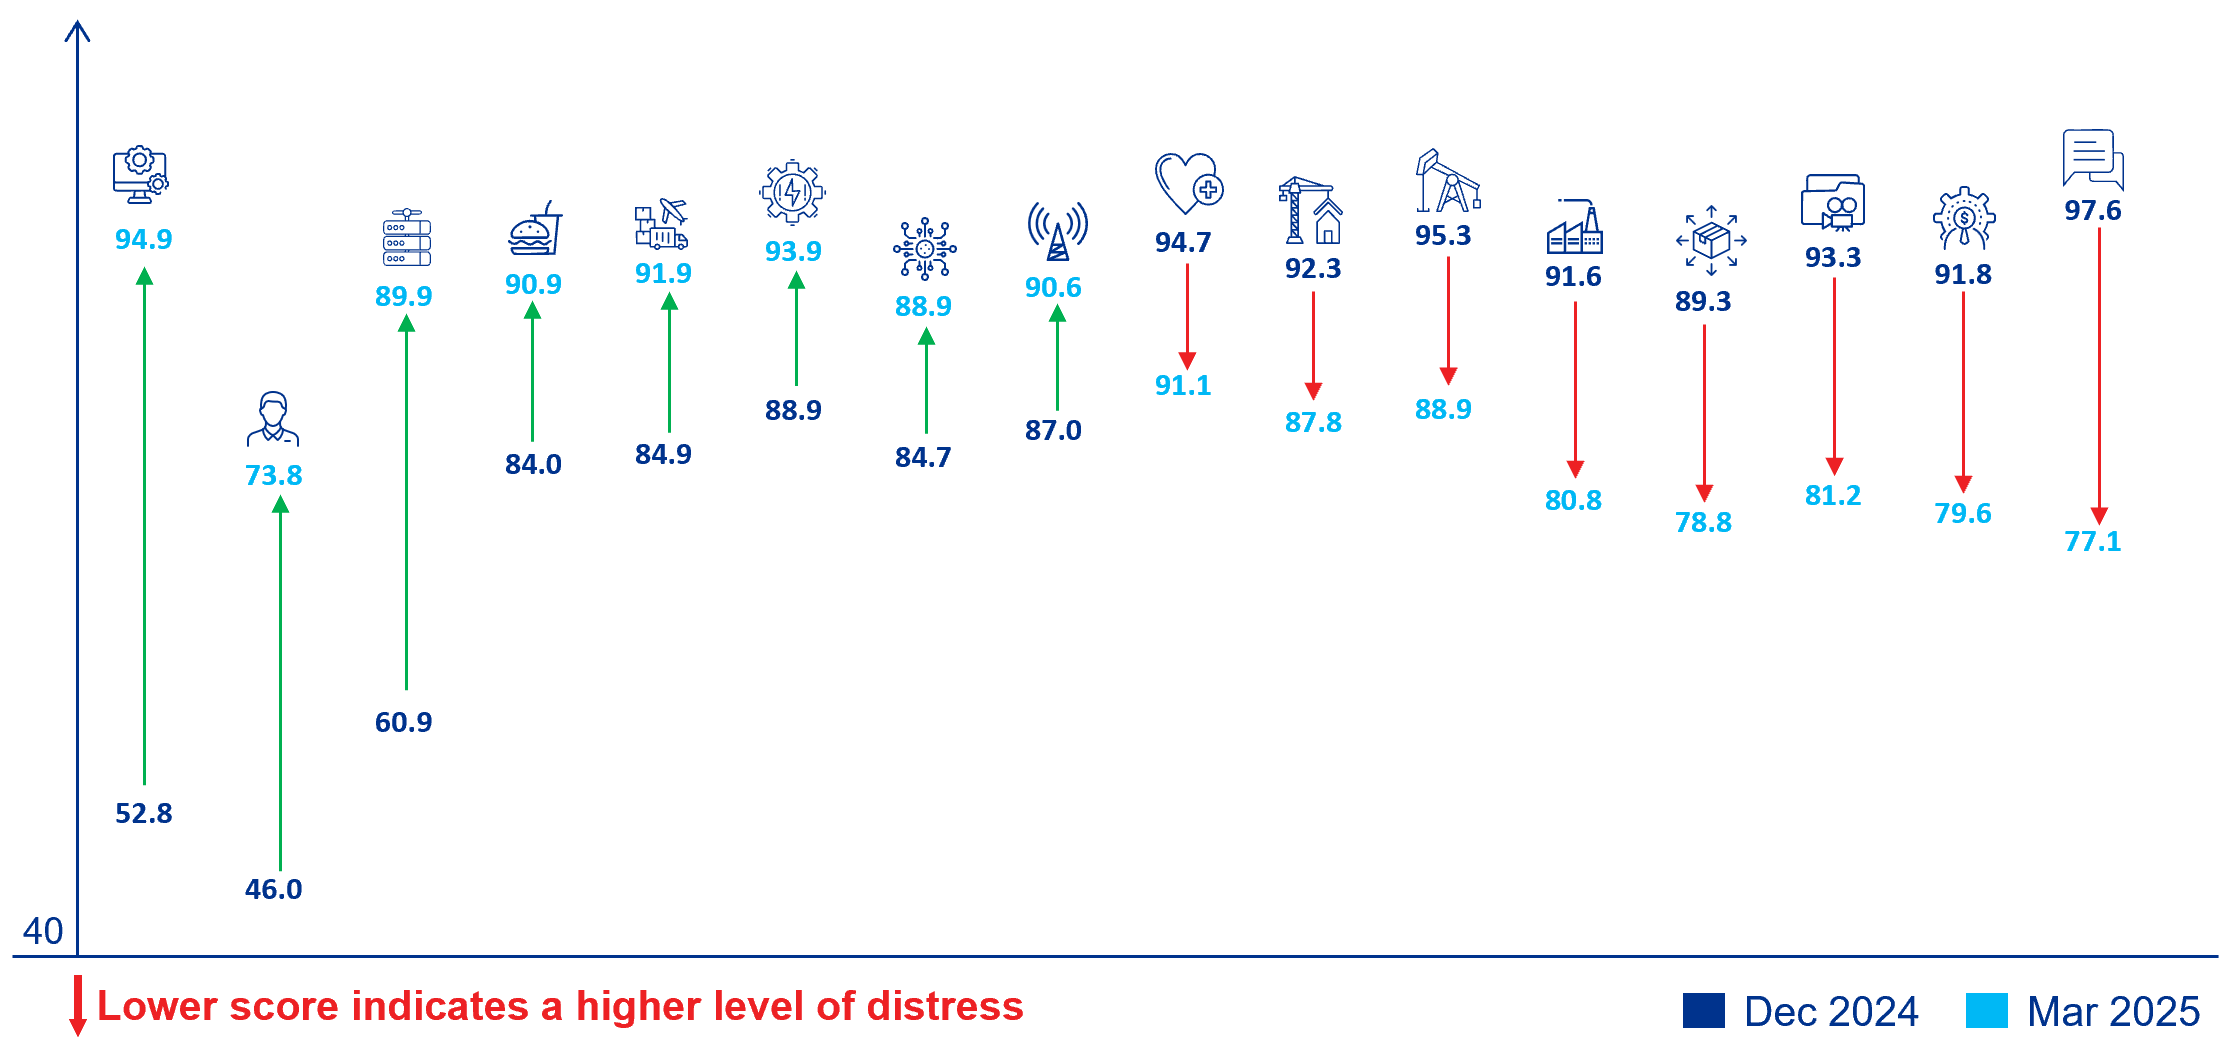
Strongest and weakest sub-sector outperformers
Singapore economy and landscape
- Singapore’s FPI score experienced a slight decline, easing from 88.8 in 4Q24 to 88.4 in 1Q25. During the same period, the economy grew by 3.9% year-on-year, marking a moderation from the 5.0% expansion recorded in the previous quarter.
- Despite a marginal decline in its FPI score, resulting in a bottom quartile ranking among Asian economies, Singapore continues to outperform several regional peers, including the Philippines, Indonesia, Malaysia, and Hong Kong SAR.
- External trade showed notable strength, with exports of goods and services rising by 5.5% Y-o-Y, making it the highest growth since 2Q24—driven by continued front-loading of shipments ahead of the paused U.S. “reciprocal” tariffs. Imports also gained momentum, increasing by 5.3% in 1Q25, as compared to 3.8% in the previous quarter.
- Government consumption declined by 8.3% Y-o-Y in 1Q25, following a significant 16.2% surge in 4Q24, largely due to a high base effect. In contrast, household consumption strengthened, growing by 3.4% Y-o-Y, up from 2.2% in the previous quarter, supported by easing inflationary pressures.
- The Ministry of Trade and Industry has maintained its 2025 GDP growth forecast between 1.0% to 3.0% in response to global tariff developments. While recent efforts to ease trade tensions have slightly improved the external demand outlook, the broader environment remains uncertain and challenging.
- Consumer price inflation is anticipated to average 1.6% in 2025, with core inflation expected to trend below this level. This forecast stems from a confluence of factors: moderating global oil prices, reduced cost pressures from key trading partners, and the sustained strength of the Singapore dollar, which collectively helps mitigate imported inflationary pressures.
- Business Services
- Consumer Market
- Energy
- Financial Services
- Food and Beverage
- Healthcare
- Infrastructure and Real Estate
- Manufacturing
- Media and Entertainment
- Pharmaceutical
- Raw material and Natural Resources
- Technology and Telecommunication
- Trading Companies and Distributors
- Transportation and Logistic
- Travel and Hospitality
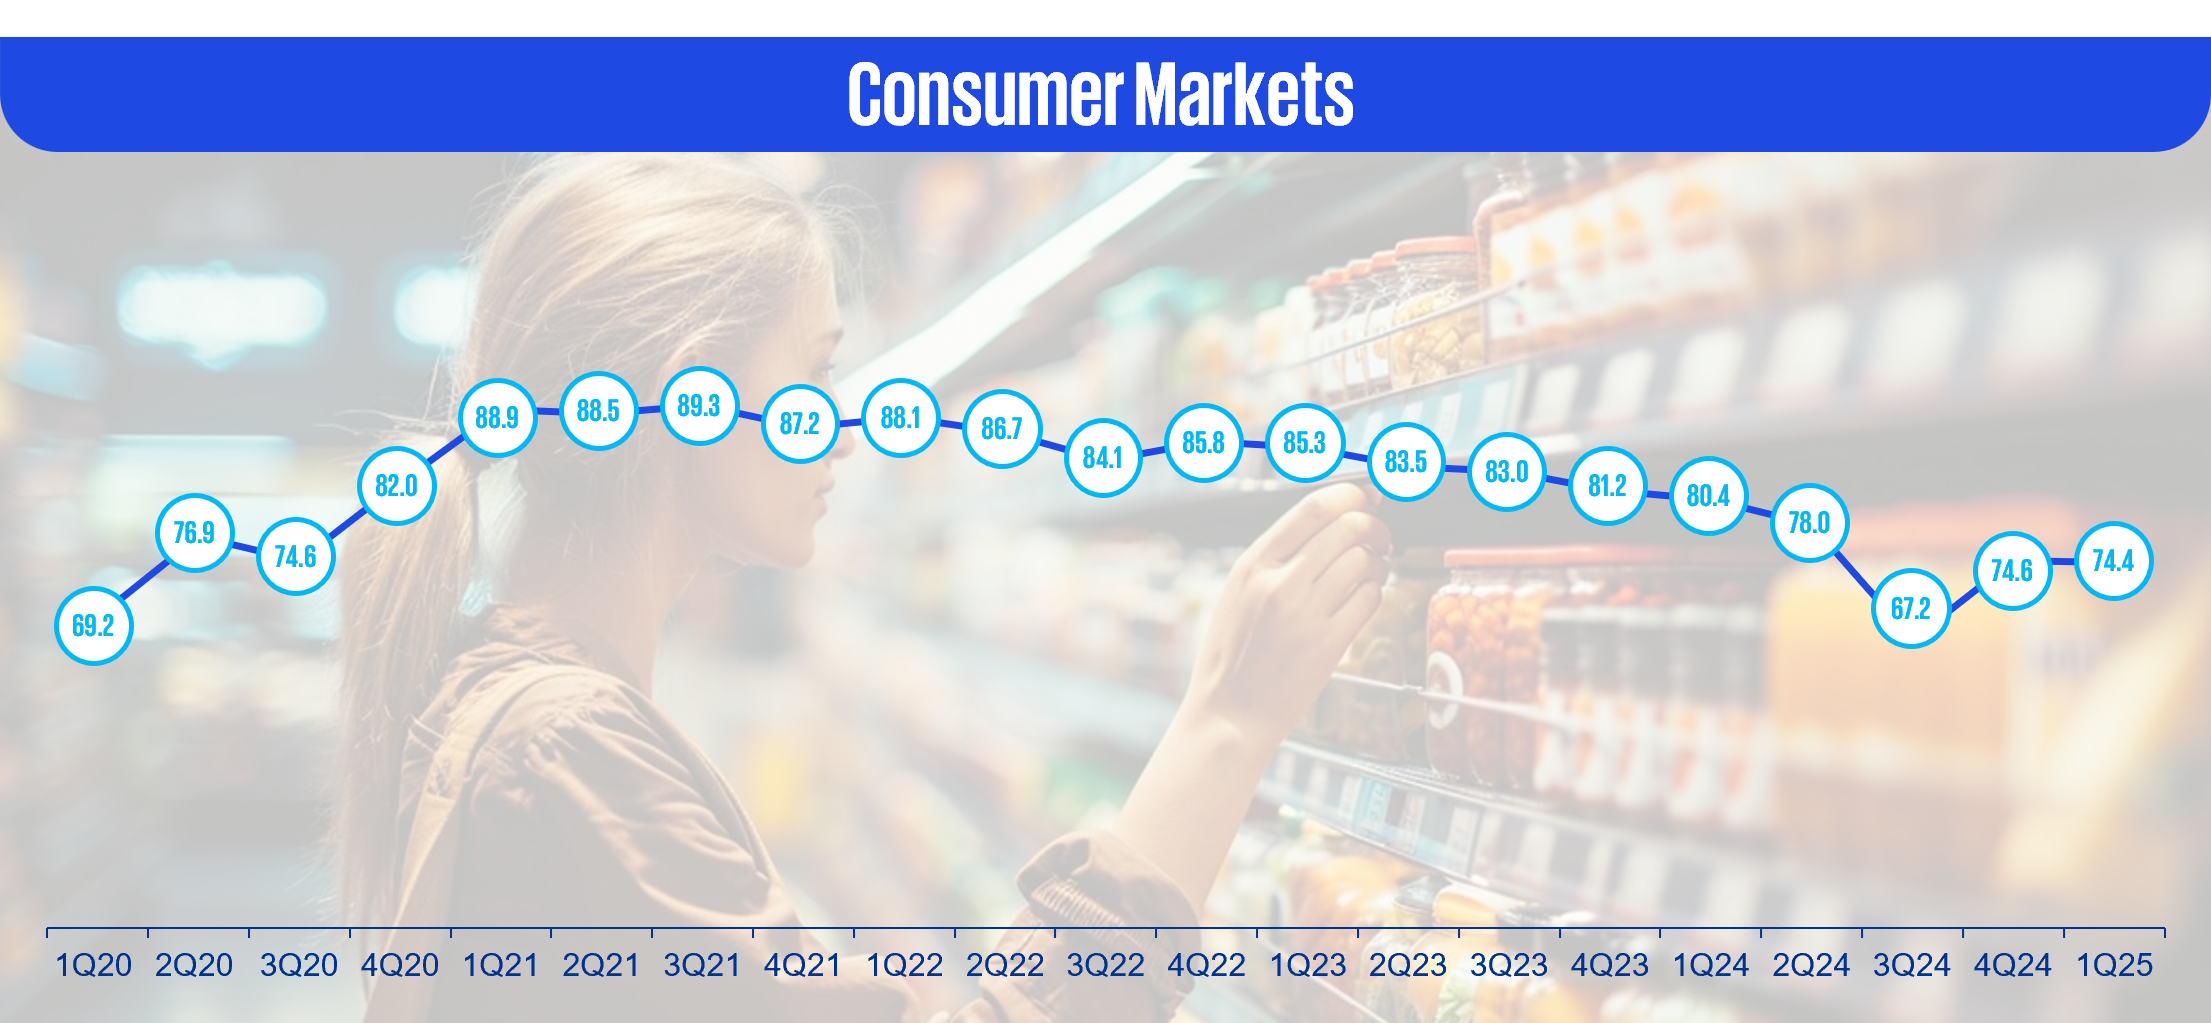
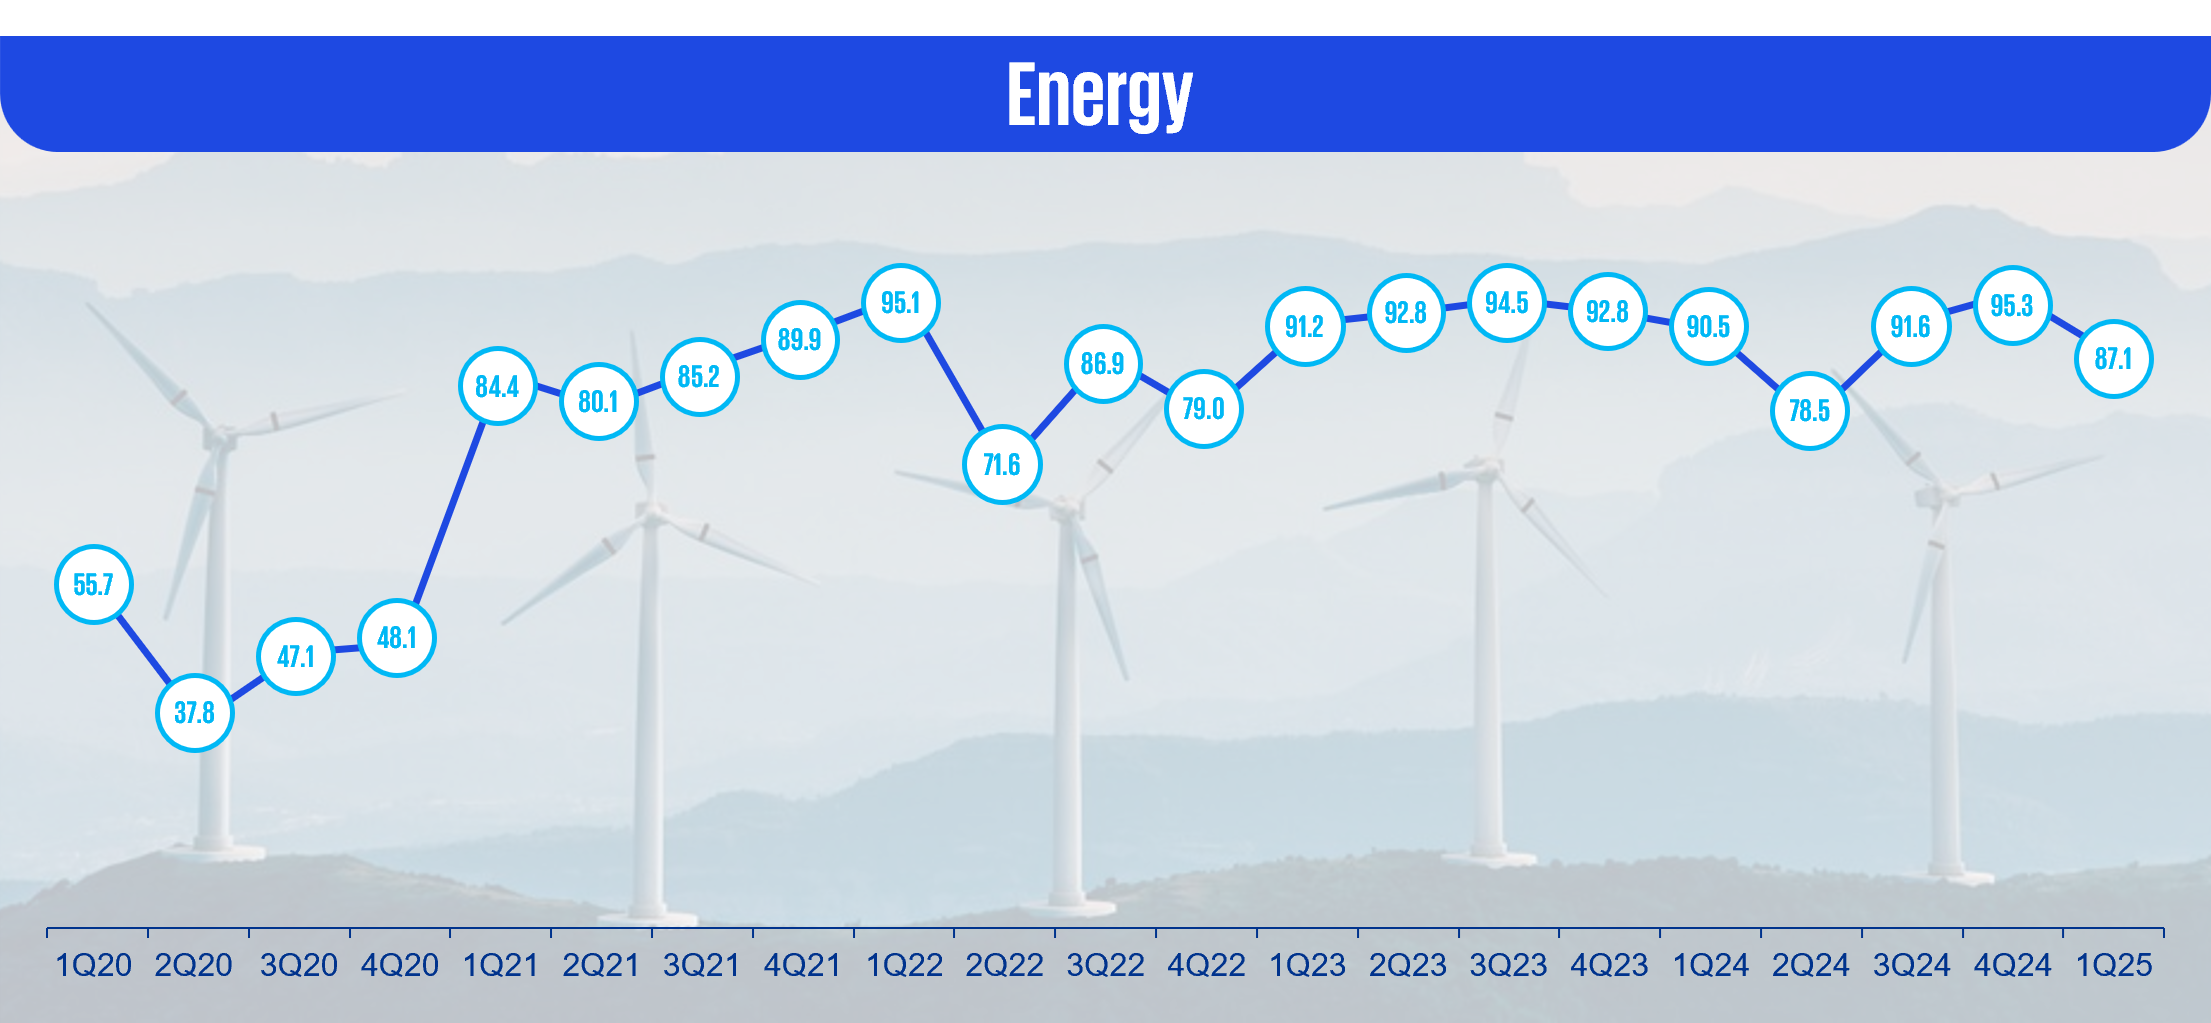
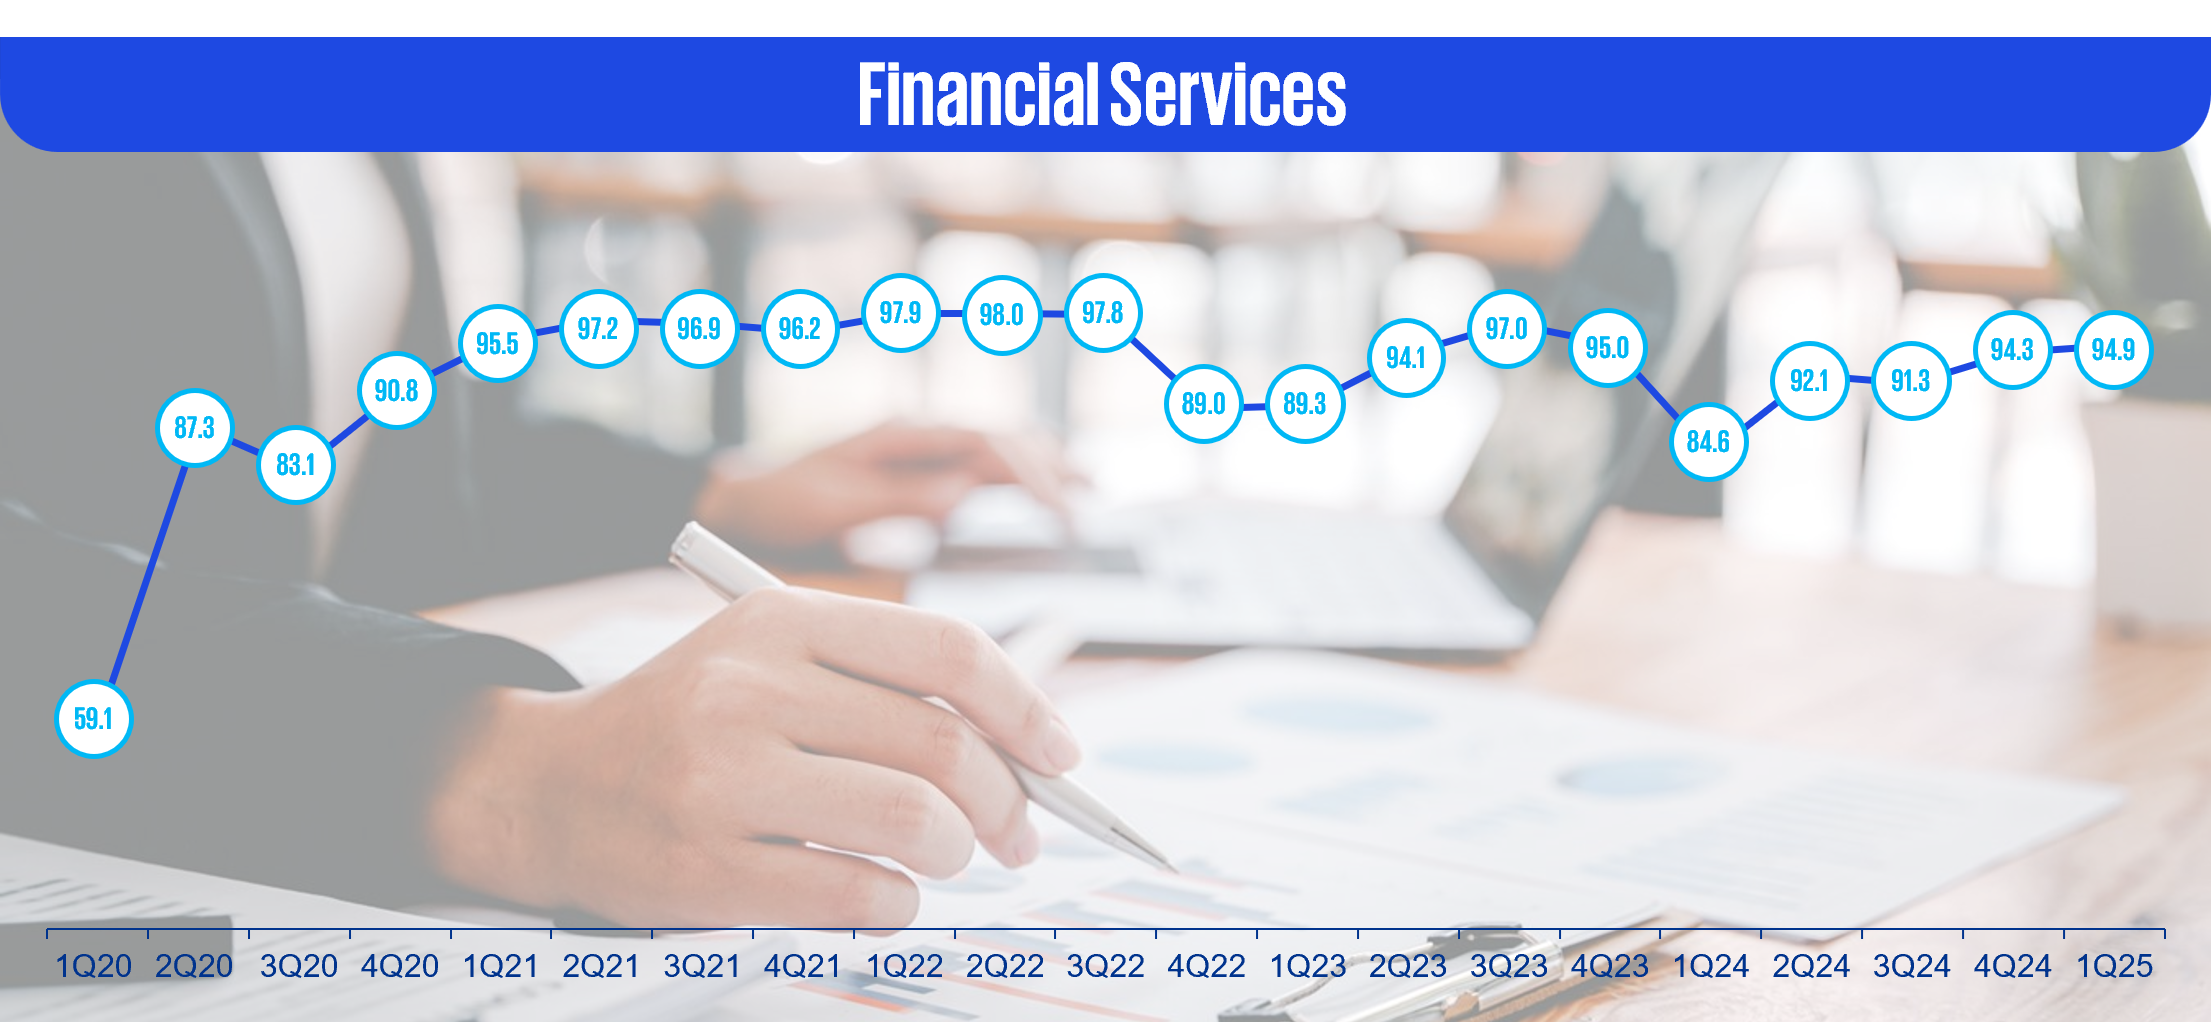
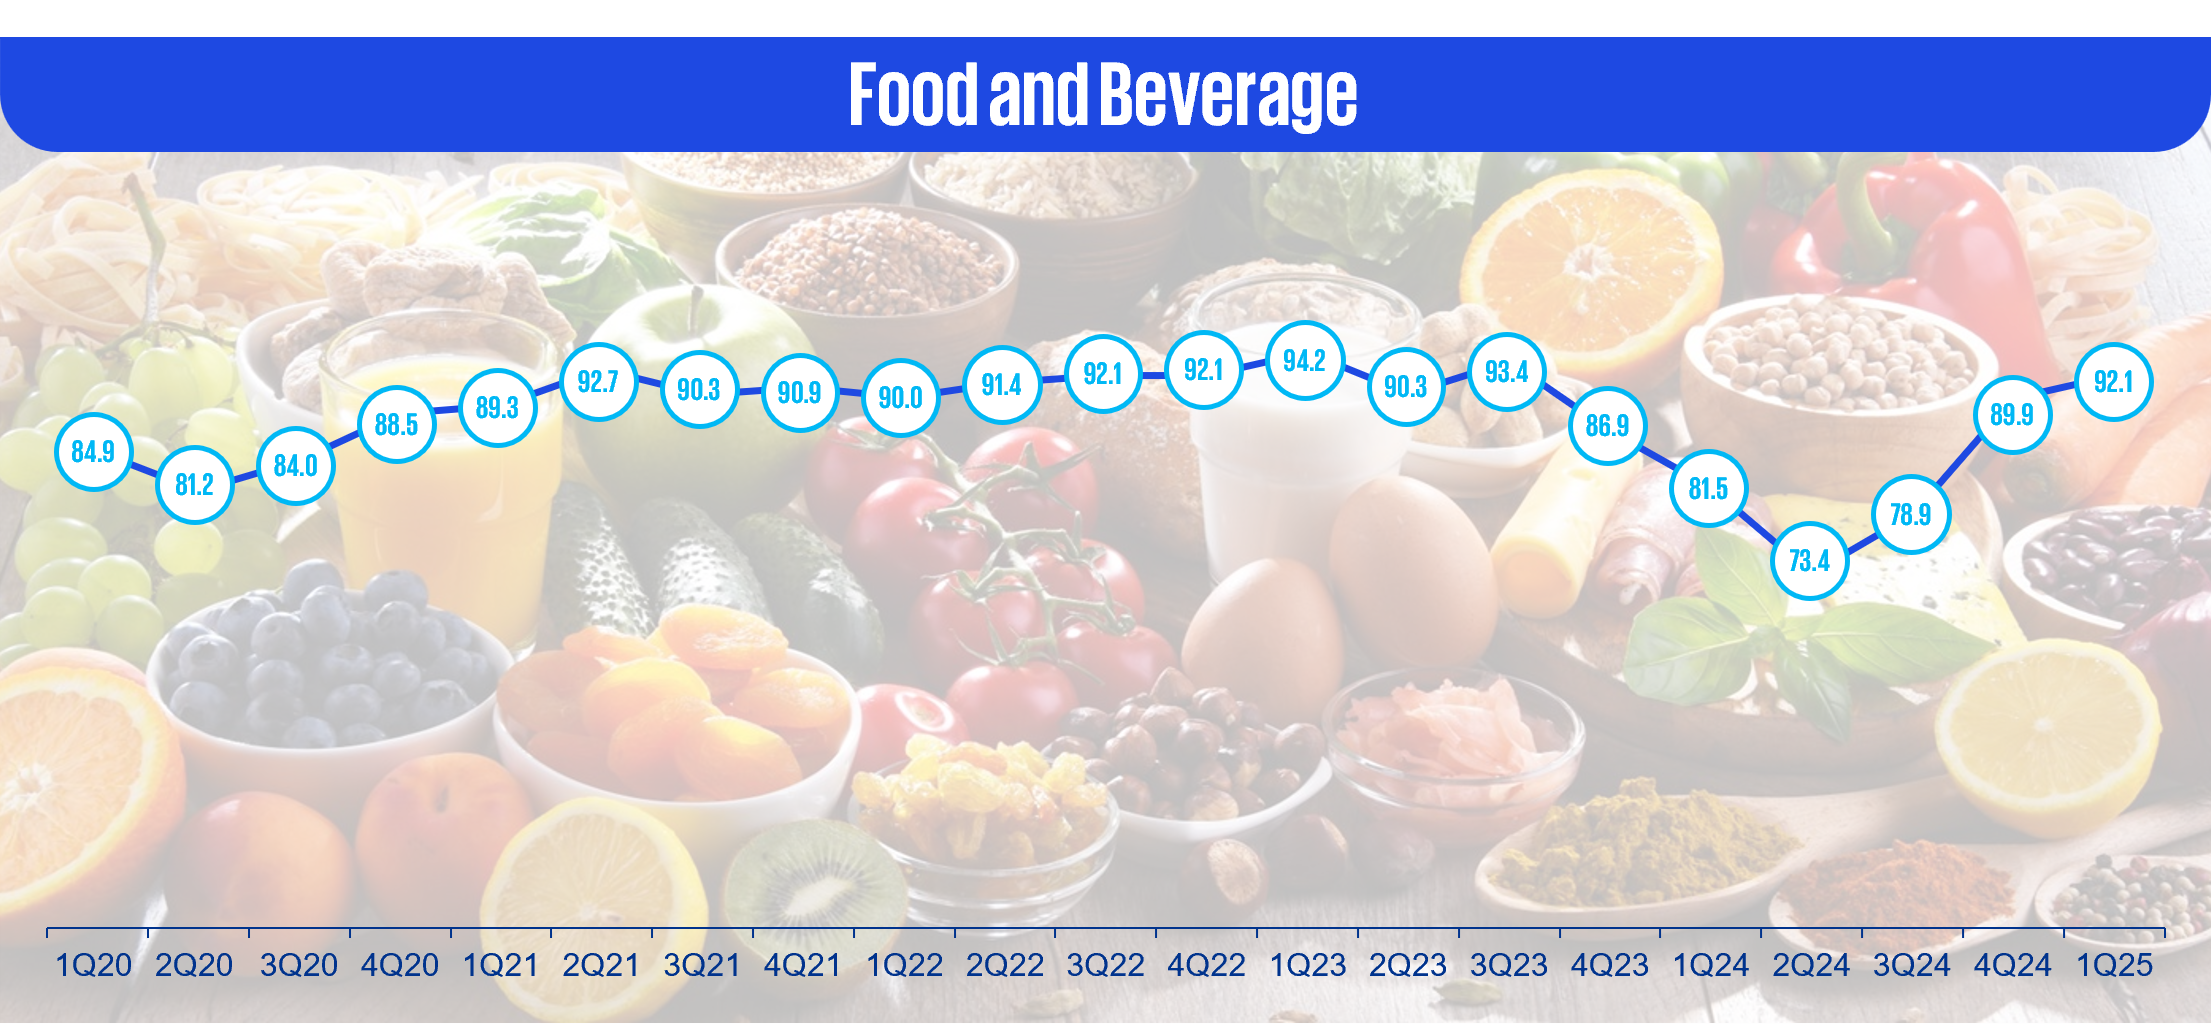
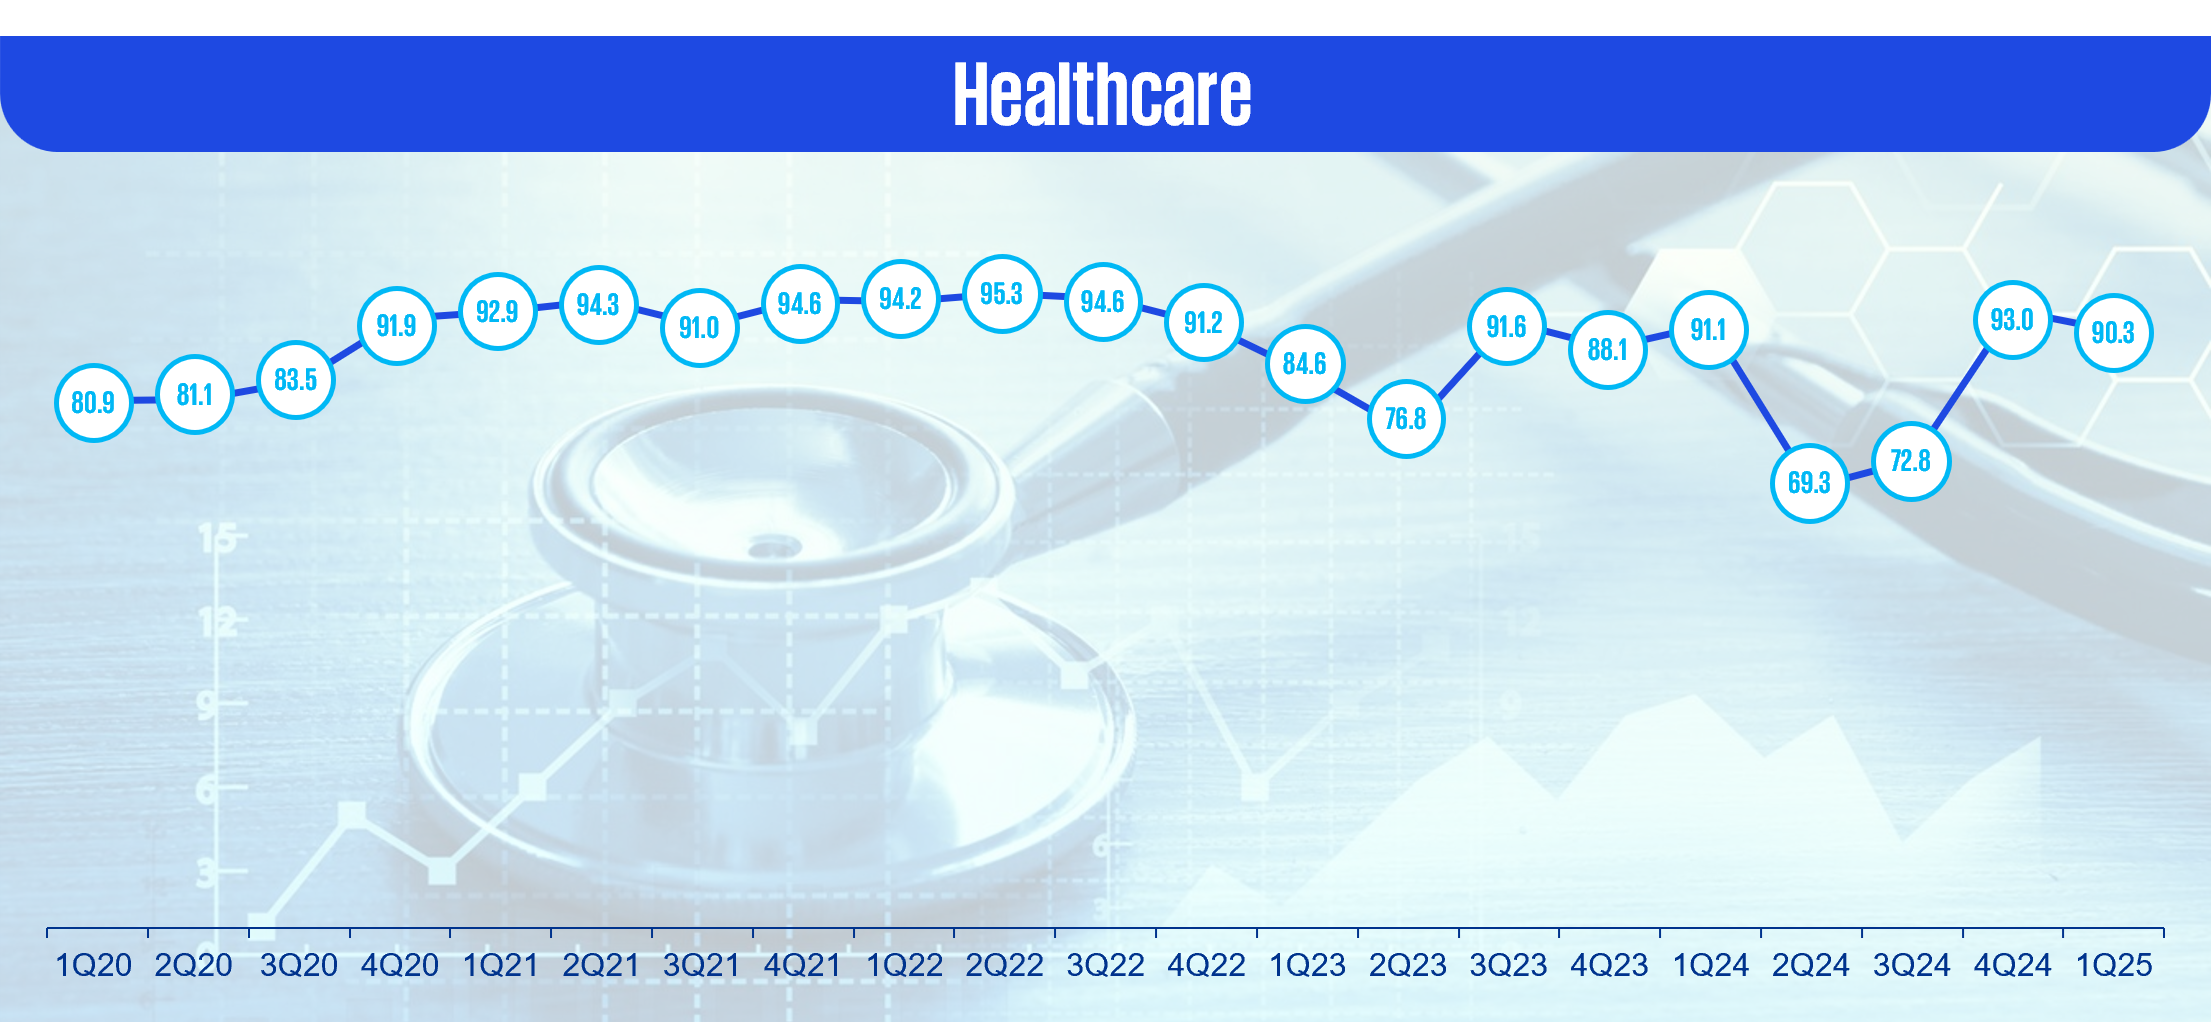
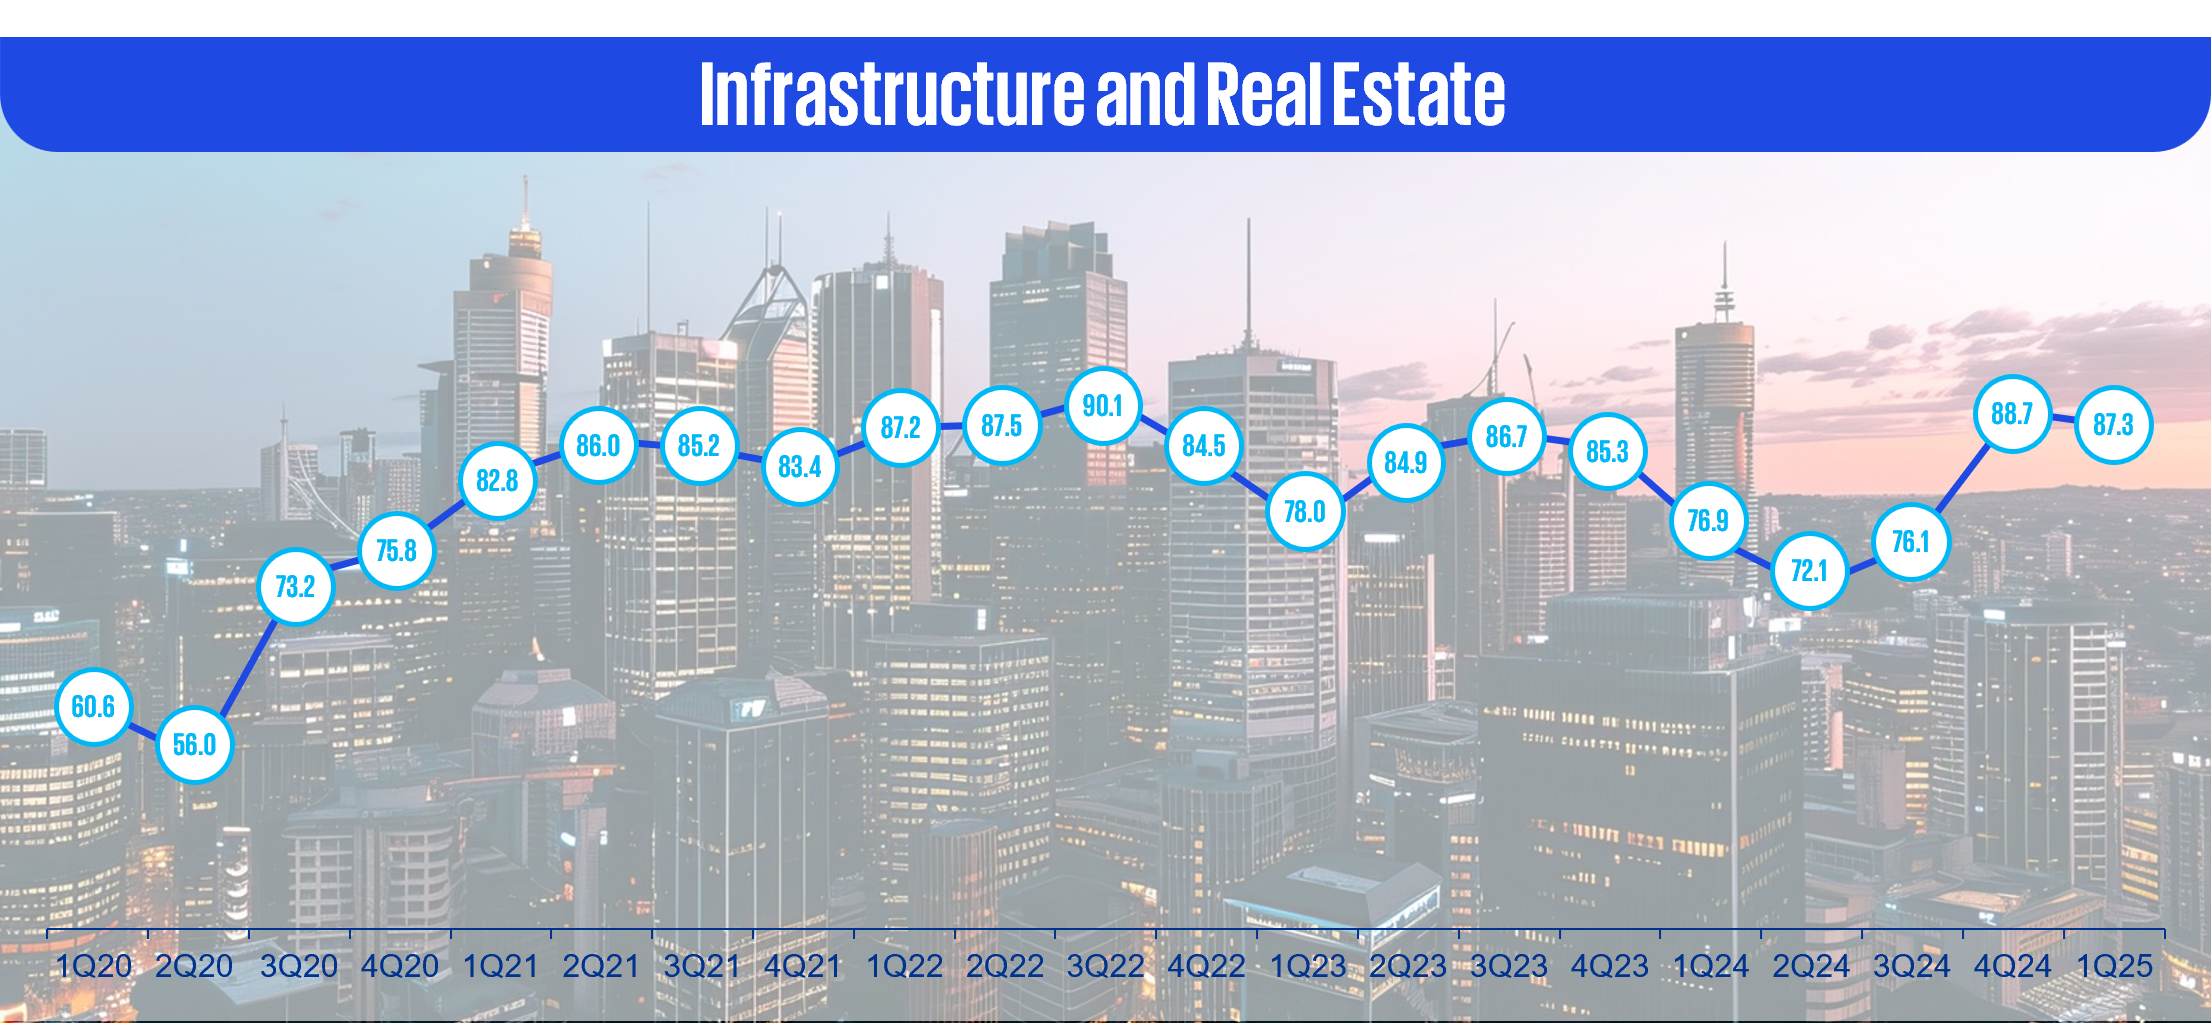
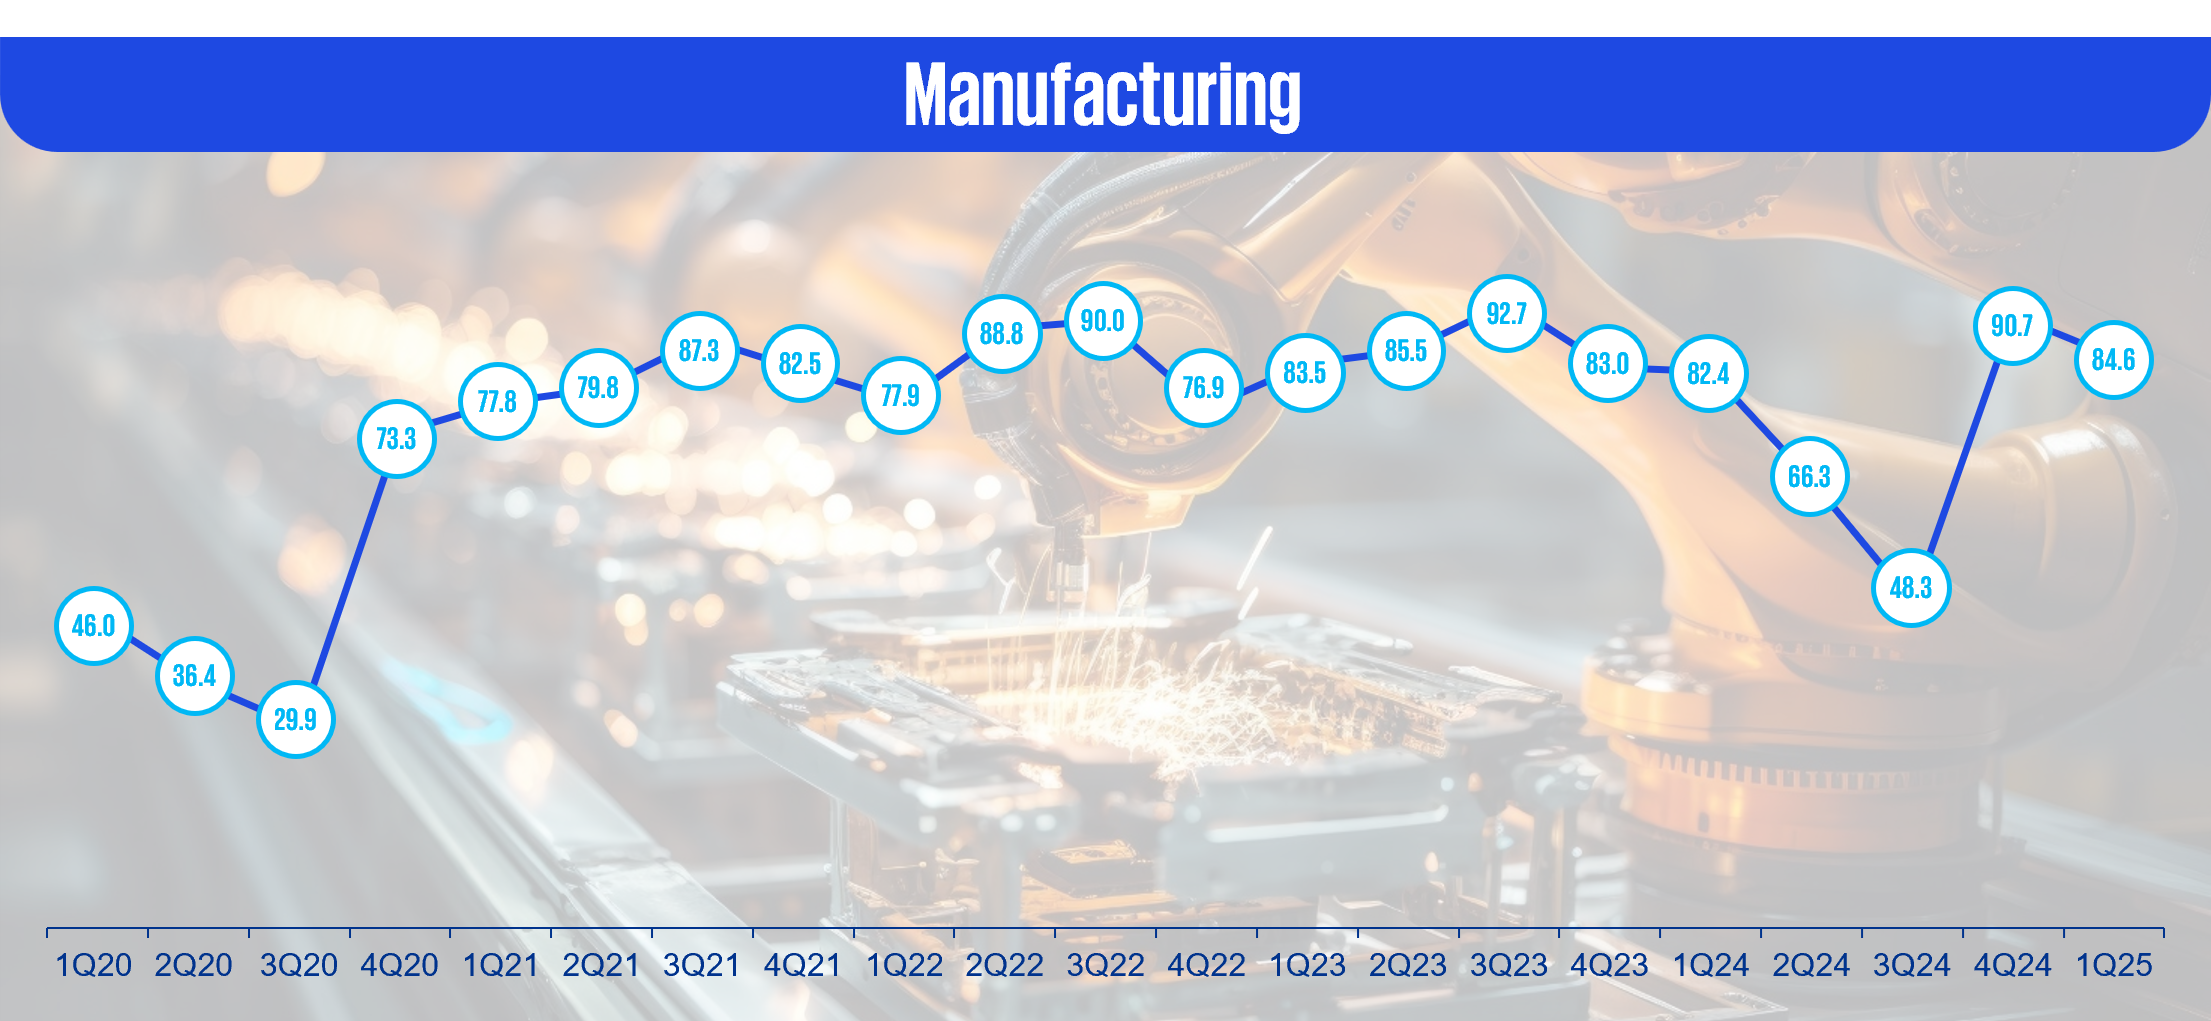
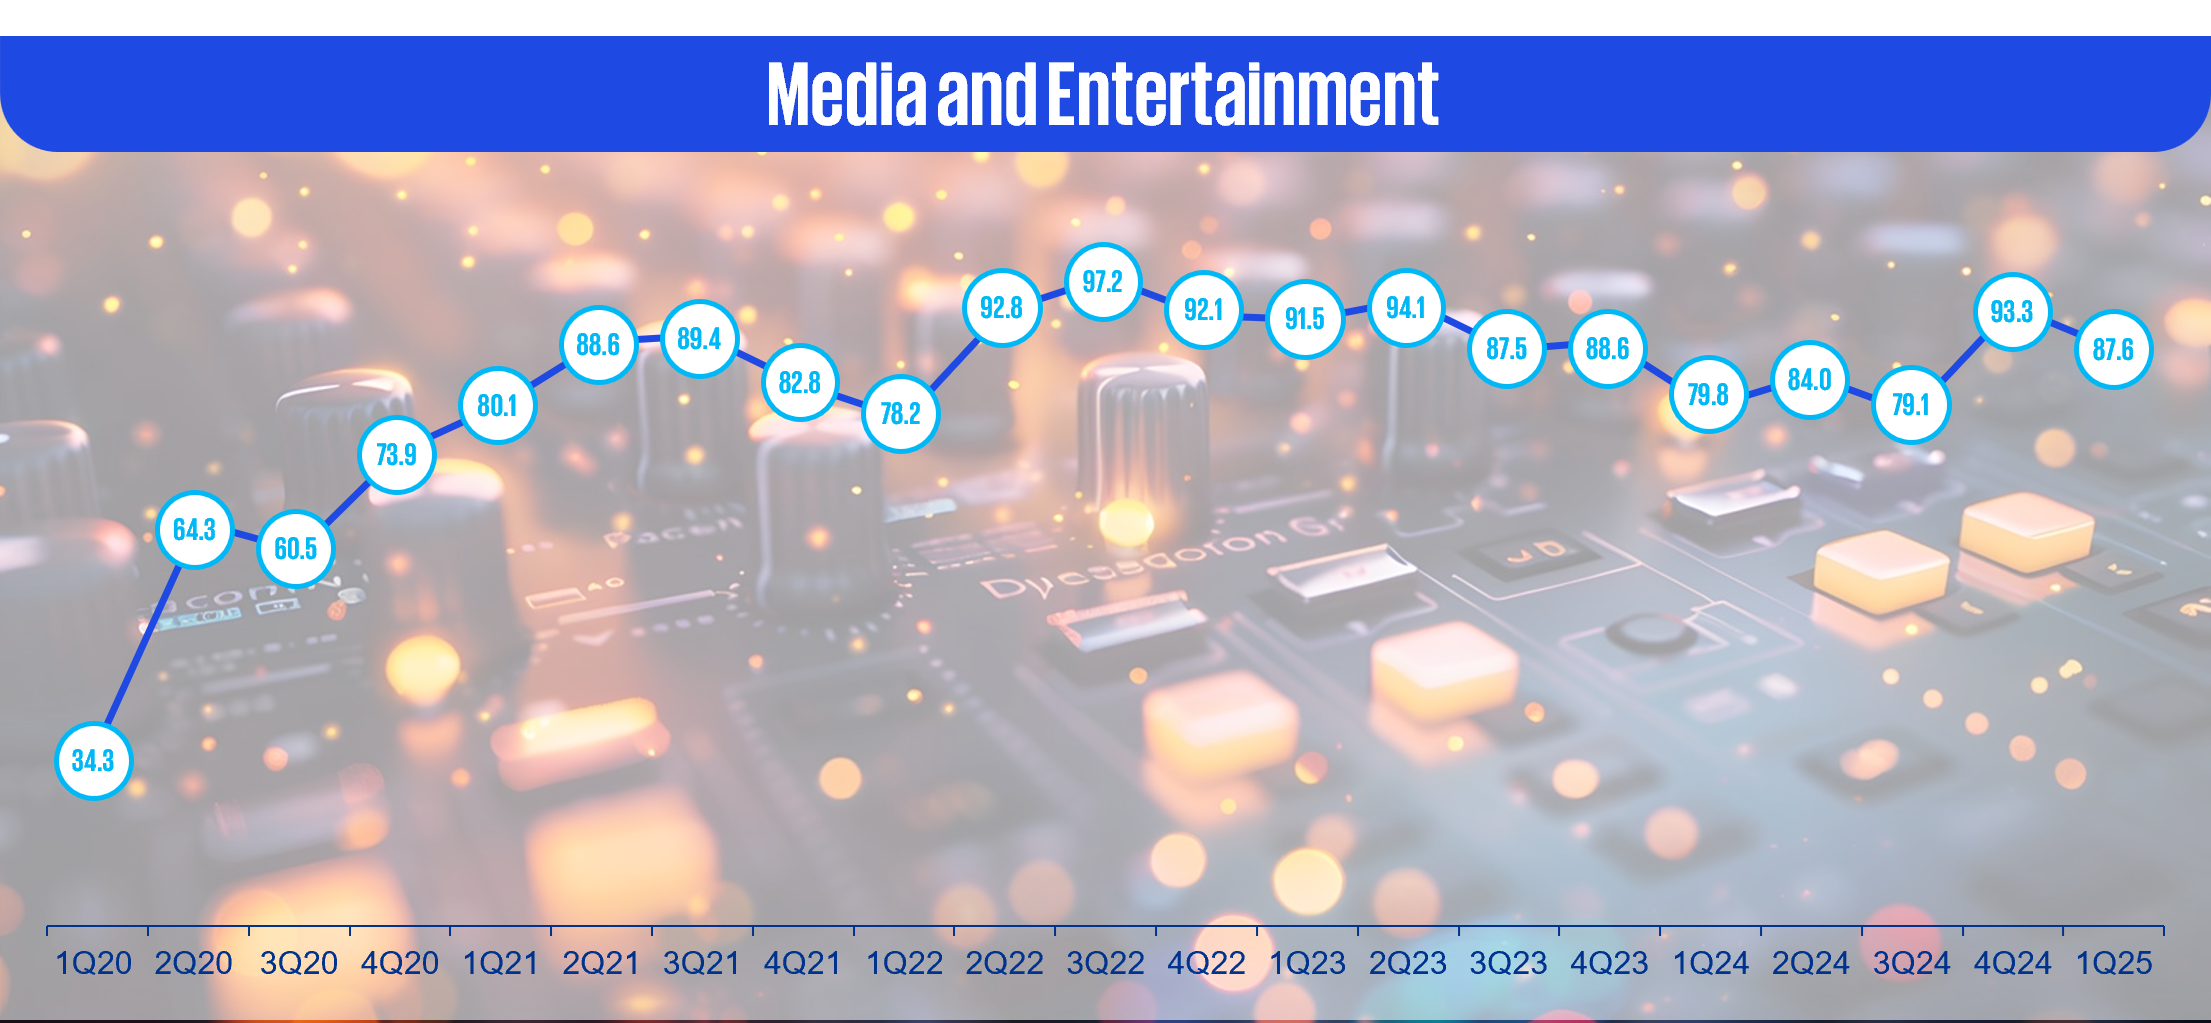

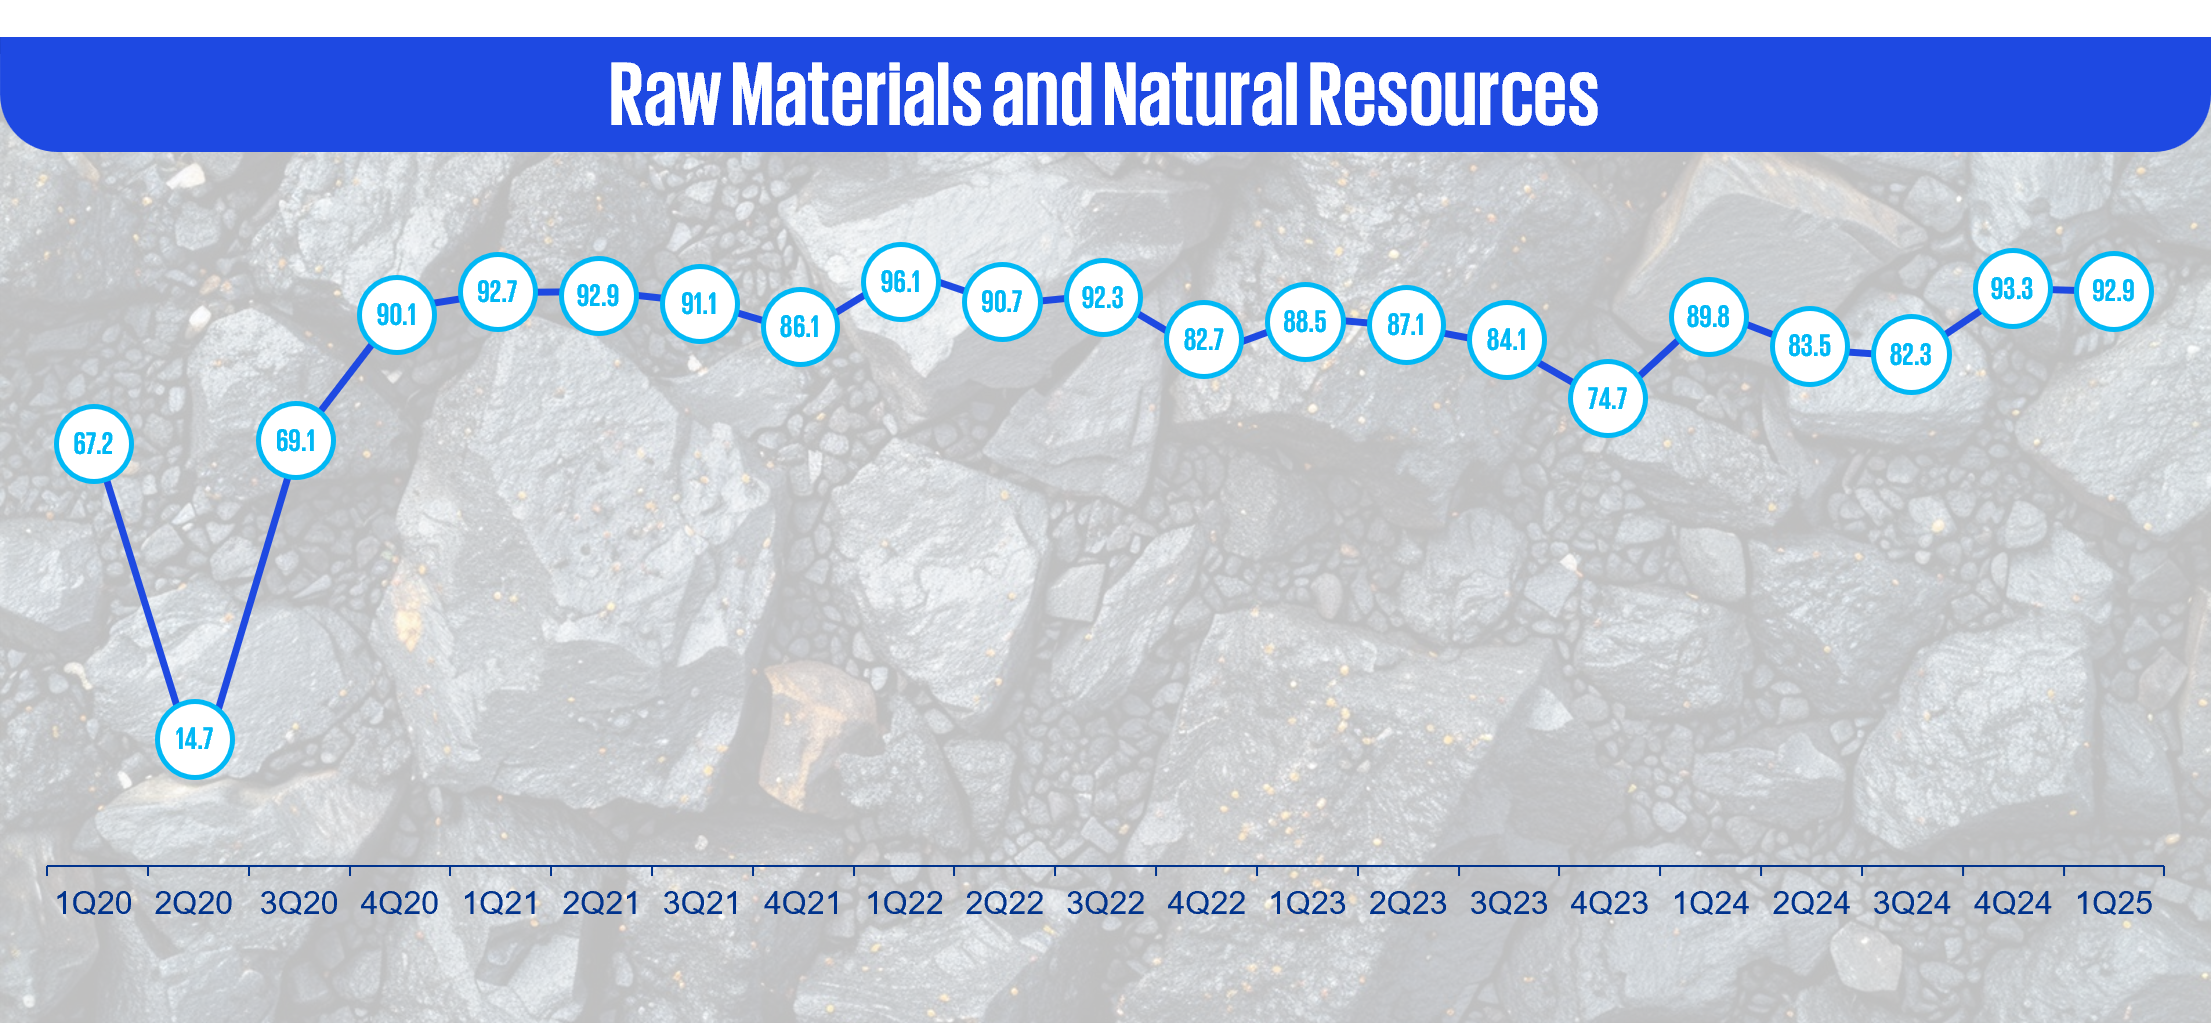
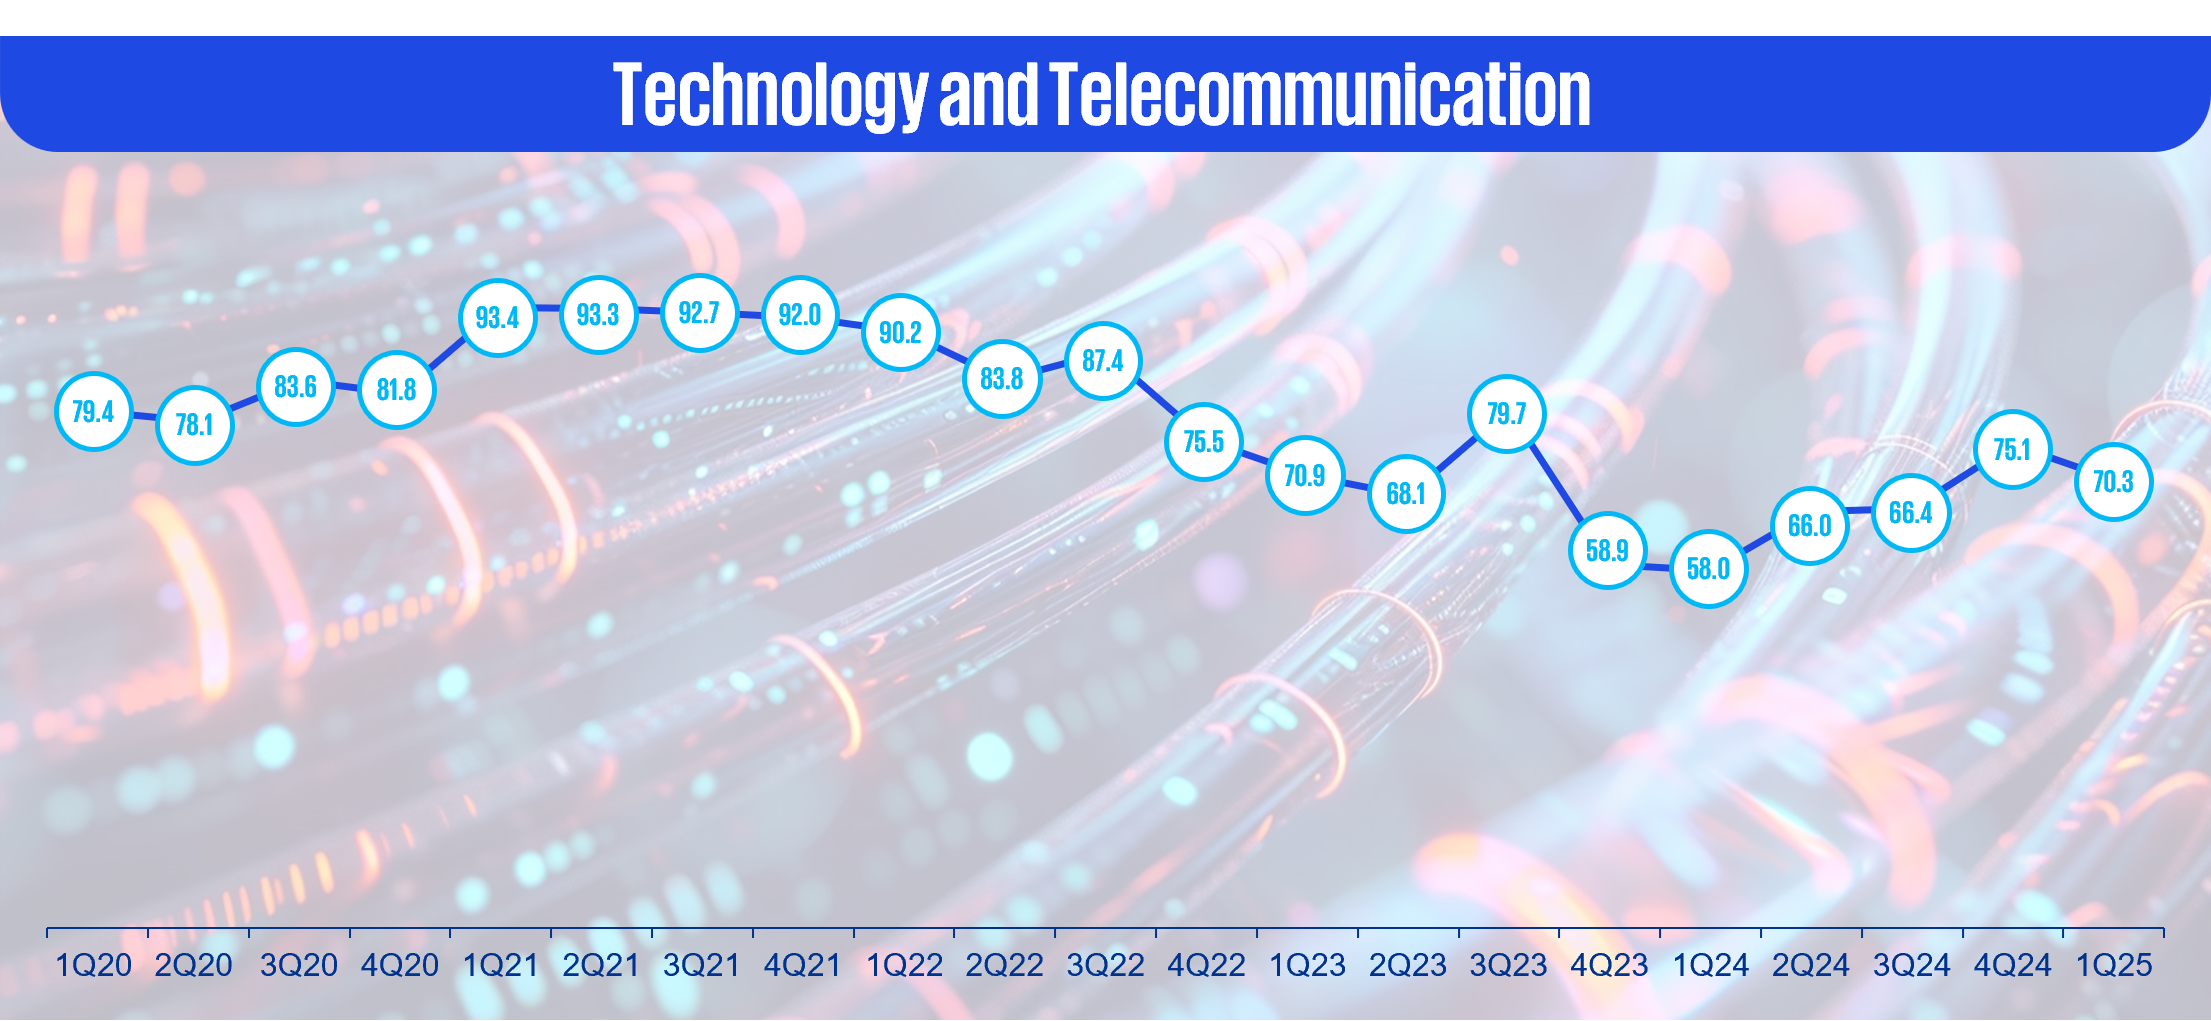
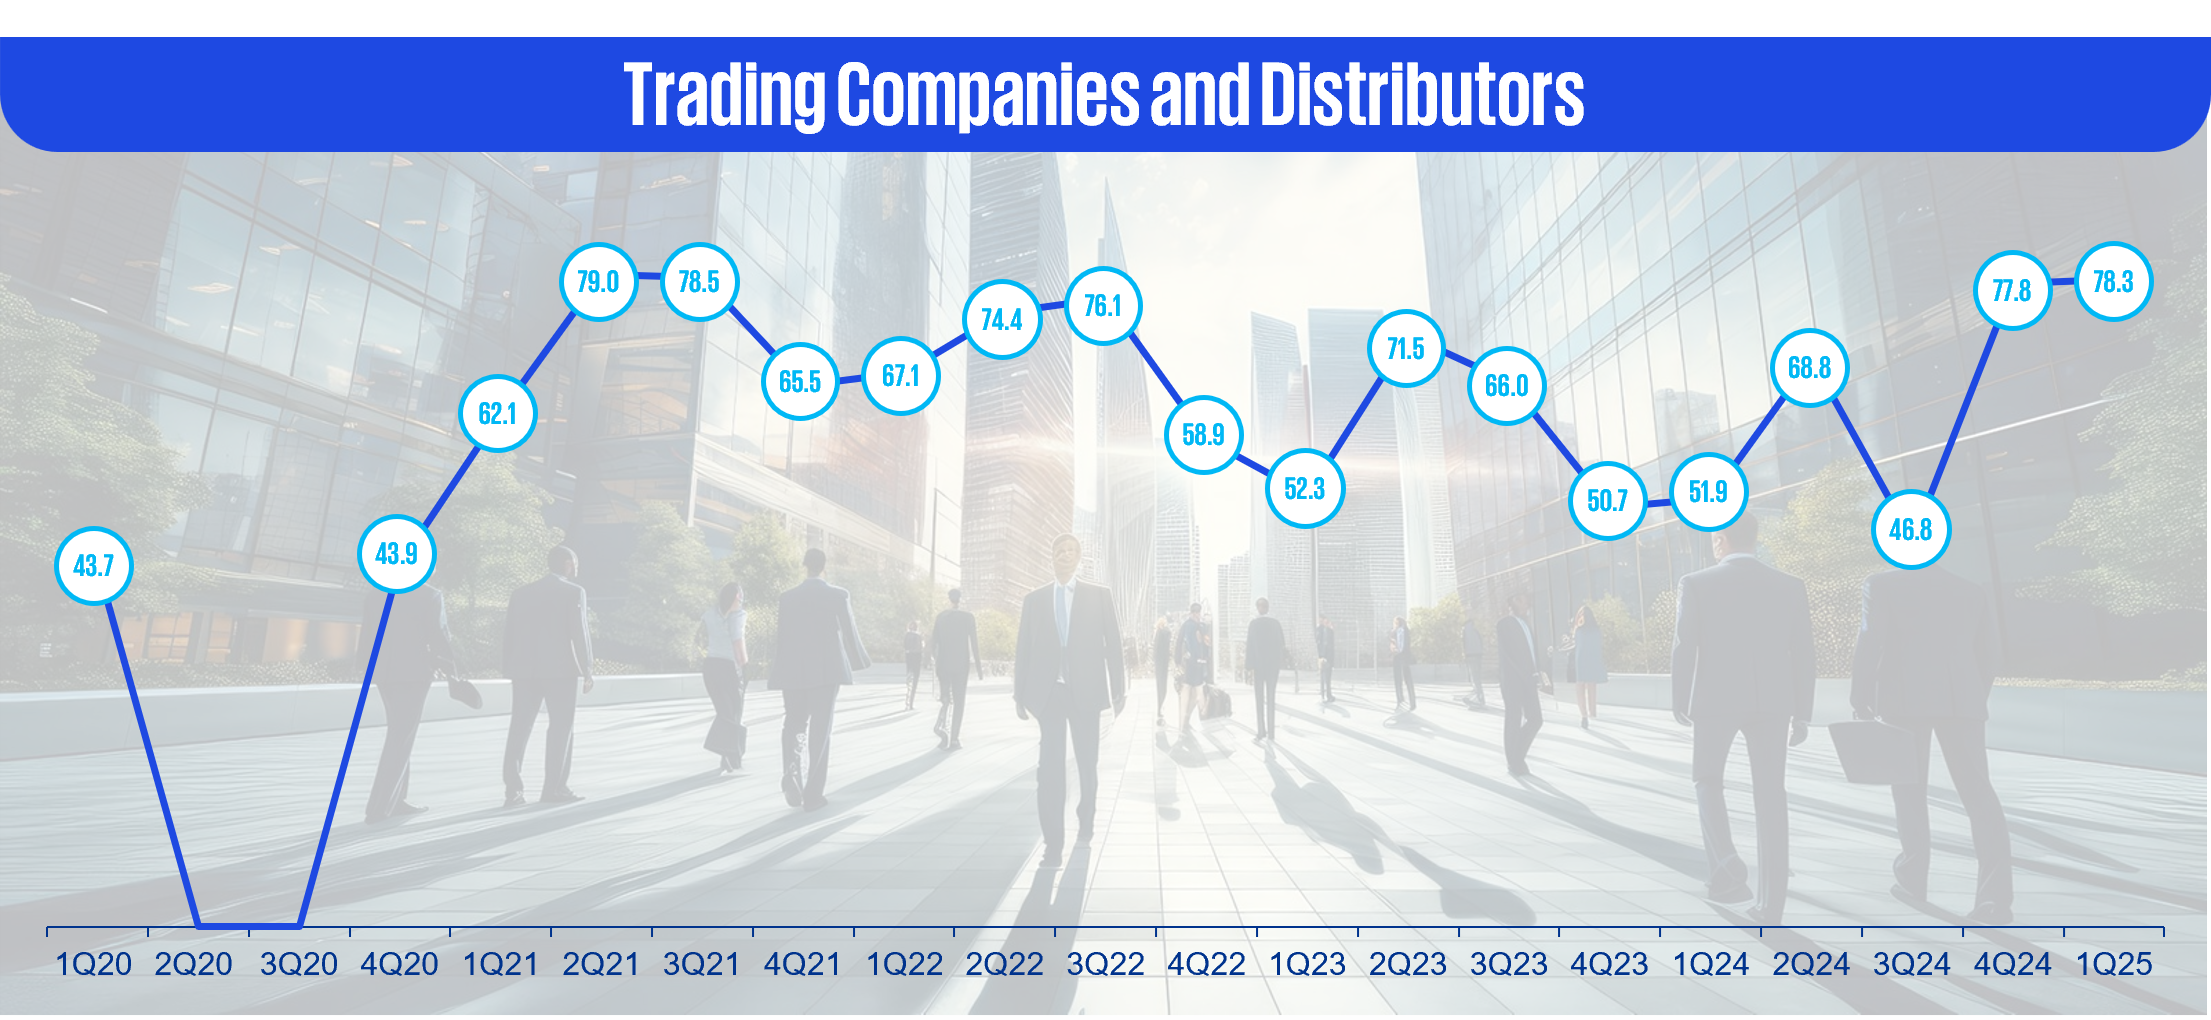
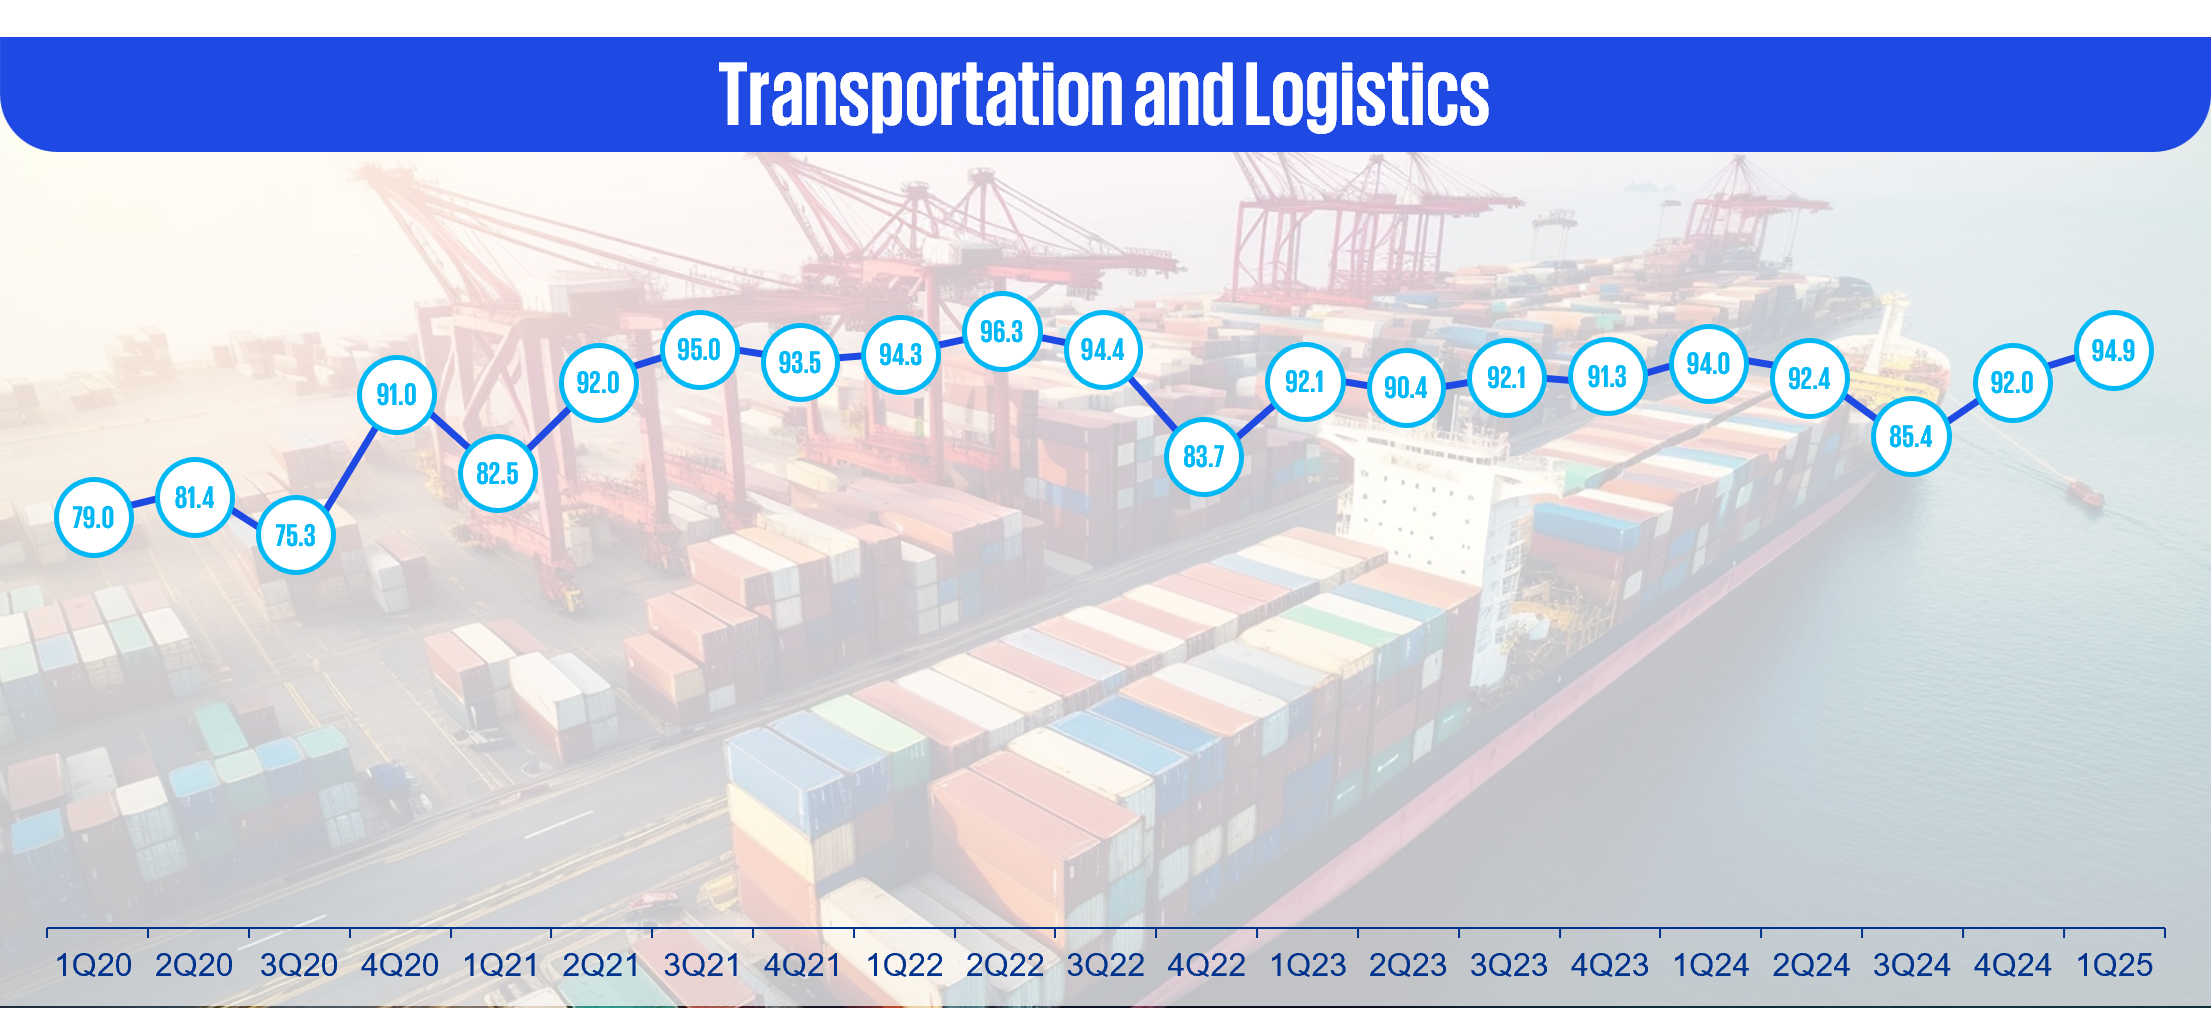
Zombies
- Zombies are defined as companies close to default (scoring 0 on the KPMG FPI) for three or more consecutive quarters. These businesses might already be facing challenges or implementing restructuring plans.
- In Asia, the count of zombies has fallen down from 178 in 4Q24 to 149 in 1Q25. The leading sectors with the most significant shares of zombies are Infrastructure and Real Estate at 24.2%, followed by Consumer Markets and Technology and Telecommunications at 18.1% and 10.1% respectively.
- Singapore’s count of zombies stayed the same at 4 in both 4Q24 and 1Q25. Sectors reporting zombies are Consumer Markets (3) and Technology and Telecommunication (1).
Trends of Zombies in the KPMG FPI
The KPMG Financial Performance Index measures the financial health of individual companies. Based on an initial pool of more than 40,000 companies globally, KPMG FPI identifies those companies, sectors, regions, countries, and territories that are performing well and those that are underperforming. A higher score on the KPMG FPI represents strong performance.
The KPMG FPI model draws from the Logit Probability to Financial Default model (developed by John Campbell, Jens Hilscher and Jan Szilagyi), which is based on eight explanatory variables encompassing financial and market variables, to arrive at the overall financial health of a company. The KPMG FPI is based on raw data from S&P Capital IQ database.
Global analysis
The global version of this tool is also available.
How we can help
To understand your company’s current index score, or to uncover deeper insights about specific markets or segments, contact us today. KPMG’s global network of professionals have the data, sector, and geographic expertise to help you understand your score and tie it back to your business needs. Whether it is benchmarking, identifying targets, comparing sectors, or looking for trends over time, KPMG professionals can connect you to the information you need to capitalise on your opportunities.
