We are pleased to share with you the second edition of our quarterly KPMG Financial Performance Index (FPI) publication. This publication provides insights into the changing state of corporate health across all companies listed and headquarter in Singapore across all sectors, following the end of the reporting season for the three months to June 2024. KPMG FPI data is refreshed on a quarterly basis. For more information, visit the KPMG FPI page.
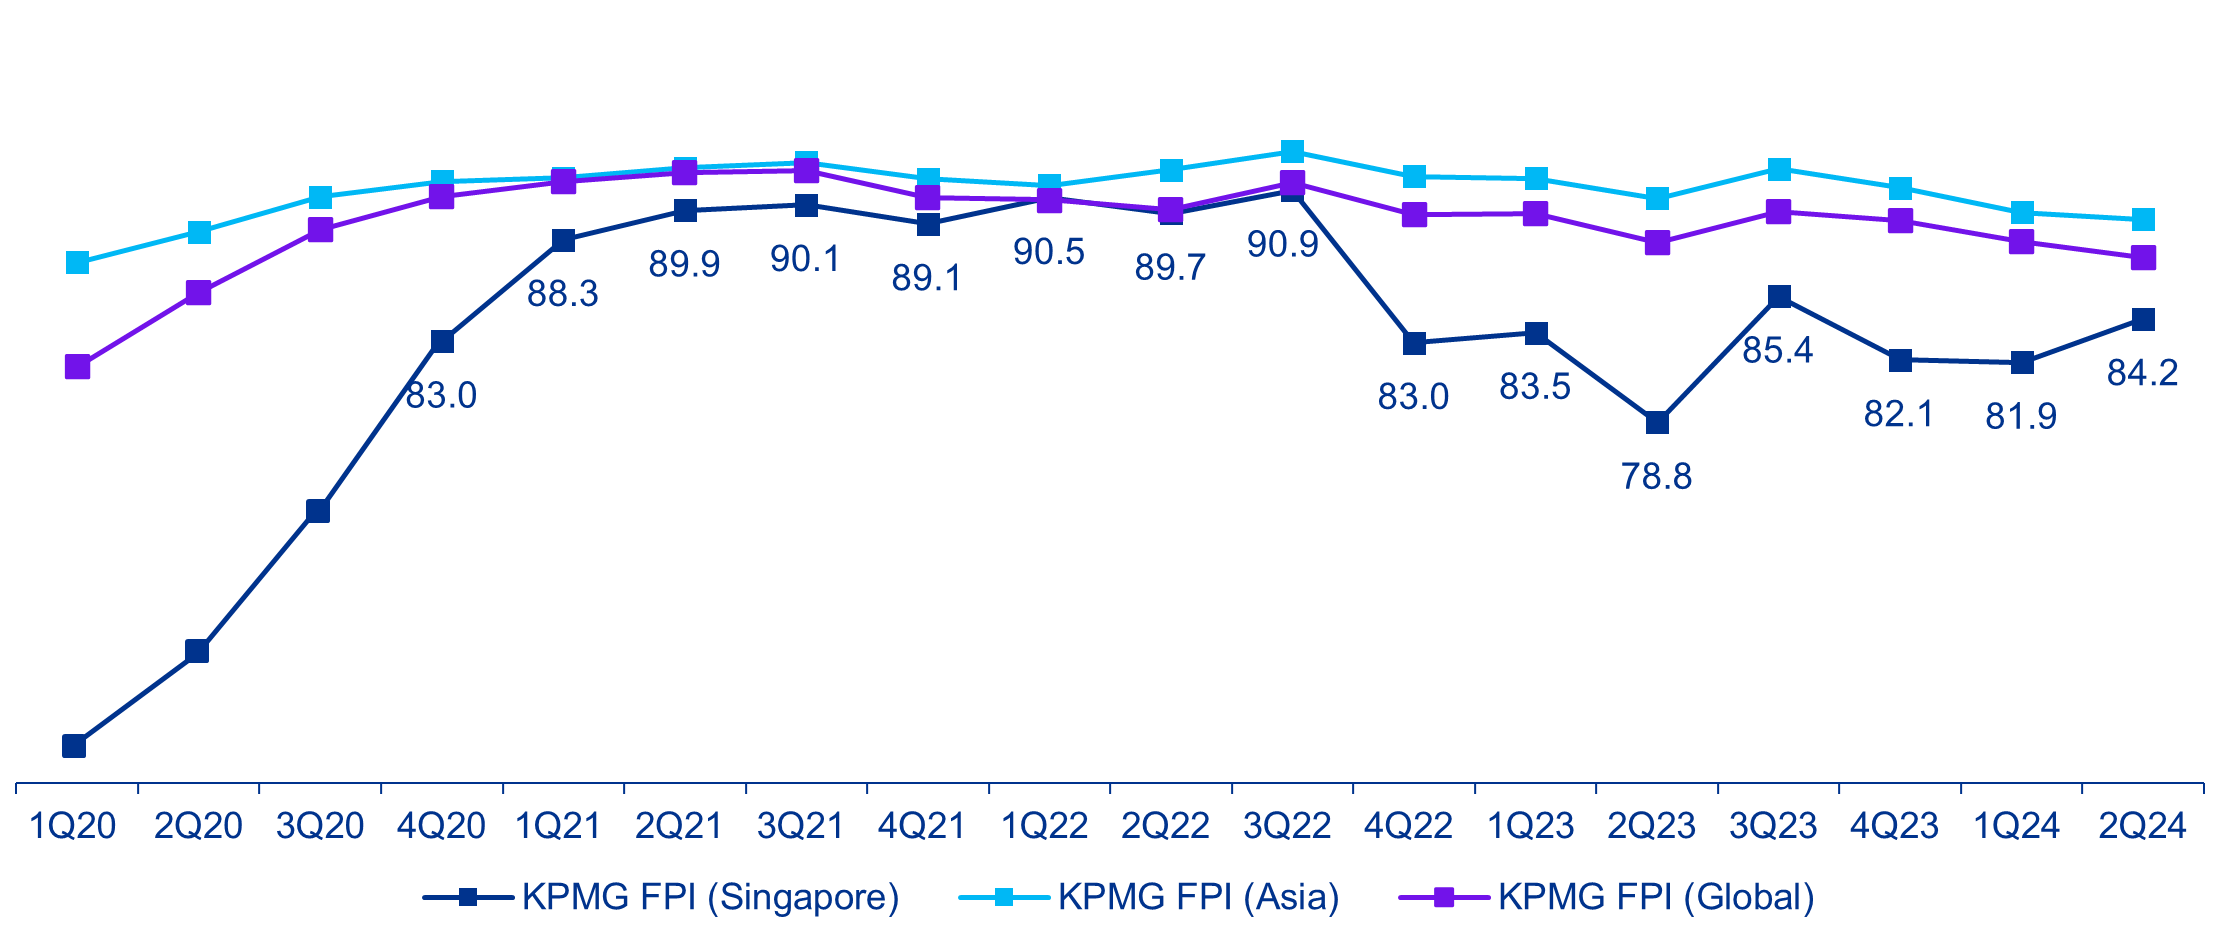
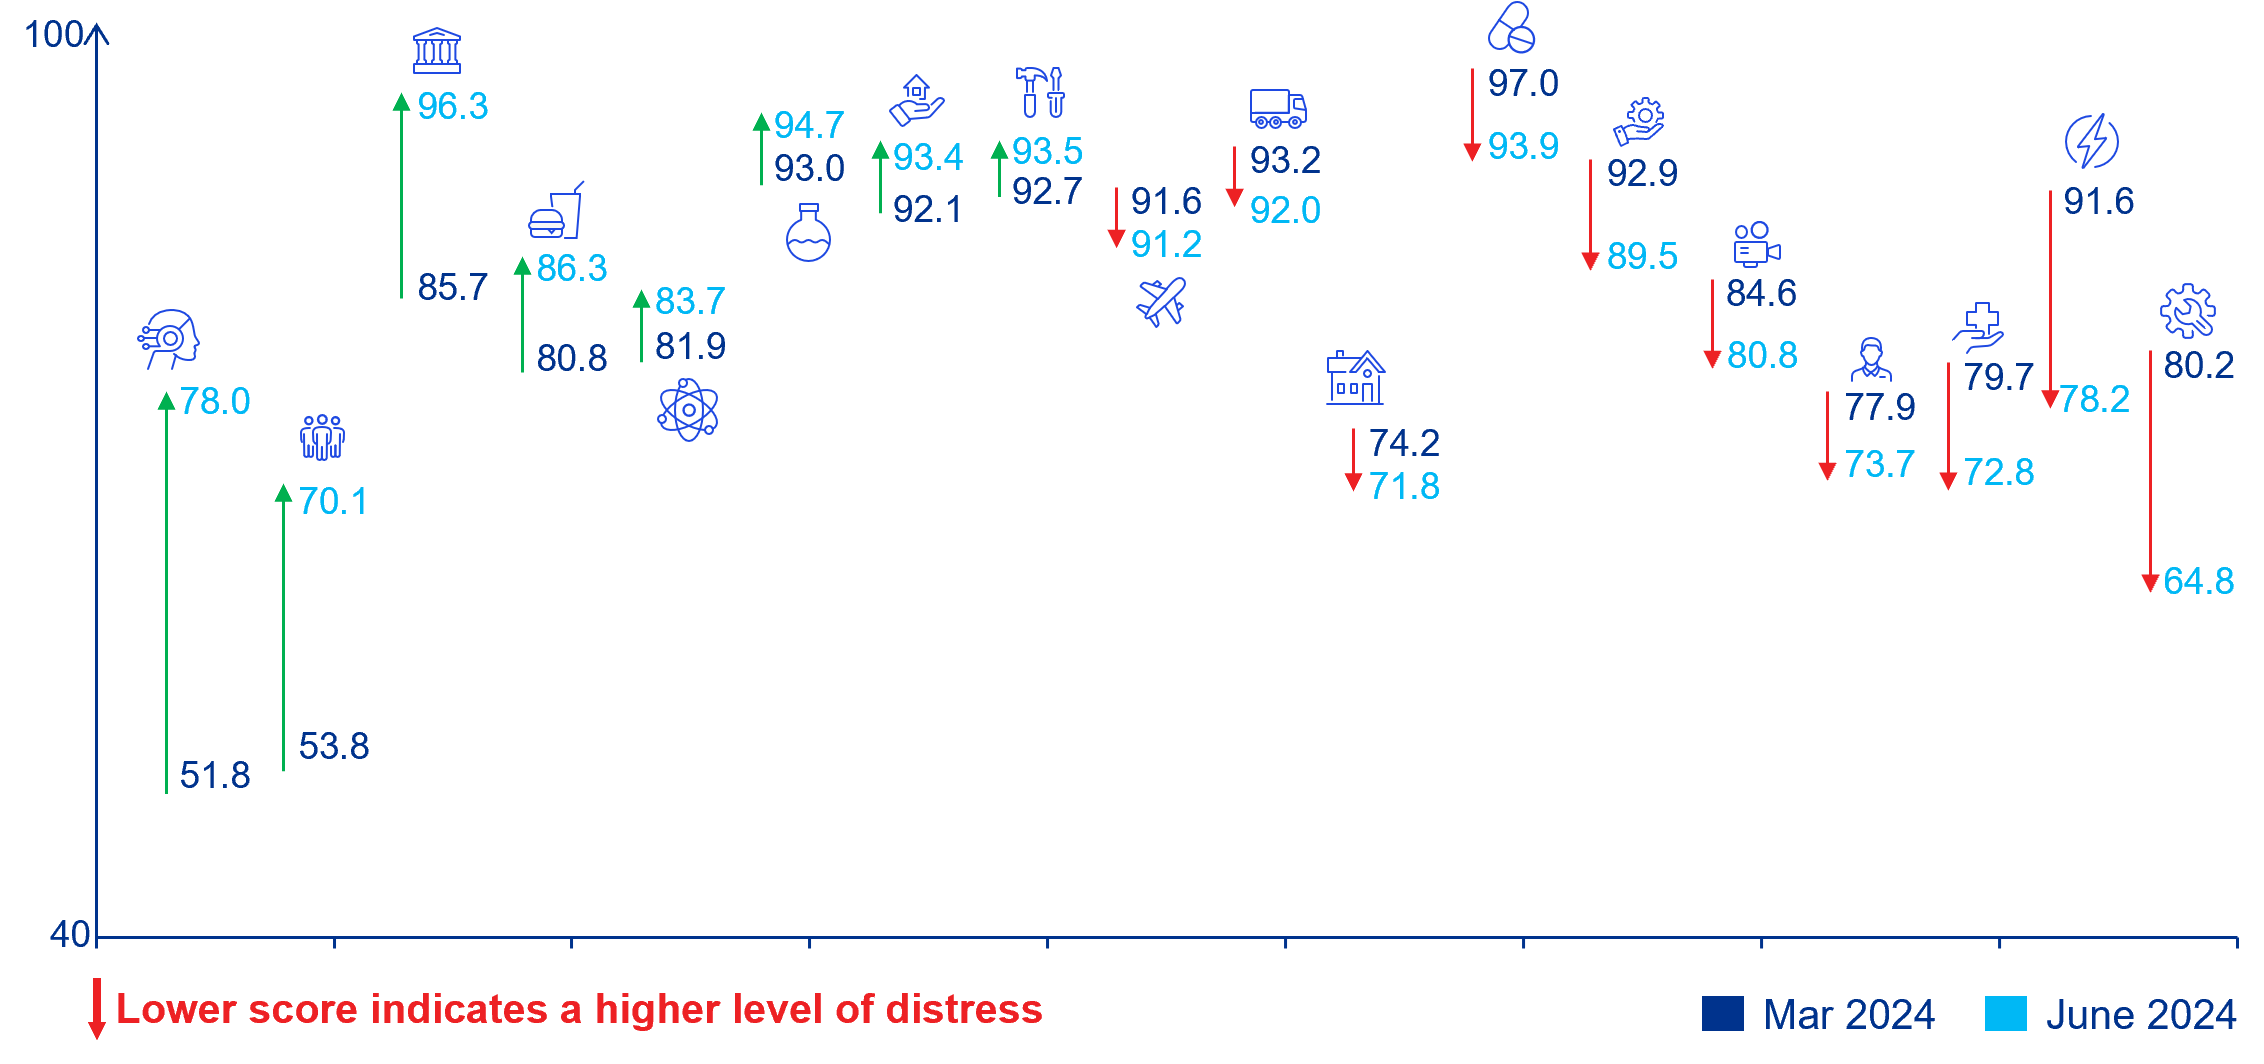
From March to June 2024, Singapore’s financial corporate health showed a slight improvement with FPI scores rising from 81.9 to 84.1. Out of the 18 sectors assessed, notable gains were seen in Technology and Telecommunication (51.8 to 78.0), Trading Companies & Distributors (53.8 to 70.1), and Financial Services (85.7 to 96.3) by the end of June 2024. Conversely, the Manufacturing (80.2 to 64.8) and Energy (91.6 to 78.2) sectors declined.
Singapore FPI performance comparison
KPMG Financial Performance Index (KPMG FPI Singapore) analysed across:
Historic FPI movement of Singapore with respect to Asia and global trends
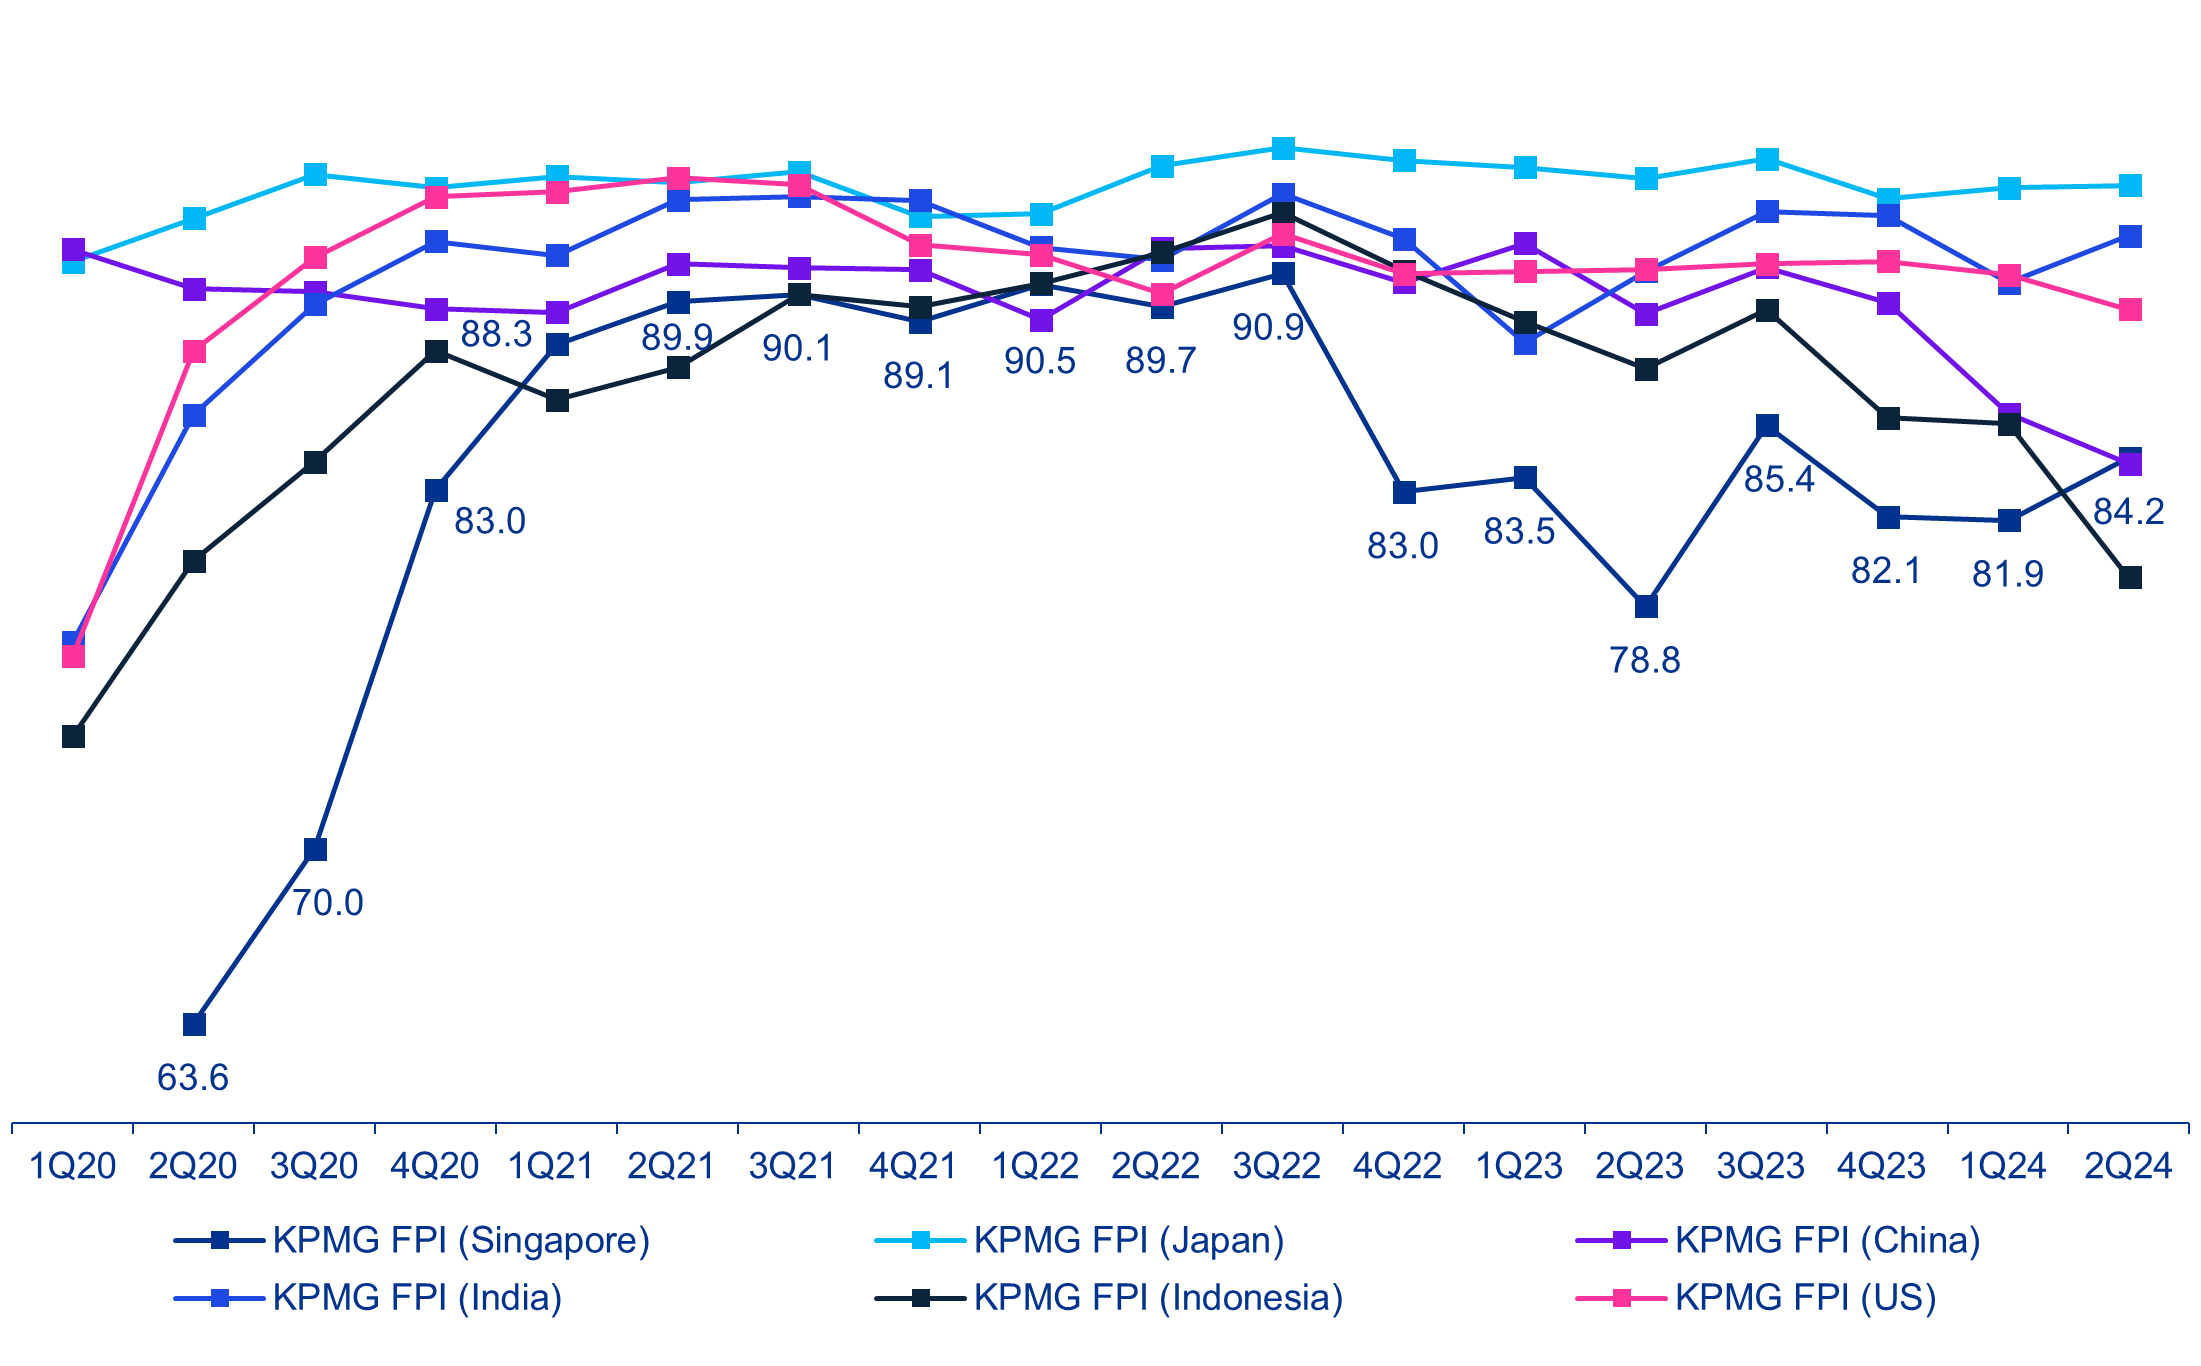
Historic FPI movement of Singapore with respect to India, Japan, China, Indonesia, and US
Sector movers
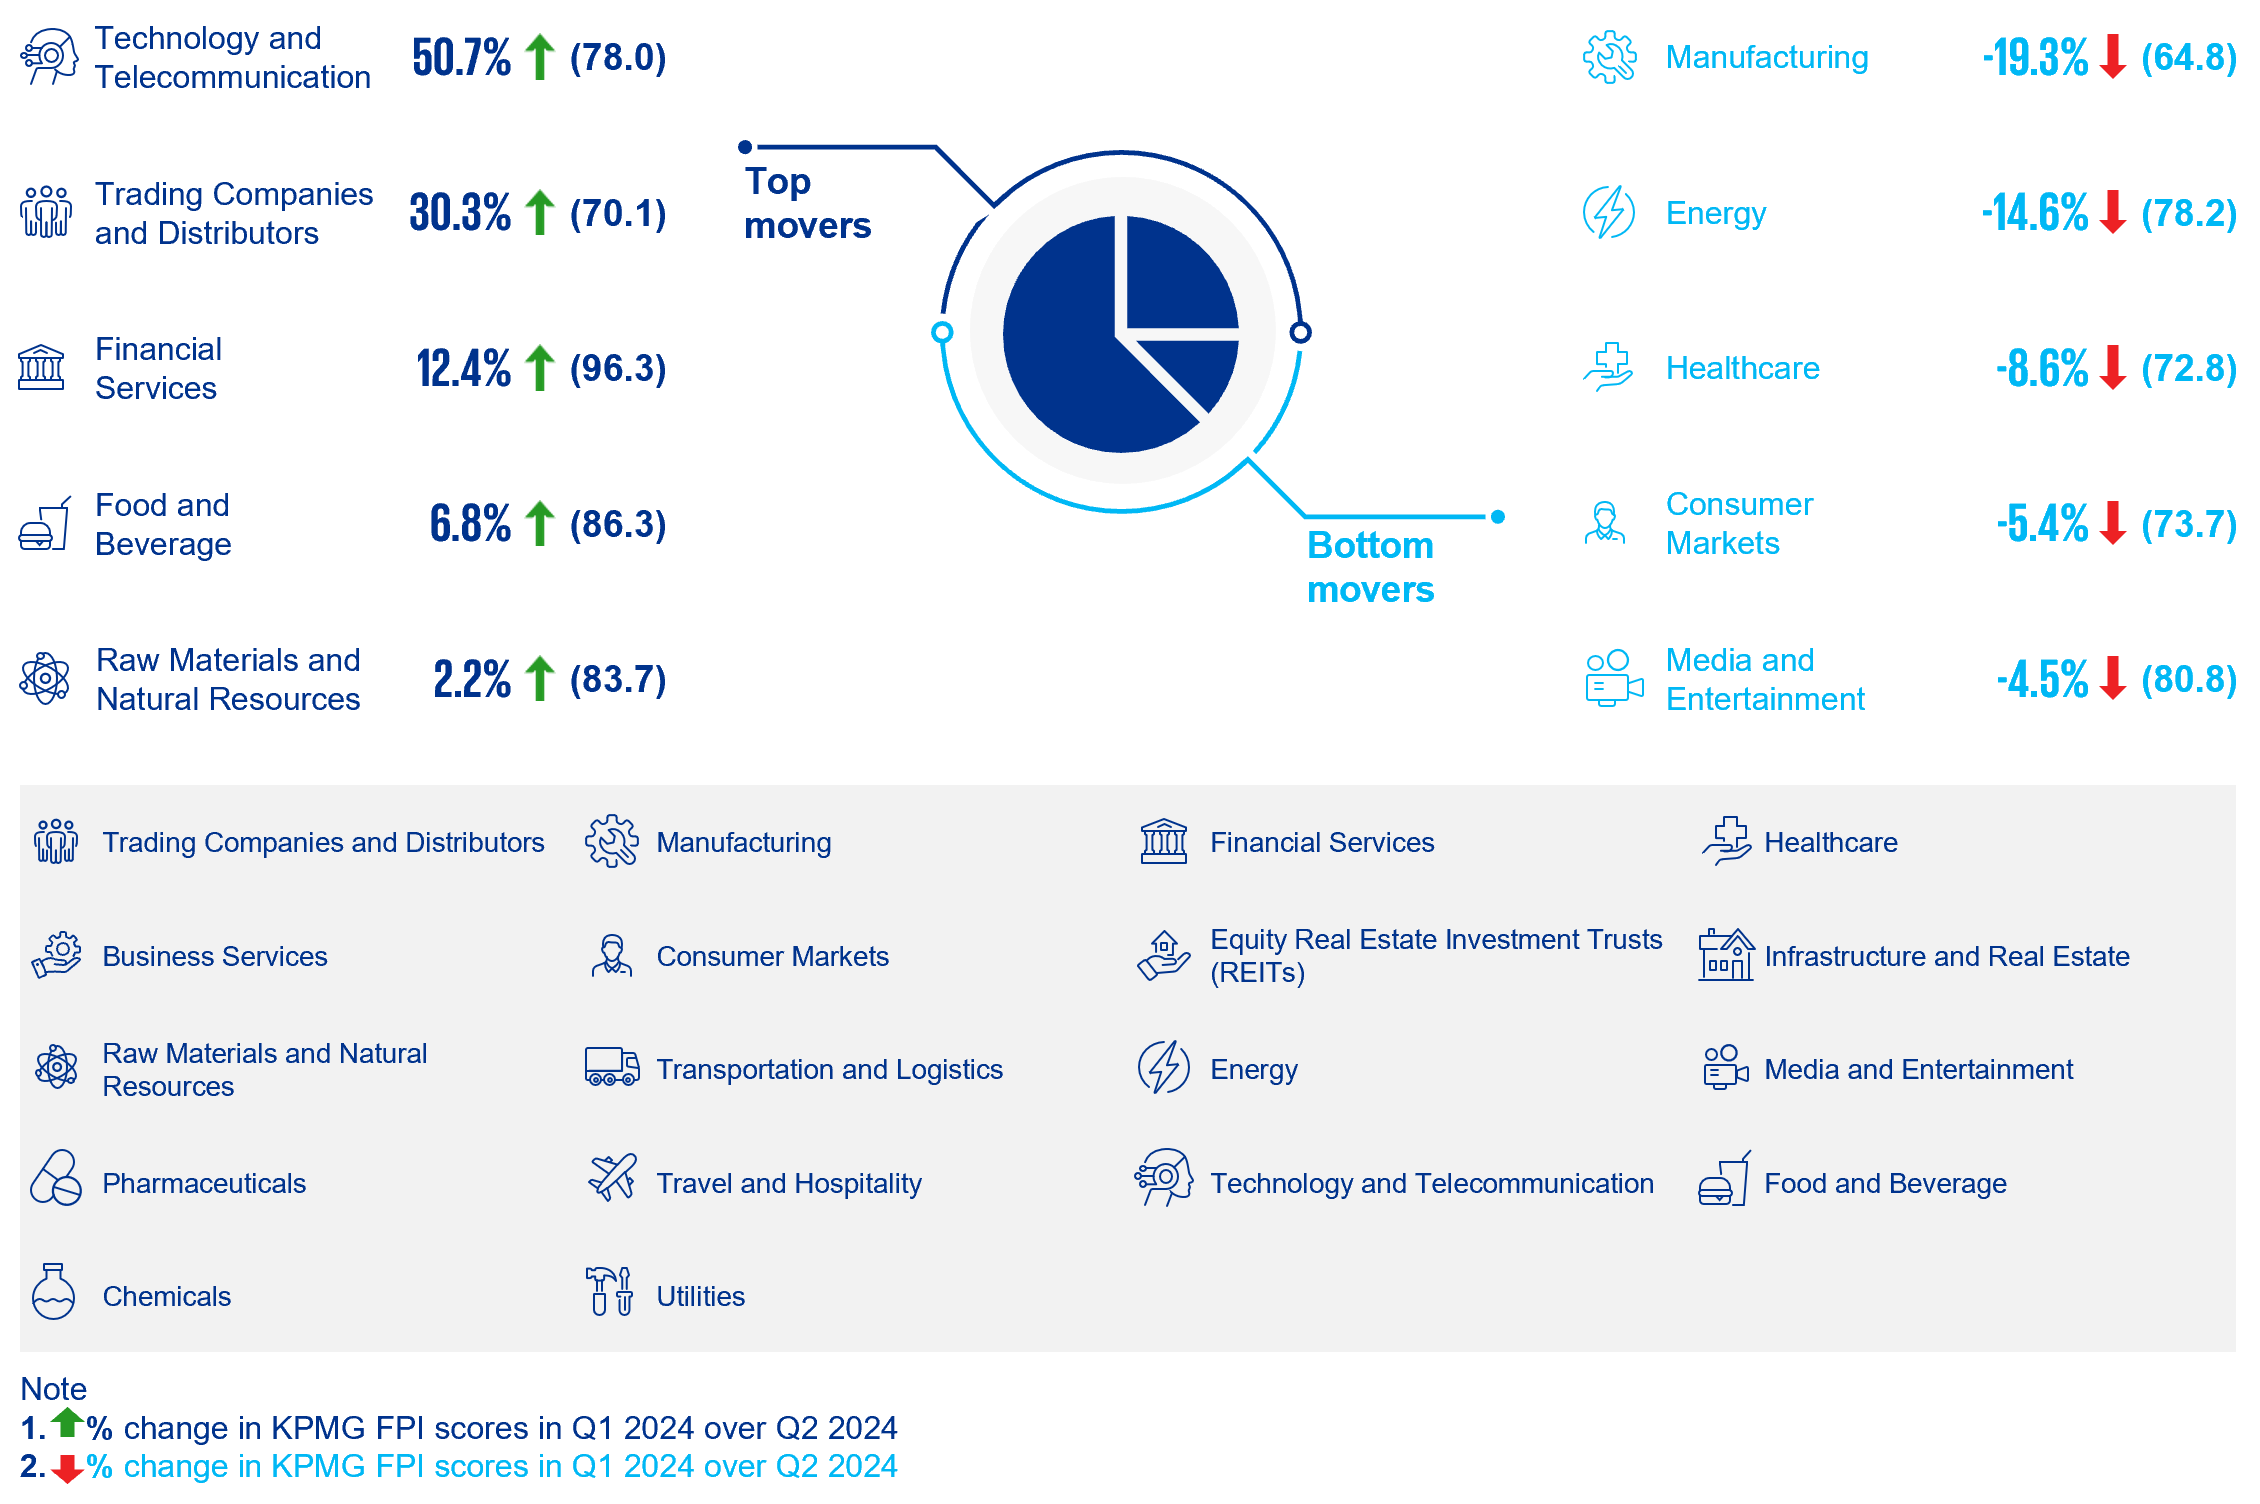
- The FPI scores for Singapore was majorly driven by Technology and Telecommunications sector, which saw more than 50.7% rise in 2Q24 when compared to 1Q24. The rise was mainly driven by growth witnessed in the overall Singaporean economy and IMF predictions validated the same with steady 2.5% annual growth from 2023 to 2028. This growth is expected to increase demand for skilled talent workforce in the Technology and Telecommunications sector.
- This growth is also driven by government’s increased focus on digital transformation and innovation with allocation of S$1 billion into AI over the next five years, plans of upgradation of the nationwide broadband network, and international collaborations and partnerships investment for development of AI CoEs in Singapore.
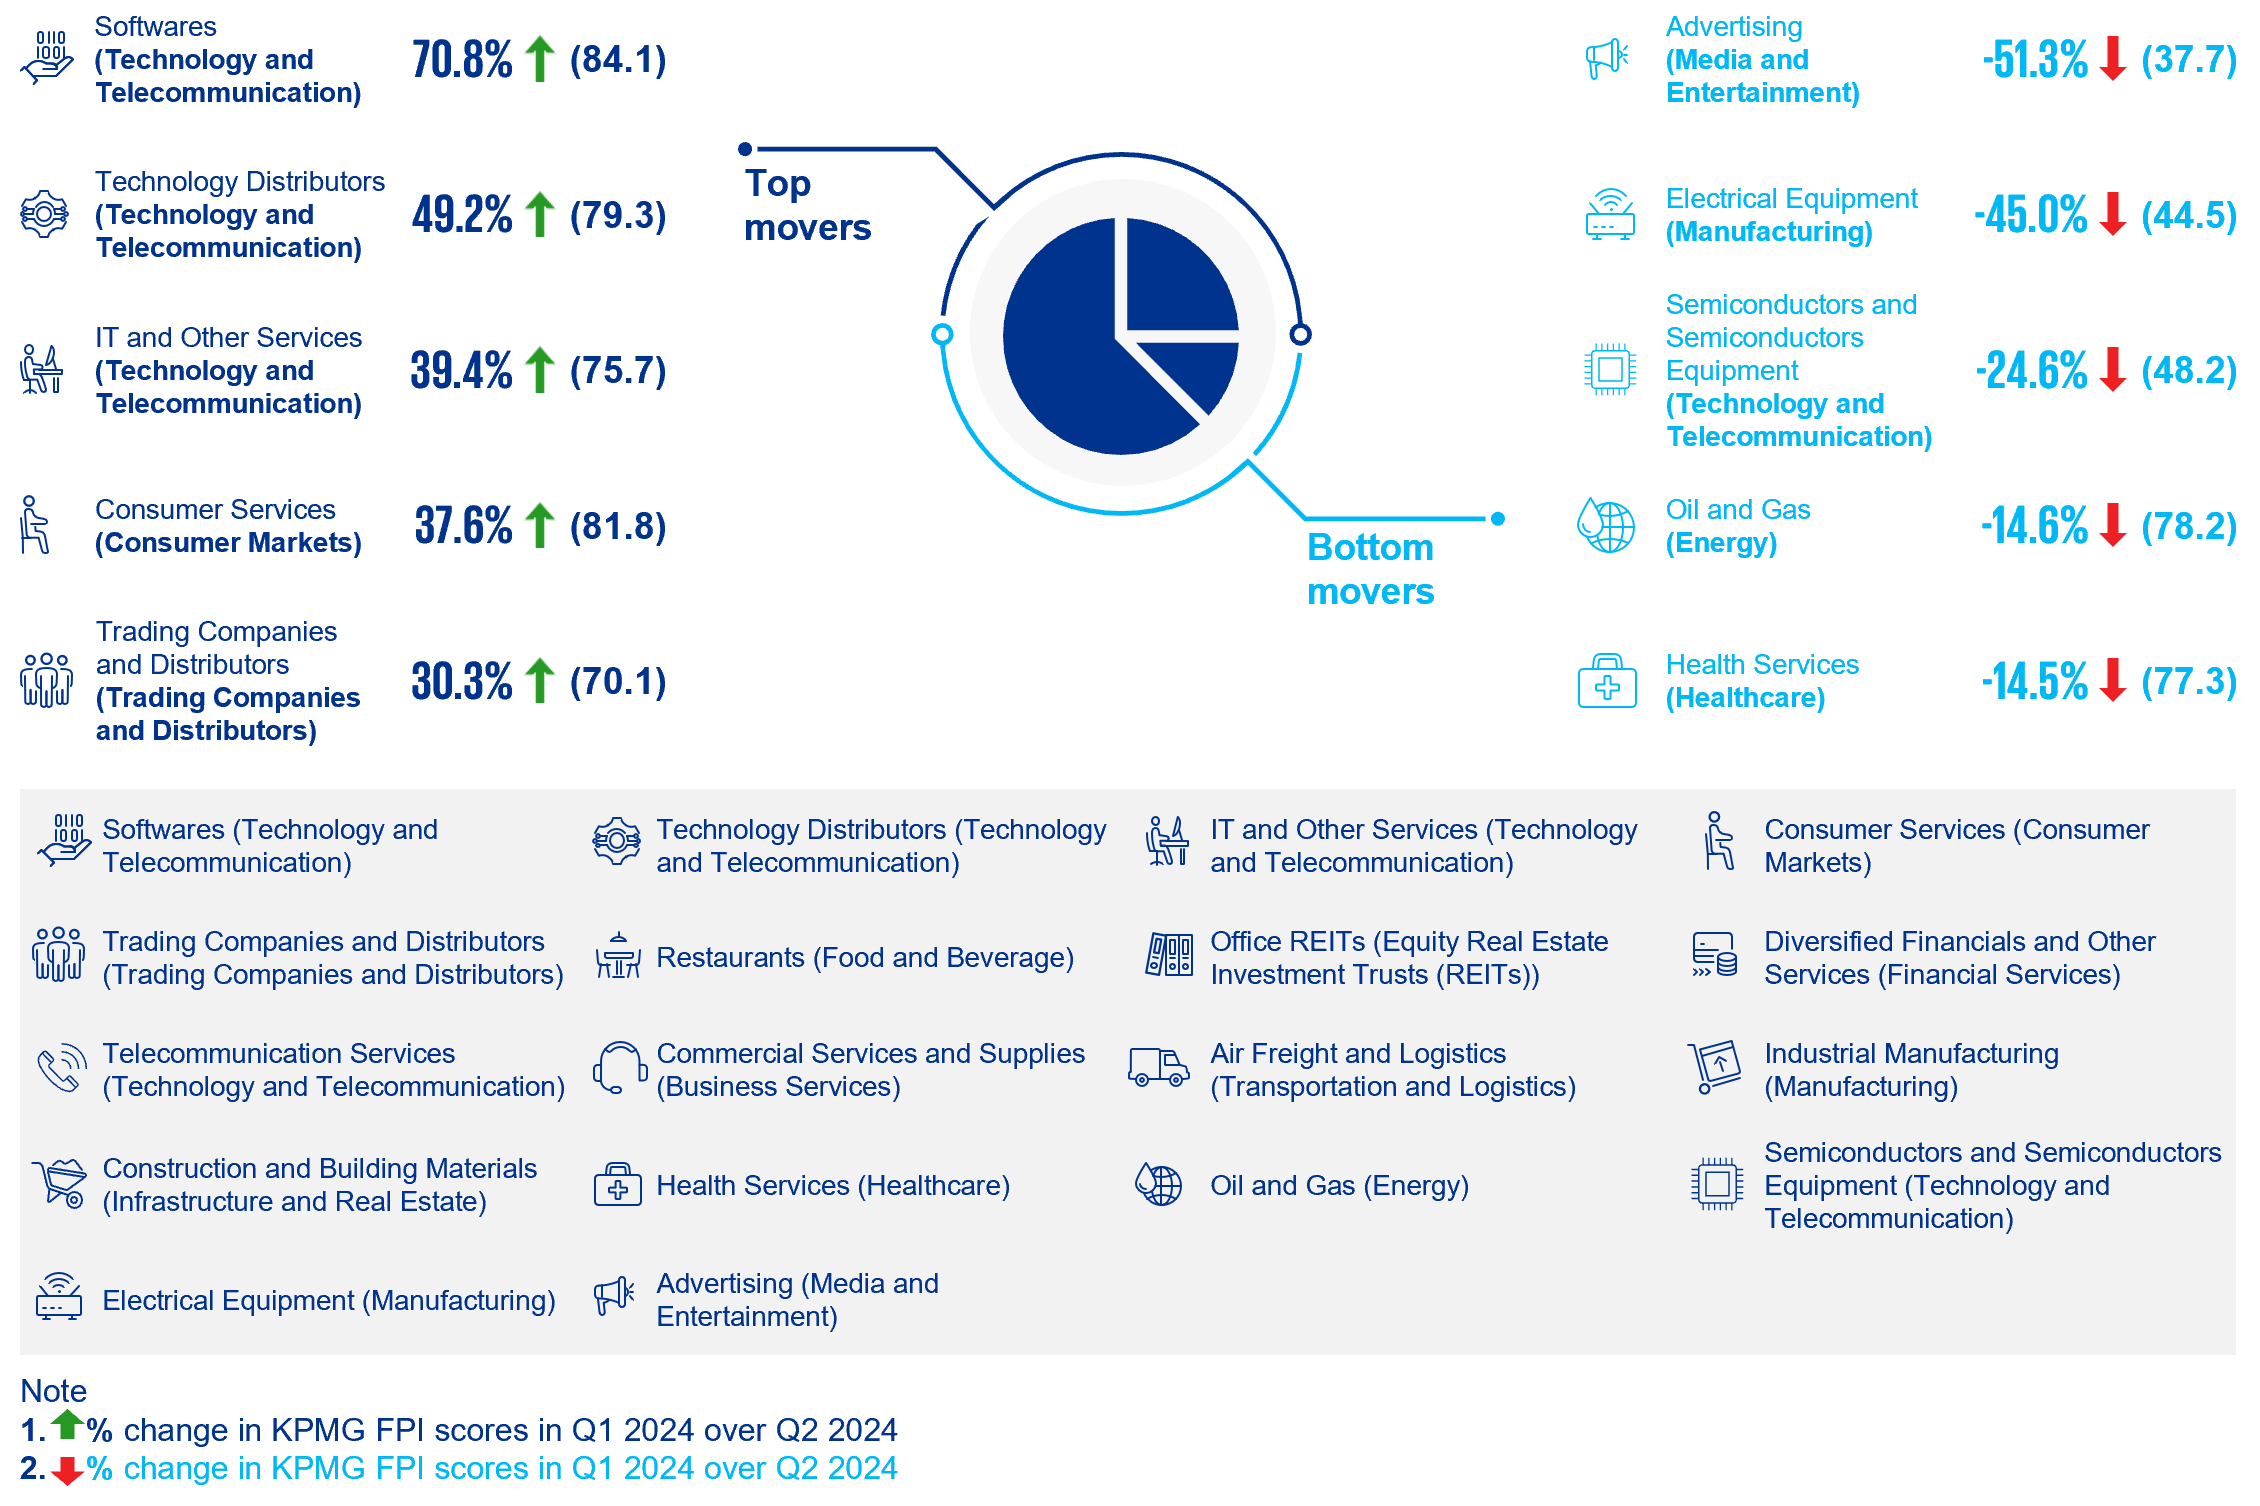
- Further, sectors including Trading Companies and Distributors and Financial Services also observed robust growth of 30.3% and 12.4%, respectively. A similar trend was seen among the associated sub-sectors such as Diversified Financials and Other Services observing a rise of 6.1%.
- Manufacturing, Energy and Healthcare sector witnessed prominent decline in FPI scores, dropping by 19.3%, 14.6% and 8.6% respectively. Year-on-year, Consumer Markets, Energy and Media and Entertainment sectors recorded major declines in FPI scores and dropped by 12.6%, 11.7% and 6.1% respectively. Energy sector in Singapore has witnessed prominent declines since 2Q23.
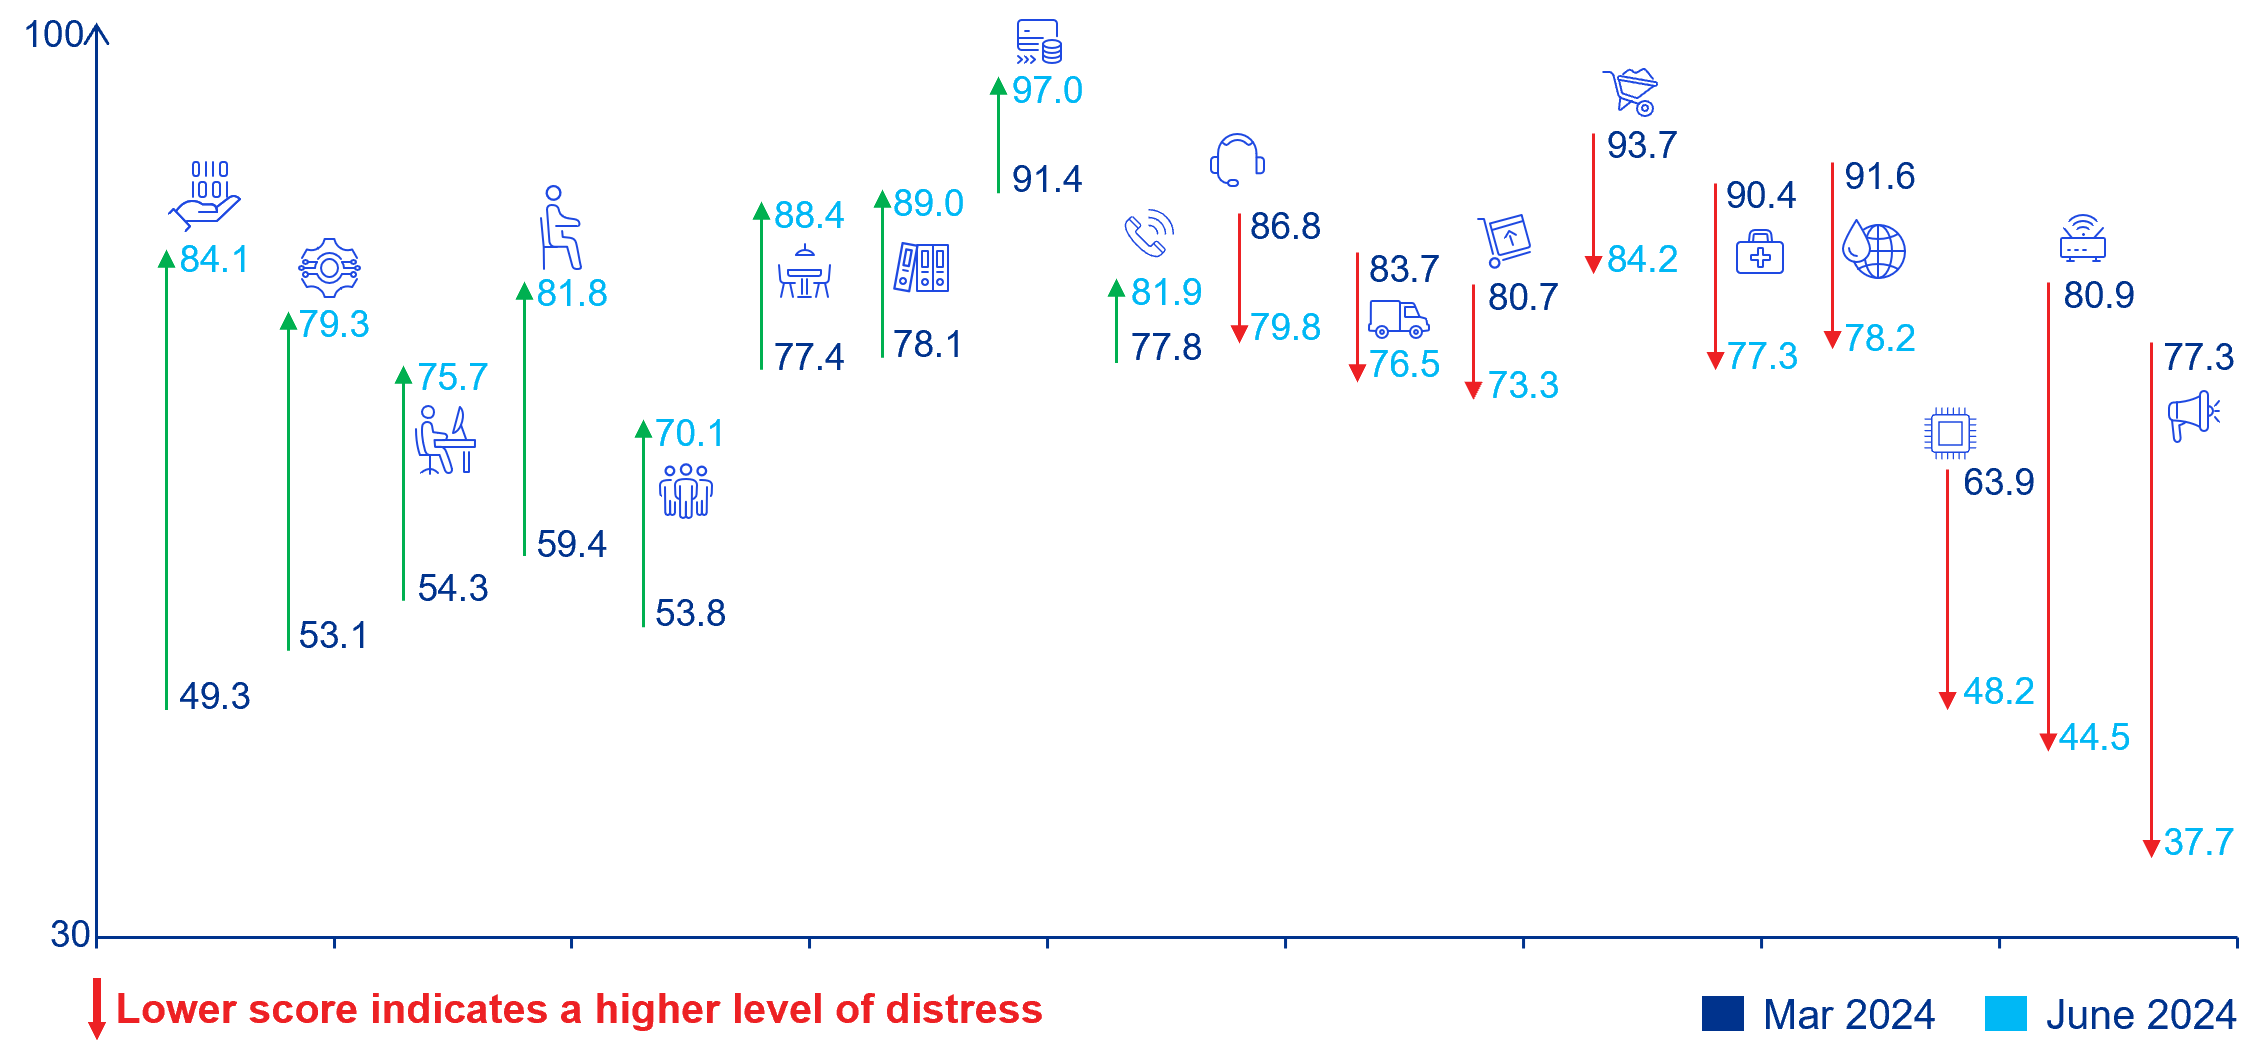
- In the sub-sector analysis, Advertising (Media and Entertainment) scored lowest at 37.7, followed by Real Estate Services (Infrastructure and Real Estate) at 43.6, and Electrical Equipment (Manufacturing) at 44.5. Additionally, Advertising saw the largest quarter-over-quarter decline at 51.3%, followed by Electrical Equipment at 45.0%, and Semiconductor & Semiconductor Equipment at 24.6%.
- Notably, Financial Services led as Singapore’s top sector from 1Q24 to 2Q24, showing a robust 12.4% quarter-over-quarter growth.
From March 2024 to June 2024
Strongest and weakest sector outperformers
From March 2024 to June 2024
Strongest and weakest sub-sector outperformers
Singapore economy and landscape
- Singapore's GDP growth is projected to grow between 2% to 3% in 2024, following 1.1% growth in 2023. This forecast is based on optimistic global macroeconomic environment anticipated for 2H24 alongside continuous recovery in global demand for electronics and tourism.
- Sectors comprising the information and communications, finance and insurance and professional services sectors recorded the biggest GDP growth of 5.6% in 2Q24, supported by continued strong demand for IT and digital solutions and growth in banking and fund management segments. The FPI index for last 6 months (4Q23 vs 2Q24) was in line with broader economic trend with IT and Other Services, Technology Distributors and Research and Consulting Services being the top sectors witnessing strong growth.
- The travel-centric segment and consumer-focused domestic services are expected to see growth in 2024, driven by the continuing revival of international travel and gradual disinflation. In the last quarter, the FPI index also showed gains in sectors like Food and Beverage. Travel and Hospitality have consistently maintained a robust FPI score above 90 for over ten consecutive quarters.
- The manufacturing and trade-related sectors are expected to see a gradual recovery during the year. Within the manufacturing sector, the electronics cluster is projected to recover gradually in the coming quarters, supported by demand for semiconductors for end-markets such as smartphones, PCs and AI. Growth in the electronics cluster will in turn have positive spillover effects on the precision engineering cluster, as well as the machinery, equipment & supplies segment of the wholesale trade sector.
Zombies
- Zombies are defined as companies close to default (scoring 0 on the KPMG FPI) for three or more consecutive quarters. These businesses might already be facing challenges or implementing restructuring plans.
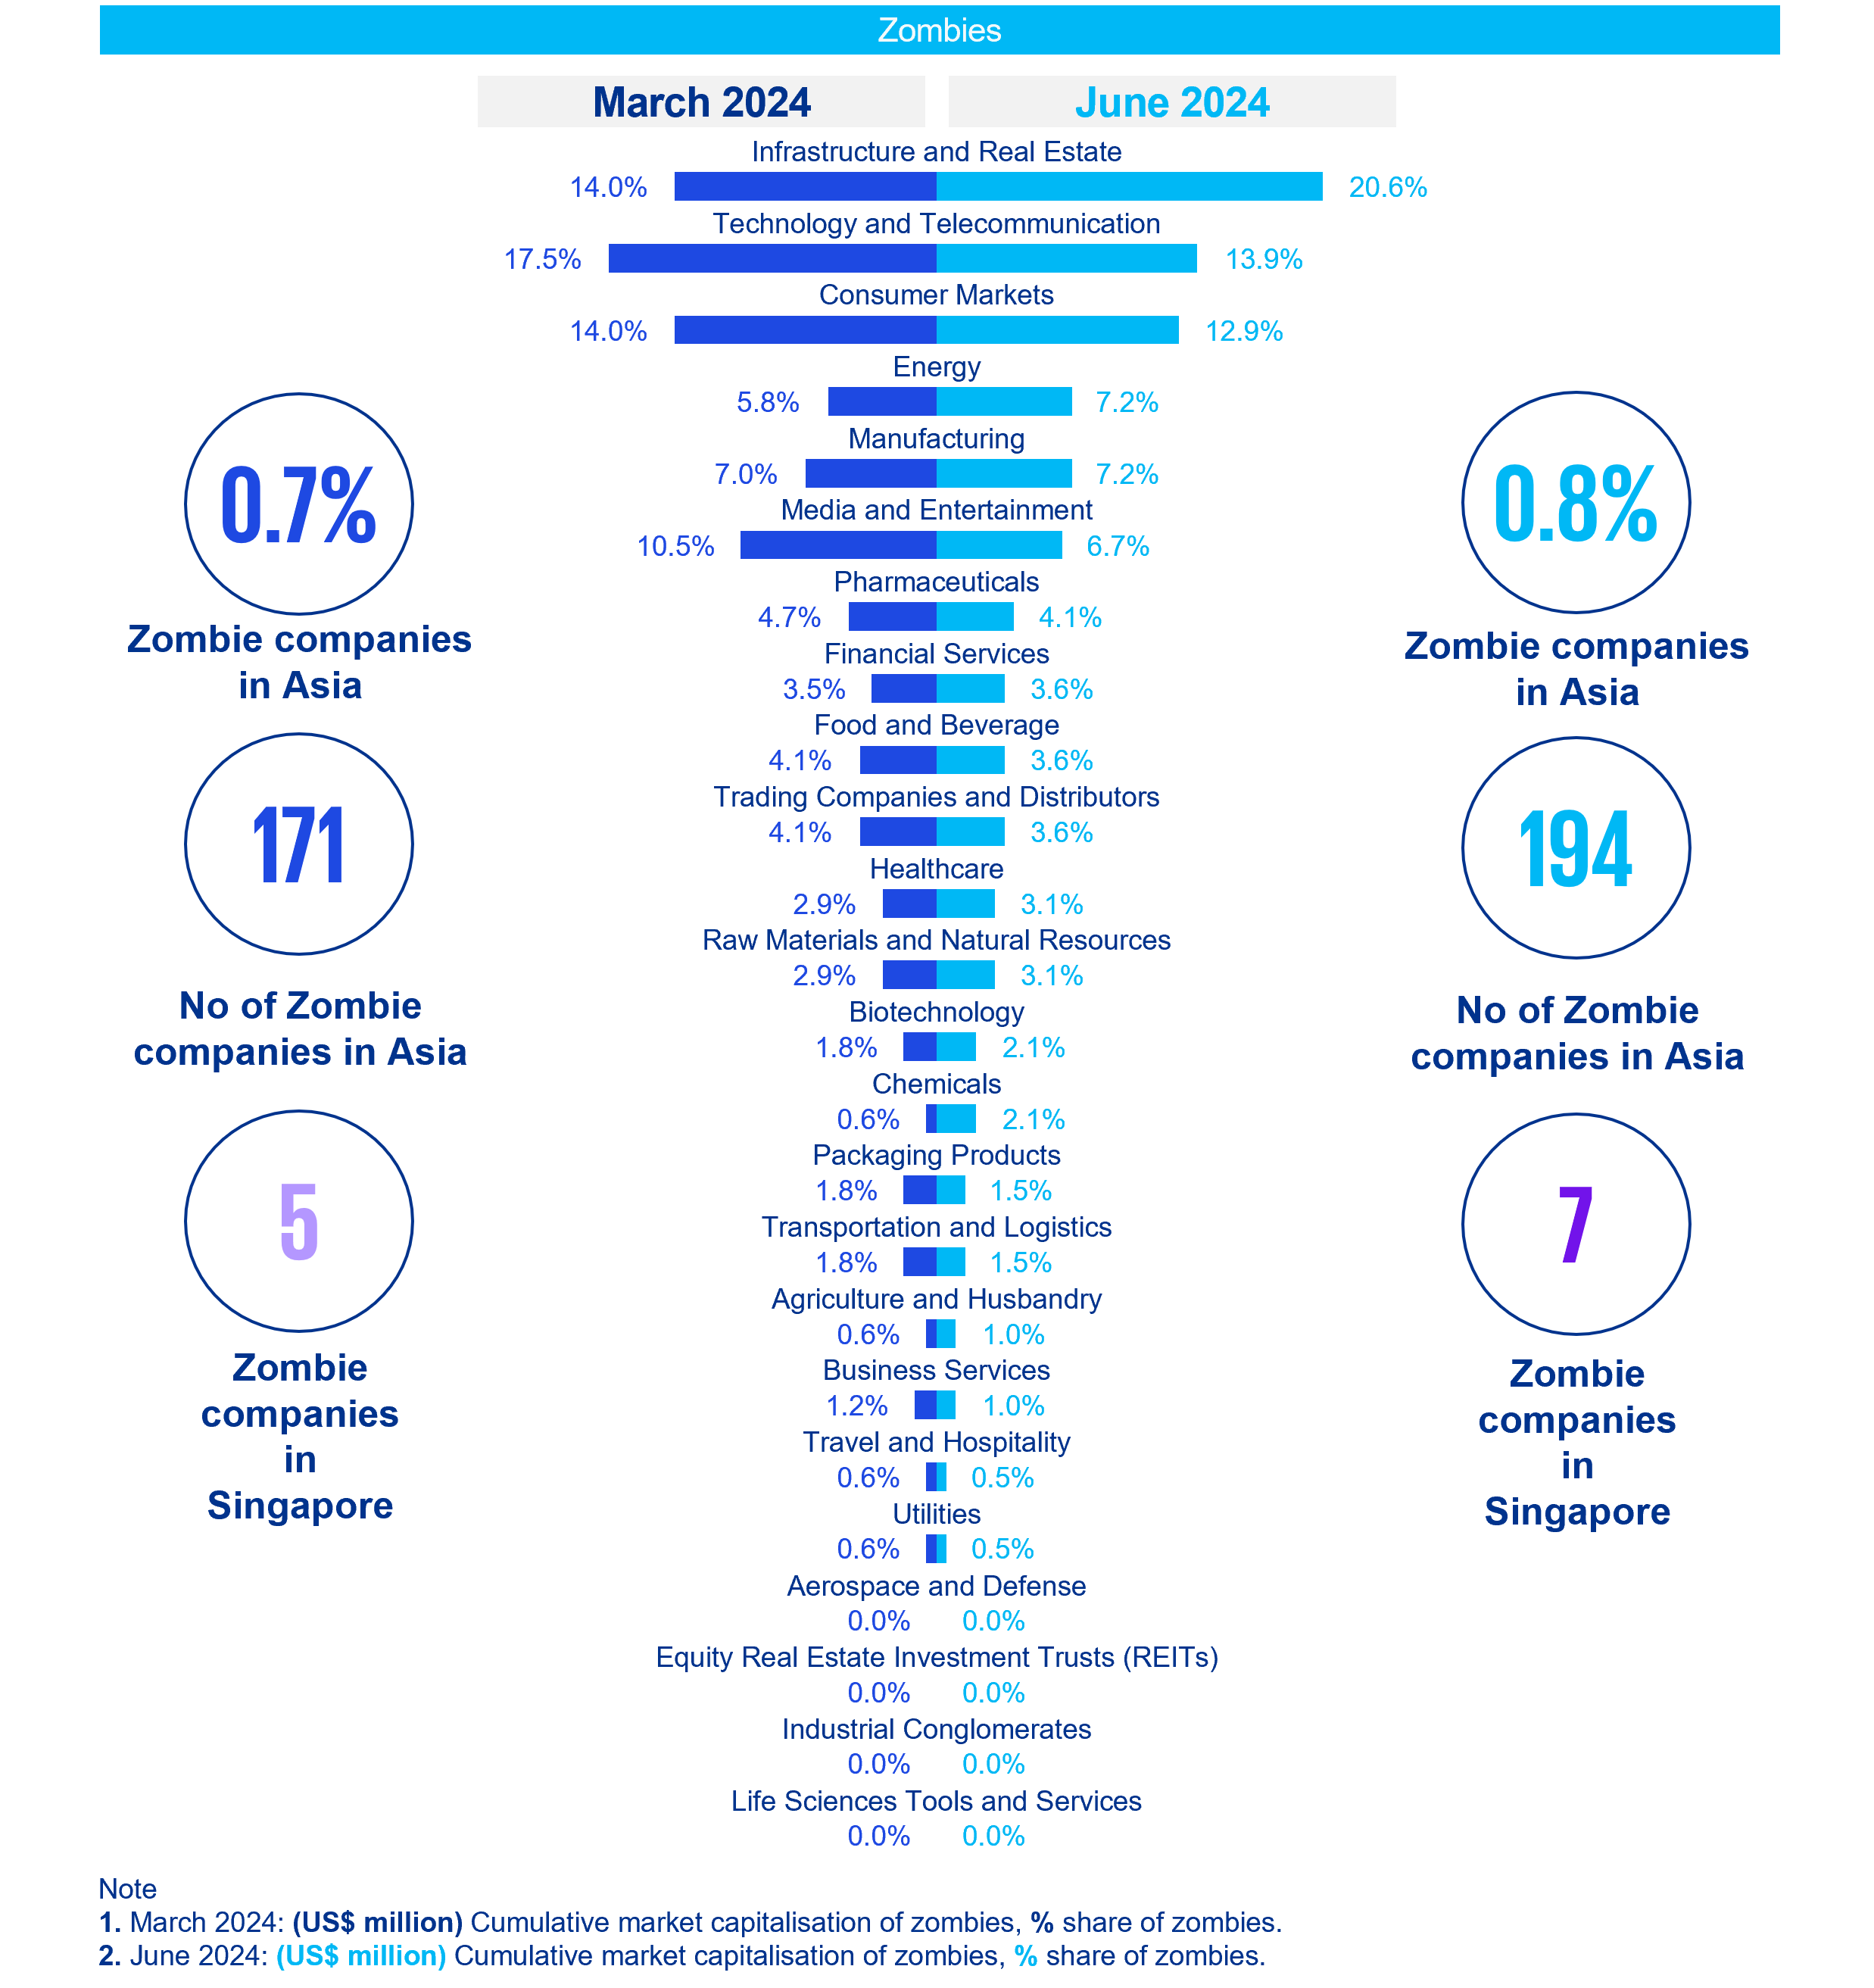
- In Asia, the count of zombies has grown each quarter, rising from 171 in 1Q24 to 194 in 2Q24. The leading sectors with the most significant shares of zombies are Infrastructure and Real Estate at 20.6%, followed by Technology and Telecommunications at 13.9%, and Consumer Markets at 12.9%.
- Singapore’s count of zombies similarly increased from 5 to 7 in 2Q24. Sectors reporting zombies are Technology and Telecommunication (3), Infrastructure and Real Estate (2), Trading Companies and Distributors (1) and Media and Entertainment (1).
Trends of Zombies in the KPMG FPI
About KPMG FPI
The KPMG FPI is a metric used to measure a company’s financial health by its ‘probability to default’. The analysis has been prepared using John Y. Campbell, Jens Hilscher, and Jan Szilagyi’s probability to default formula which takes into account financial information and market data. The KPMG FPI score ranges from 0 - 100. The lower the KPMG FPI score, the more likely a company is to default. In contrast, the higher the score, the less likely it is to default. In this analysis, released every three months, we analyse the KPMG FPI score movements of publicly listed companies in Singapore (following the reporting season of full year and half year results) to draw insights into corporate health across the Singaporean economy.
KPMG FPI combines both market and financial information to determine a company’s relative financial health. KPMG believes that combining the two types of information detects deteriorating corporate health more effectively than either source alone.
Global analysis
The global version of this tool is also available.
How we can help
To understand your company’s current index score, or to uncover deeper insights about specific markets or segments, contact us today. KPMG’s global network of professionals have the data, sector, and geographic expertise to help you understand your score and tie it back to your business needs. Whether it is benchmarking, identifying targets, comparing sectors, or looking for trends over time, KPMG professionals can connect you to the information you need to capitalise on your opportunities.