Capital market performance
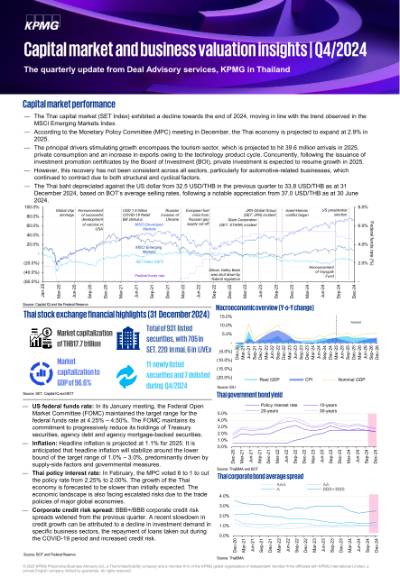
- The Thai capital market (SET Index) exhibited a decline towards the end of 2024, moving in line with the trend observed in the MSCI Emerging Markets Index.
- According to the Monetary Policy Committee (MPC) meeting in December, the Thai economy is projected to expand at 2.9% in 2025.
- The principal drivers stimulating growth encompass the tourism sector, which is projected to hit 39.6 million arrivals in 2025, private consumption and an increase in exports owing to the technology product cycle. Concurrently, following the issuance of investment promotion certificates by the Board of Investment (BOI), private investment is expected to resume growth in 2025.
- However, this recovery has not been consistent across all sectors, particularly for automotive-related businesses, which continued to contract due to both structural and cyclical factors.
- The Thai baht depreciated against the US dollar from 32.5 USD/THB in the previous quarter to 33.8 USD/THB as at 31 December 2024, based on BOT’s average selling rates, following a notable appreciation from 37.0 USD/THB as at 30 June 2024.

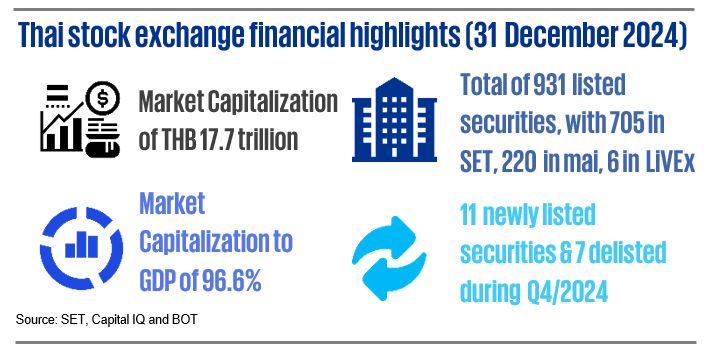
- US federal funds rate: In its January meeting, the Federal Open Market Committee (FOMC) maintained the target range for the federal funds rate at 4.25% – 4.50%. The FOMC maintains its commitment to progressively reduce its holdings of Treasury securities, agency debt and agency mortgage-backed securities.
- Inflation: Headline inflation is projected at 1.1% for 2025. It is anticipated that headline inflation will stabilize around the lower bound of the target range of 1.0% – 3.0%, predominantly driven by supply-side factors and governmental measures.
- Thai policy interest rate: In February, the MPC voted 6 to 1 to cut the policy rate from 2.25% to 2.00%. The growth of the Thai economy is forecasted to be slower than initially expected. The economic landscape is also facing escalated risks due to the trade policies of major global economies.
- Corporate credit risk spread: BBB+/BBB corporate credit risk spreads widened from the previous quarter. A recent slowdown in credit growth can be attributed to a decline in investment demand in specific business sectors, the repayment of loans taken out during the COVID-19 period and increased credit risk.
Source: BOT and Federal Reserve
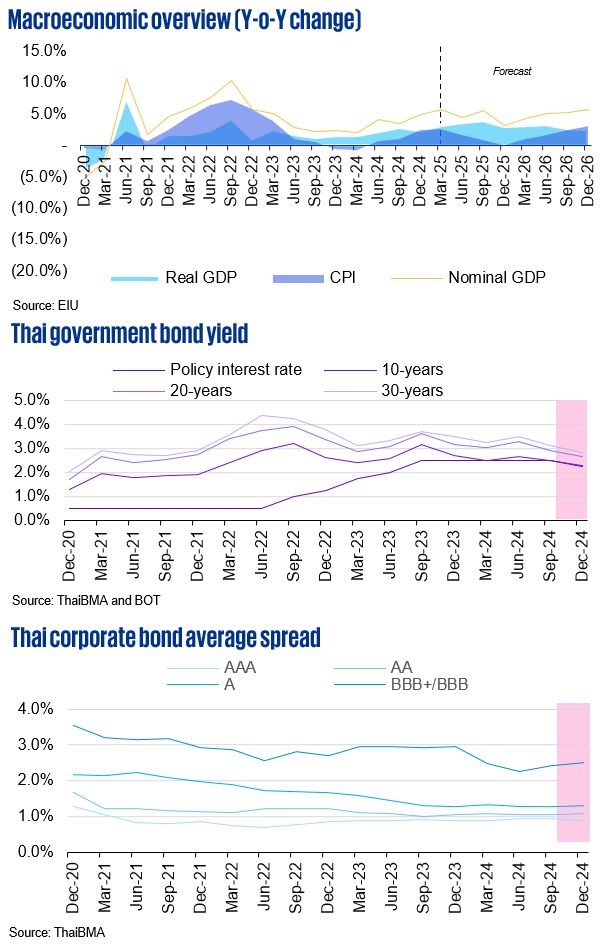
SET valuation metrics by sector (last 5 quarters)
The SET has eight key sector categories for listed entities. The three most-common valuation multiples across 5 quarters in these sectors illustrate movement due to both economic fundamentals and the impact of global events on market sentiment.
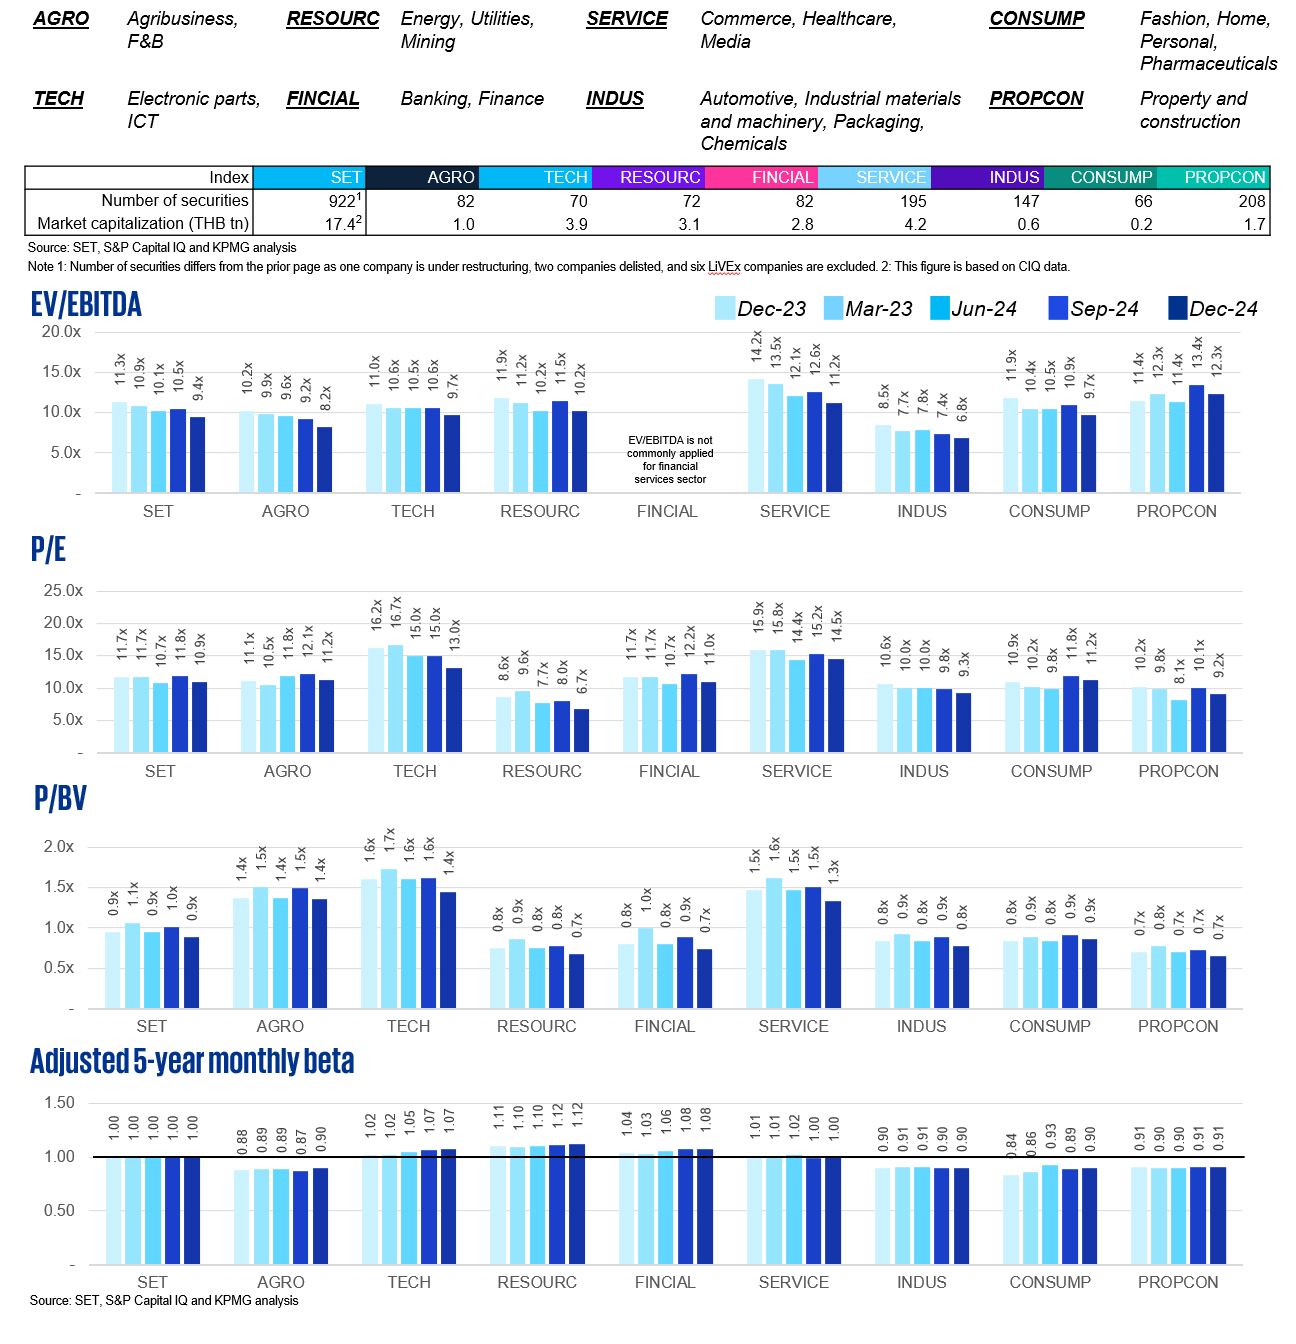
The multiples in Q4/2024 dropped from the previous quarters for all sectors, corresponding with the decline in the stock market return.
Sector beta represents the undiversified risk of a sector. The higher the beta, the riskier it is for that specific sector. The betas have been stable across sectors, except for AGRO, where the beta increased.

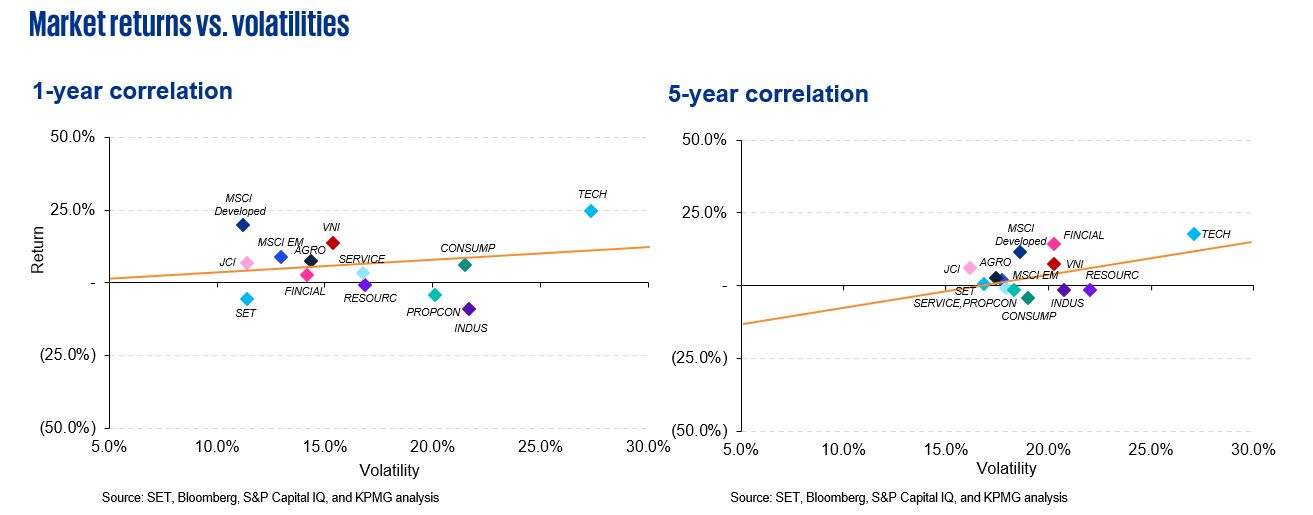
- Over the course of both one-year and five-year observational periods, the SET consistently trailed all other indices under analysis. When considering one-year annualized daily returns, the MSCI Developed logged the highest absolute returns and displayed superior performance after volatility adjustments, while the SET Index showed a negative return. In Thailand, the TECH sector markedly outperformed all other market sectors over the one-year and five-year periods.
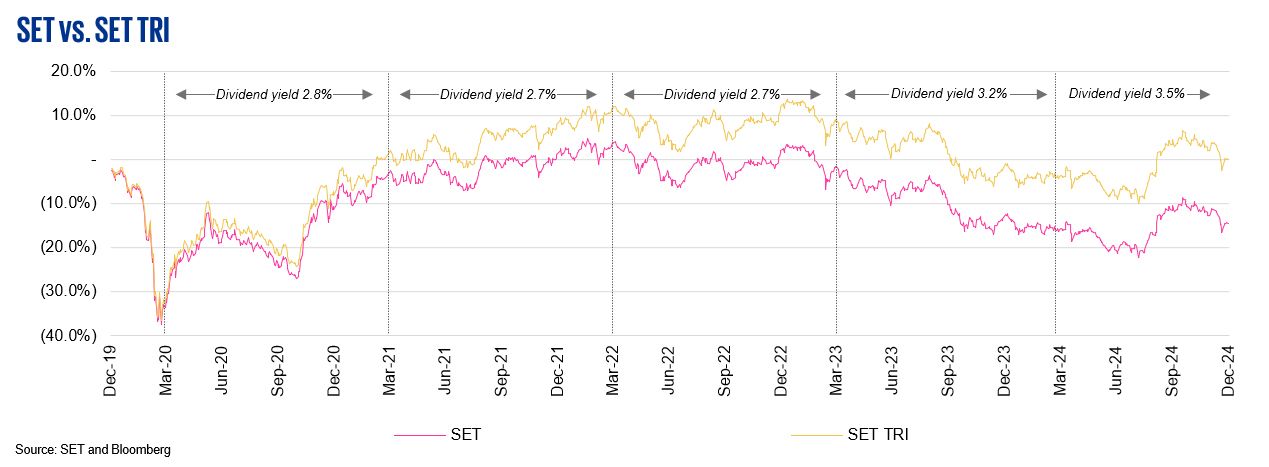
- Total return index (TRI) is an index that measures the total return from investing in securities. It comprises (1) a return arising from the change in value of the securities or “capital gain/loss”, and (2) dividends paid, assuming they are reinvested in the securities.
- At 3.5%, the 2024 dividend yield is the highest since 2020.
Data criteria
Thailand valuation multiples by sector
- The SET sector classification serves as the principal criterion for the illustrated sectors.
- The sector valuation multiples and beta are based on the respective median.
- 12-month trailing multiples are derived from Q4/2023 to Q4/2024.
- Q4/2024 multiple is based on the latest available financial statement information as at Q3/2024.
- Data in historical periods may change according to Capital IQ’s retrospective adjustments.
Regression on returns and volatilities
- The total number of trading days per year is assumed to be 252 days.
- The period in the study is 1 January 2020 – 31 December 2024.
SET and SET TRI
- Annual dividend yields are based on dividend yields from Bloomberg.
KPMG Deal Advisory
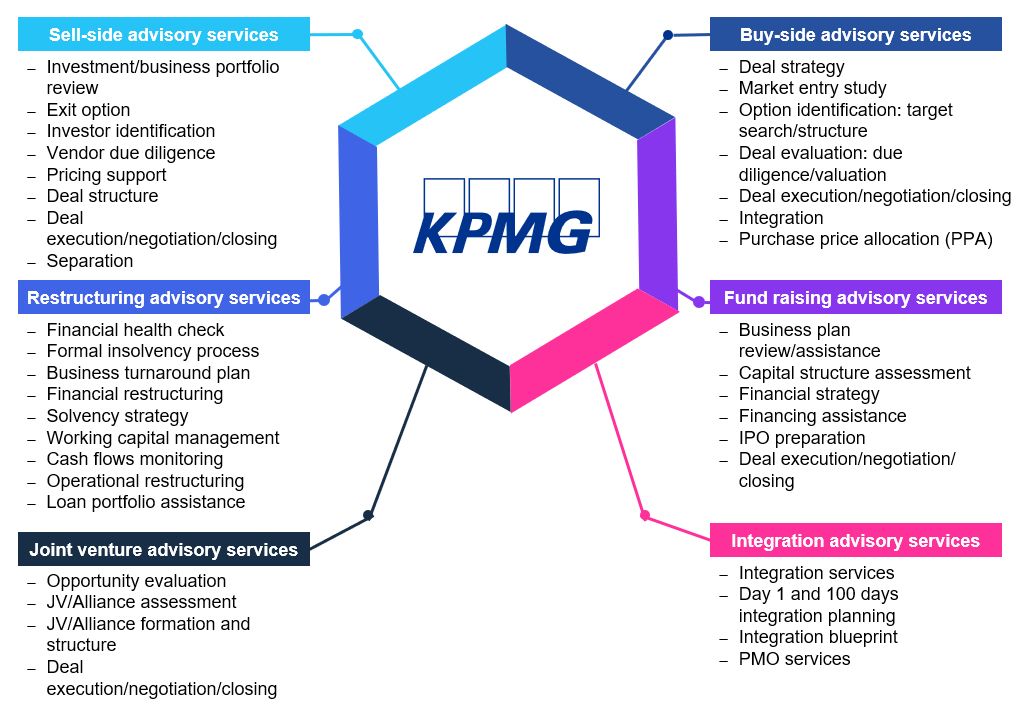
"KPMG provides a full range of valuation services for all sell-side, buy-side, tax restructuring, fund raising, and joint venture transactions."
Key contacts
Connect with us
- Find office locations kpmg.findOfficeLocations
- kpmg.emailUs
- Social media @ KPMG kpmg.socialMedia

