Capital market performance
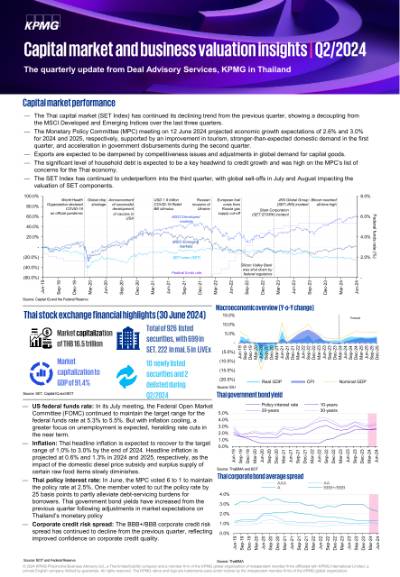
- The Thai capital market (SET Index) has continued its declining trend from the previous quarter, showing a decoupling from the MSCI Developed and Emerging Indices over the last three quarters.
- The Monetary Policy Committee (MPC) meeting on 12 June 2024 projected economic growth expectations of 2.6% and 3.0% for 2024 and 2025, respectively, supported by an improvement in tourism, stronger-than-expected domestic demand in the first quarter, and acceleration in government disbursements during the second quarter.
- Exports are expected to be dampened by competitiveness issues and adjustments in global demand for capital goods.
- The significant level of household debt is expected to be a key headwind to credit growth and was high on the MPC’s list of concerns for the Thai economy.
- The SET Index has continued to underperform into the third quarter, with global sell-offs in July and August impacting the valuation of SET components.

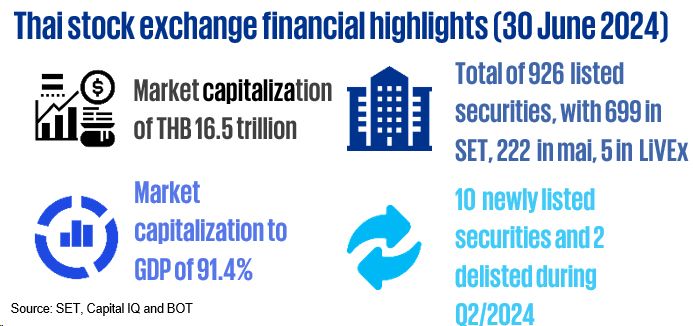
- US federal funds rate: In its July meeting, the Federal Open Market Committee (FOMC) continued to maintain the target range for the federal funds rate at 5.3% to 5.5%. But with inflation cooling, a greater focus on unemployment is expected, heralding rate cuts in the near term.
- Inflation: Thai headline inflation is expected to recover to the target range of 1.0% to 3.0% by the end of 2024. Headline inflation is projected at 0.6% and 1.3% in 2024 and 2025, respectively, as the impact of the domestic diesel price subsidy and surplus supply of certain raw food items slowly diminishes.
- Thai policy interest rate: In June, the MPC voted 6 to 1 to maintain the policy rate at 2.5%. One member voted to cut the policy rate by 25 basis points to partly alleviate debt-servicing burdens for borrowers. Thai government bond yields have increased from the previous quarter following adjustments in market expectations on Thailand’s monetary policy
- Corporate credit risk spread: The BBB+/BBB corporate credit risk spread has continued to decline from the previous quarter, reflecting improved confidence on corporate credit quality.
Source: BOT and Federal Reserve
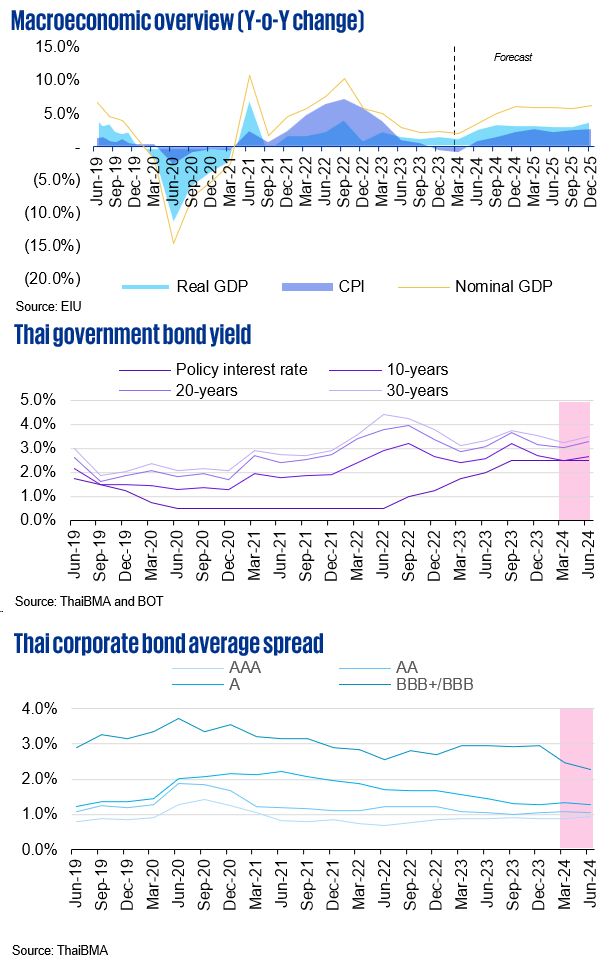
SET valuation metrics by sector (last five quarters)
The SET has eight key sector categories for listed entities. The three most-common valuation multiples across five quarters in these sectors illustrate movements due to both economic fundamentals and the impact of global events on market sentiment.
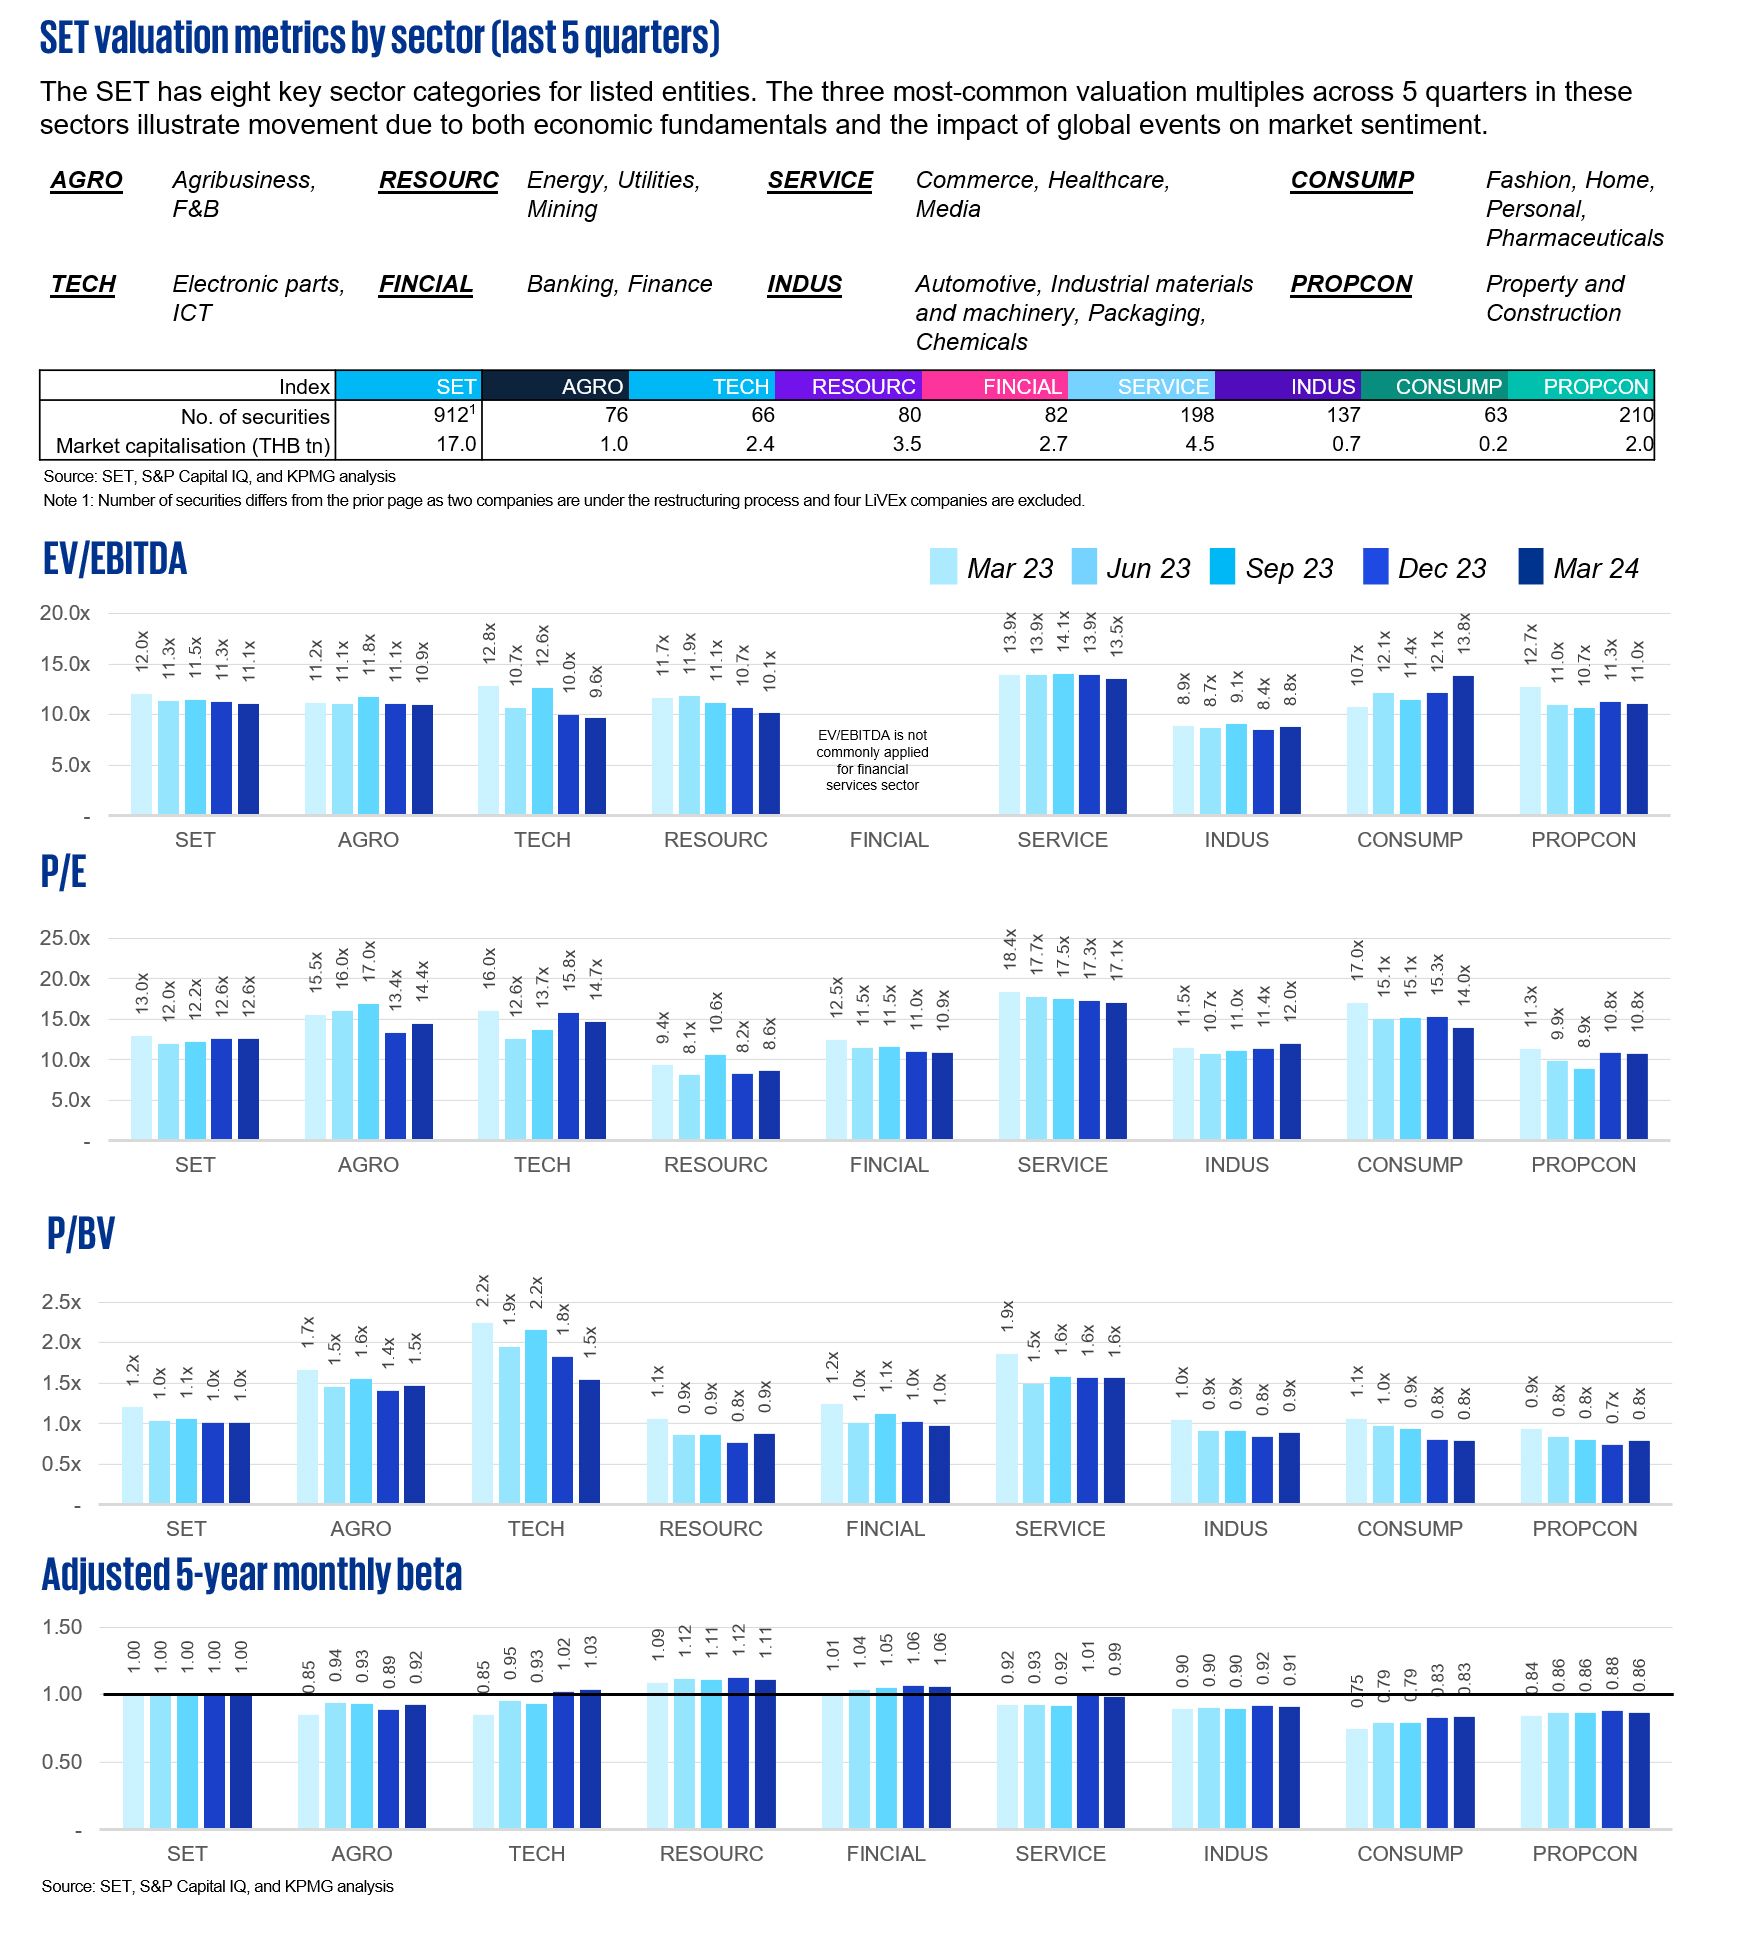
The multiples in Q2 2024 show a declining trend from the previous quarter in all of the sectors, except AGRO.
Sector beta represents the undiversified risk of a sector. The higher the beta, the riskier it is for that specific sector. The betas have increased across all sectors, except AGRO and PROPCON, indicating higher volatility in the equity market.

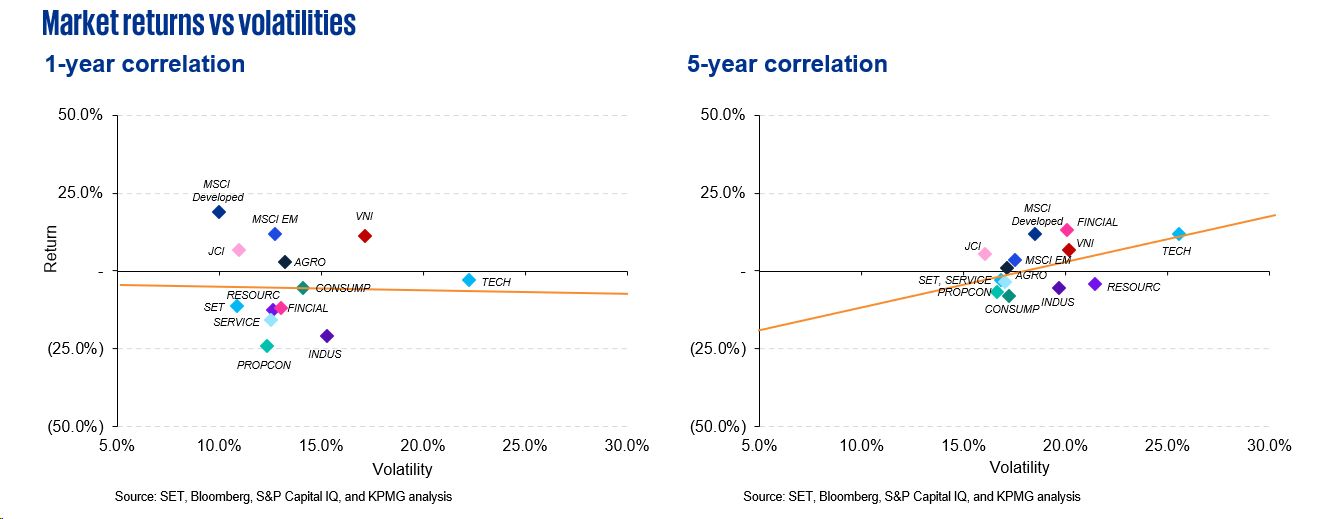
- The SET lagged behind all other illustrated indices over the 1-year and 5-year observation periods. The MSCI Developed recorded the best absolute and volatility-adjusted returns.
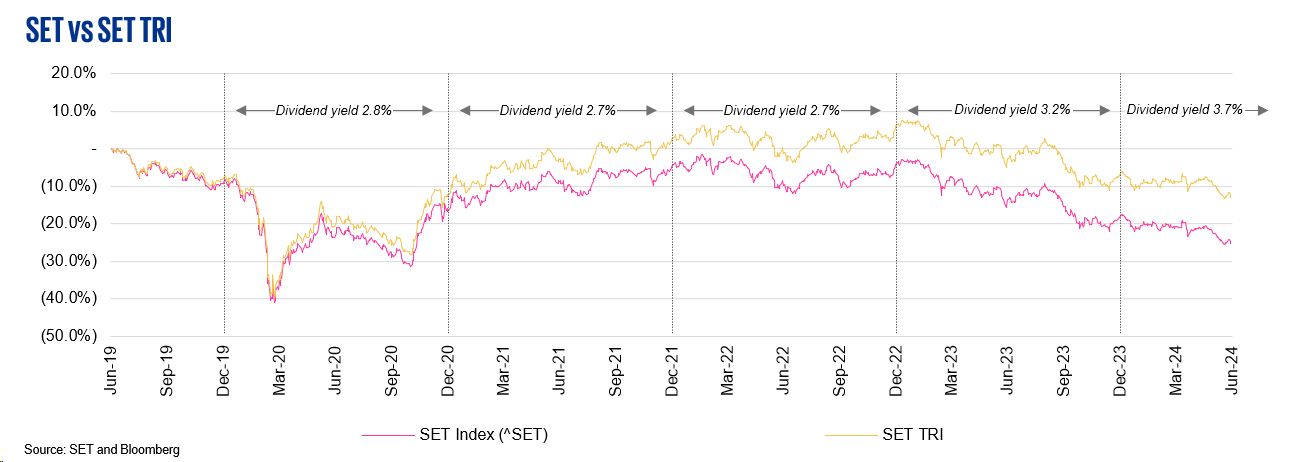
- The Total return index (TRI) is an index that measures the total return from investing in securities. It comprises (1) a return arising from the change in value of the securities or “capital gain/loss” and (2) dividends paid, assuming they are reinvested in the securities.
- At 3.7%, the 2024 dividend yield is the highest since 2020.
Data criteria
Thailand valuation multiples by sector
- The SET sector classification serves as the principal criterion for the illustrated sectors.
- The sector valuation multiples and beta are based on the respective median.
- 12-month trailing multiples are derived from Q2 2023 to Q2 2024.
- The Q2 2024 multiple is based on the latest available financial statement information as at Q1 2024.
- Data in historical periods may change according to Capital IQ’s retrospective adjustments.
Regression on returns and volatilities
- The total number of trading days per year is assumed to be 252 days.
- The period in the study is 1 July 2019 – 30 June 2024.
SET and SET TRI
- Annual dividend yields are based on dividend yields from Bloomberg.
KPMG Deal Advisory
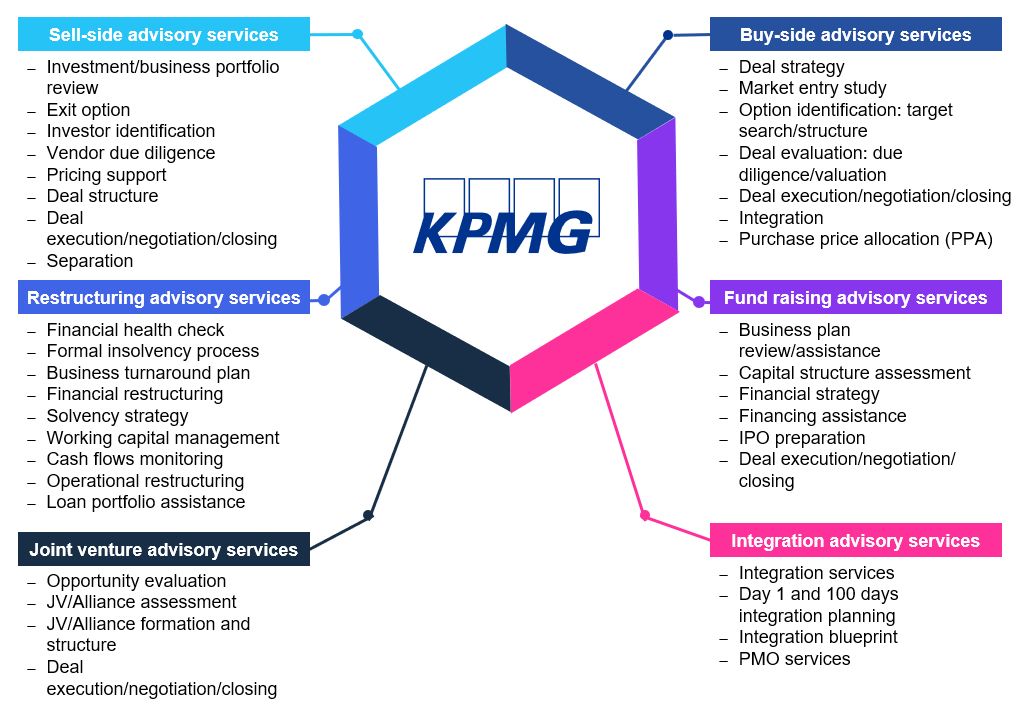
"KPMG provides a full range of valuation services for all sell-side, buy-side, tax restructuring, fund raising, and joint venture transactions."
Key contacts
Connect with us
- Find office locations kpmg.findOfficeLocations
- kpmg.emailUs
- Social media @ KPMG kpmg.socialMedia

