
2025 has already proven to be a hectic geopolitical year. The looming trade war, global conflicts, geopolitical fragmentation, and technological developments are the main drivers of macrofinancial stress for banks — affecting credit risk, market volatility, operational resilience, and capital adequacy. For the Netherlands, these developments coincide with a domestic political crisis, limiting the government's ability to influence key international negotiations, such as those with the United States and within NATO. DNB urges financial institutions to identify geopolitical risks, strengthen resilience, and maintain buffers to mitigate potential financial disruptions. It is essential that banks develop the capability to effectively manage these risks. This can be approached through a four-step framework: eliciting events and framing scenarios, quantifying financial impacts, responding with strategic and tactical planning, and monitoring scenarios and risk drivers ensuring ongoing relevance. This paper aims to inform the design of economic scenarios for regulatory stress testing (e.g. DNB, ECB), internal planning, and ICAAP exercises by linking geopolitical risks to macroeconomic variables.
Key Geopolitical Risks 2025
This analysis presents the key geopolitical threats that Dutch banks face in the short and medium term.
Top geopolitical risks
1. Trade wars:
US tariffs on European and Dutch exports
Counter-tariffs from the European Union on US goods
Global trade tensions affecting local trade
2. Global conflicts:
Russia-Ukraine war developments
Middle East Conflicts
Escalating China-Taiwan friction
Greenland geopolitical tensions
US-China rivalry over Panama Canal
Expansion of ungoverned regions
3. Geopolitical fragmentation:
Decline of international institutions
Shifting global alliances
Deepening EU political divisions
Cultural divides affecting corporate positioning
4. Technological developments:
Large increase in cyber threats amid global tensions
Disruptions in IT supply chains
Race for dominance in GenAI and semiconductors
1. Trade Wars
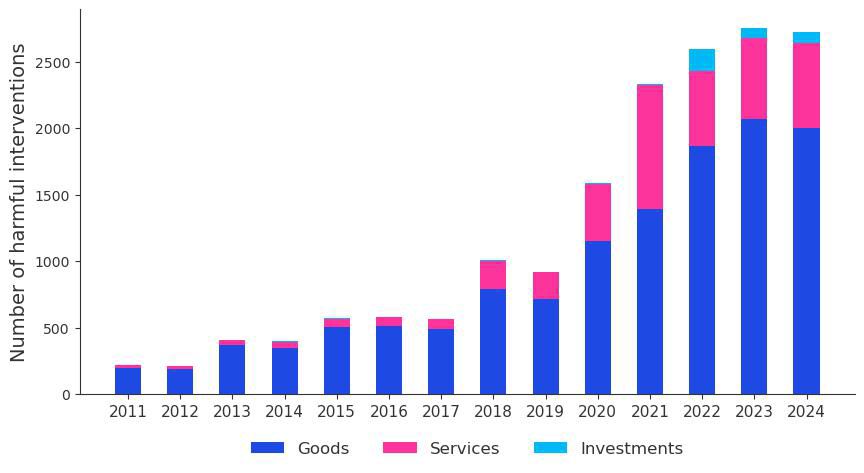
Figure 1. Number of Trade Restrictions Imposed Annually Worldwide Sources: Global Trade Alert, and KPMG-staff calculation
Explosion in trade restrictions
Restrictions on trade have greatly increased in recent years, after declining during most of the 20th century. This trend toward protectionism has been further amplified by President Donald Trump's plans to impose more tariffs on imports. The impact on the Dutch economy can be seen through three key channels:
- US tariffs on Dutch exports
- Counter-tariffs from the Netherlands
- Global trade tensions
The European Central Bank's June 2025 projections outline a severe scenario resulting in a drop in the euro area of the GDP growth rate to 0.5% in 2025, 0.7% in 2026 and 1.1% in 2027, cumulatively about 1 percentage point below GDP growth rate in the baseline.
As an open and export-dependent economy, the Netherlands is sensitive to these developments. The Dutch manufacturing industry takes the biggest hit, while some parts of the services sector grow.
Although only around 7% of Dutch goods exports went to the United States in 2024, US protectionist policies could significantly damage the Dutch economy, particularly manufacturing sectors such as machinery, electronics, and vehicles. Direct losses from reduced US exports (dark blue) and indirect losses from supplying other exporting countries (light blue) are significant. Additional effects include general equilibrium impacts (purple), which capture economy-wide shifts driven by substitution elasticity—how demand reallocates across products as trade costs change, and domestic trade diversion (pink), where increased US production boosts demand for some Dutch intermediate products, for instance in the metal sector. The positive effect for those Dutch service sectors like telecom, aviation, and rental is that higher wages and production costs in the US due to import tariffs make American companies less competitive globally, giving Dutch providers an advantage in the market. The analysis examined the potential impact of 10% and 25% tariffs on Dutch production.
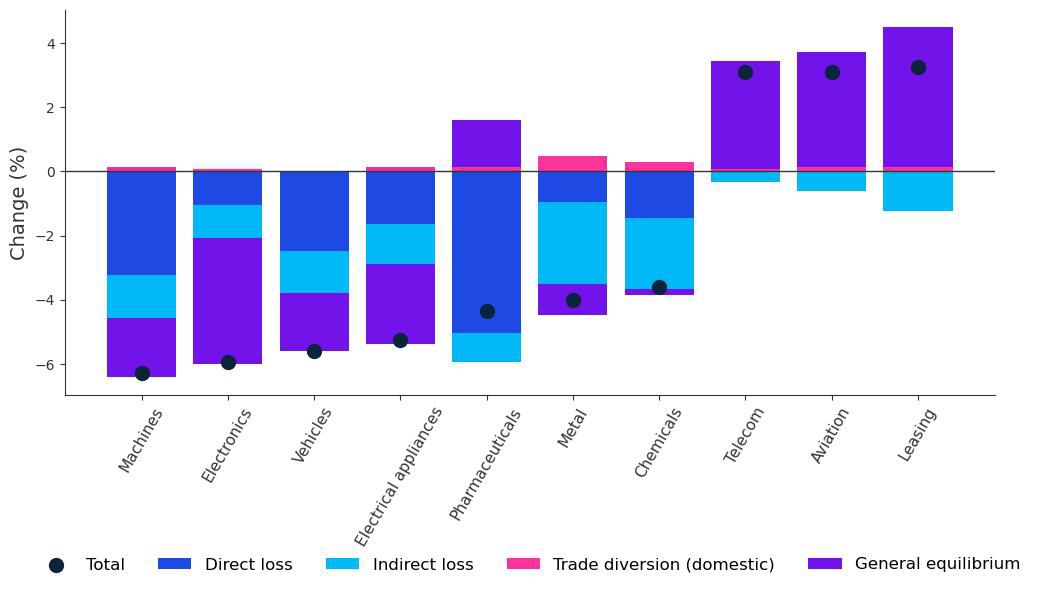
Figure 2. Potential Impact on Dutch Production of 10% U.S. Import Tariffs
Sources: The CPB Netherlands Bureau for Economic Policy Analys
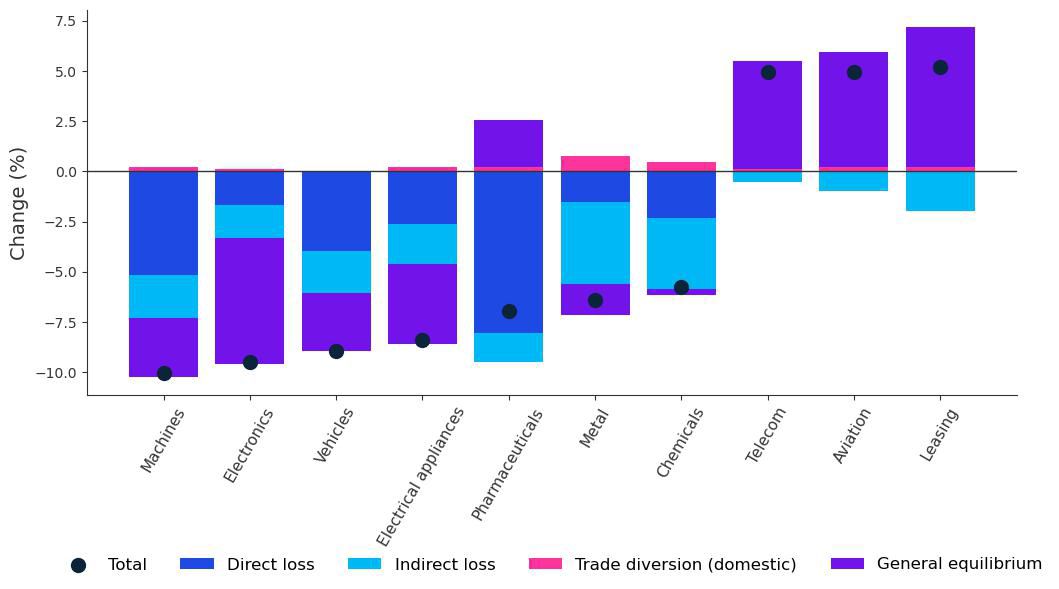
Figure 3. Potential Impact on Dutch Production of 25% U.S. Import Tariffs
Sources: The CPB Netherlands Bureau for Economic Policy Analysis and KPMG-staff calculation
The following overview reflects the latest developments as of the date of publication, showcasing significant tariff announcements.
Trade tariffs update
- Feb 1: The US announces 25% tariffs on all Mexican and Canadian imports (except 10% for Canadian oil/energy), effective Mar 4, later exempting USMCA-compliant goods (~50% of Mexican, 38% of Canadian imports). Also announces 10% tariff on general imports from China (effective Feb 4) and ends duty free treatment for low-value Chinese goods (effective May 2).
- Feb 4: China imposes 15% tariffs on US coal, LNG; 10% on crude oil and machinery (effective Feb 10). Launches antitrust probes; blacklists PVH Corp. and Illumina.
- Feb 10: The US raises tariffs on all iron, steel, and aluminum products to 25% globally (effective Mar 12).
- Mar 4: The US sharply increases China tariff from 10% to 20% (effective immediately). China retaliates with 10–15% tariffs on various US agricultural products (effective Mar 10) and bans US log imports. Canada announces 25% tariffs on C$155B worth of US goods. Tariffs on C$30B take effect immediately; the rest to follow in phases.
- Mar 12: Canada targets US steel, aluminum, tools, electronics, and other goods with 25% tariffs (effective Mar 13).
- Mar 26: The US imposes 25% global tariffs on all imported passenger cars, trucks, and select auto parts (effective Apr 3).
- Apr 2: "Liberation Day" – The US imposes 10% baseline tariffs (effective Apr 5) and announces higher reciprocal tariffs for selected countries (effective Apr 9), including a 20% tariff on EU goods, affecting the Netherlands.
- Apr 3: Canada announces 25% tariffs (effective Apr 9) on US vehicle imports that are non-USMCA compliant, as well as on non-Canadian/Mexican content in USMCA-compliant vehicles.
- Apr 4: In response to a new 34% US tariff on Chinese goods, China announces a matching 34% tariff on all US goods (effective Apr 10).
- Apr 5: EU announces phased retaliation on €26B U.S. goods – starting with reinstating 2018 tariffs, adding new duties on agri-products, alcohol, textiles, electronics (starting Apr 15).
- Apr 8: The US escalates China tariffs with an extra 50% (effective Apr 10) due to China’s Apr 4 retaliation.
- Apr 9: The US announces a 90-day pause on most new tariffs, excluding China (tariffs rise to 125%). 20% tariff on EU goods is suspended. EU delays its planned retaliatory tariffs (Apr 15, May 15, Dec 1) pending negotiation outcomes. A day later the EU halts its reciprocal steel and aluminium tariffs for 90 days.
- Apr 11: China responds and increases its reciprocal tariffs on US products to 125%.
- Apr 11: The US exempts smartphones and other electronics from its 125% tariff rate. Tariffs on these goods are decreased to 20%.
- May 12: After negotiations between the US and Chinese officials, both countries agreed to decrease tariff rates. The US imposes 30% on most of Chinese goods, China applies a 10% tariff on most US goods.
- May 30: US increases imposed tariffs on steel and aluminum imports from 25% to 50% globally. The UK remained at 25% while it continued to negotiate a trade deal announced the previous month. (effective June 4).
2. Global Conflicts
2025 poses various geopolitical risks that could affect the Dutch economy, including ongoing conflicts, escalating tensions, and disruptions in critical regions and industries.
| Potential Developments in 2025 | Main impacts on Dutch Economy |
| Russia-Ukraine War: Continuing EU/NATO support Sanctions on Russia remain in place Ceasefire |
Increased defense and aid spending Trade with Russia limited due to sanctions Potential energy prices relief post-ceasefire |
| Middle East Instability: Conflict between Israel and Iran further escalated by US involvement Ongoing conflicts in Gaza, Syria, and Iraq Disruption of key trade routes (Red Sea, Suez Canal) |
Energy prices increase Higher shipping insurance costs |
| Taiwan-China Tensions: Escalating military activity in the Taiwan Strait Potential US and EU sanctions on China Disruption of key trade routes (Red Sea, Suez Canal) |
Supply chain disruptions for Dutch tech firms Delayed investment and rising trade risks |
| Ungoverned/Conflict-Prone Regions (e.g. Sahel, Afghanistan, Horn of Africa, India-Pakistan border, Syria): Rise in terrorism and organized crime Refugee flows to EU Spillover into neighboring countries |
Migration pressures on social systems Security costs and development setbacks Exposure to cyberattacks and illicit activity |
| Greenland Geopolitical Tensions: Risk of unilateral US actions escalating territorial tensions and militarization |
Long-term concern over strategic mineral access |
| Panama Canal Disruptions: Risk of US intervention altering chokepoint governance norms |
Shipping delays and higher costs for Dutch ports Strain on logistics and global supply chains |
3. Geopolitical Fragmentation
Amid fragmentation, the following potential global developments in 2025 could impact the Dutch economy and key sectors.
- Reduced US NATO commitment: Pushes EU countries, including the Netherlands, to reallocate budgets toward defense, potentially limiting fiscal room for public investment.
- Regulatory divergence and retreat from coordinated standards: US withdrawal from the Paris Agreement and ECB's looser climate stance signal a broader retreat from coordinated climate and ESG frameworks. Diverging regulation — on ESG and beyond — may erode the level playing field, disrupt fair competition, and restrict the free exchange of people, goods, and services. Legal enforceability gaps can further impact the cost of doing business and long-term investment certainty in the Netherlands.
- Shifting global alliances: New trade blocs and investment hubs outside traditional centers fragment global trade. The Netherlands faces risks to supply chain resilience and its position as a global logistics and investment hub.
- EU fragmentation and anti-EU sentiment: Electoral gains by nationalist parties increase uncertainty on joint policy responses and reduce support for deeper EU integration; complicates coordination on defense, energy, and fiscal policies. This is partly neutralized by rising US self-isolation, which reinforces the urgency of EU unity and may encourage closer coordination among remaining member states.
- Corporate positioning amid cultural divides: Growing polarization around gender and identity issues forces companies to make strategic choices between market positioning and internal cohesion. Divergent societal responses across regions may affect brand perception, talent retention, and access to international markets.
4. Technological pressures
A large increase in cyber threats and the race for technological dominance are impacting potential developments in 2025 with implications for the Dutch economy.
| Potential Developments in 2025 | Impact on Dutch Economy |
| Surge in Cyber and Infrastructure Threats Rise in state-sponsored and criminal cyberattacks targeting infrastructure and finance |
Increased operational risk for banks and insurers Growing investment in cybersecurity and protection of core digital infrastructure |
| Race for Technological Dominance Global race for AI leadership, dependence on foreign-owned cloud and satellite systems, fragmented governance, high capital demands |
Pressured to adopt AI rapidly while relying on foreign tech providers Strategic vulnerability may push investment in EU-owned cloud and satellite capabilities Risk of misalignment with evolving global regulatory standards |
| Spread of Misinformation Tech-enabled disinformation campaigns |
Potential for economic disruption Reputational risk |
Framework for Managing Geopolitical Risks
In a world where geopolitical instability is no longer episodic but structural, organizations must adopt a systematic framework to manage these risks effectively. The following structured approach outlines how to move from risk identification to actionable insights, and is designed for integration into key risk governance processes such as stress testing or the Risk Appetite Statement:
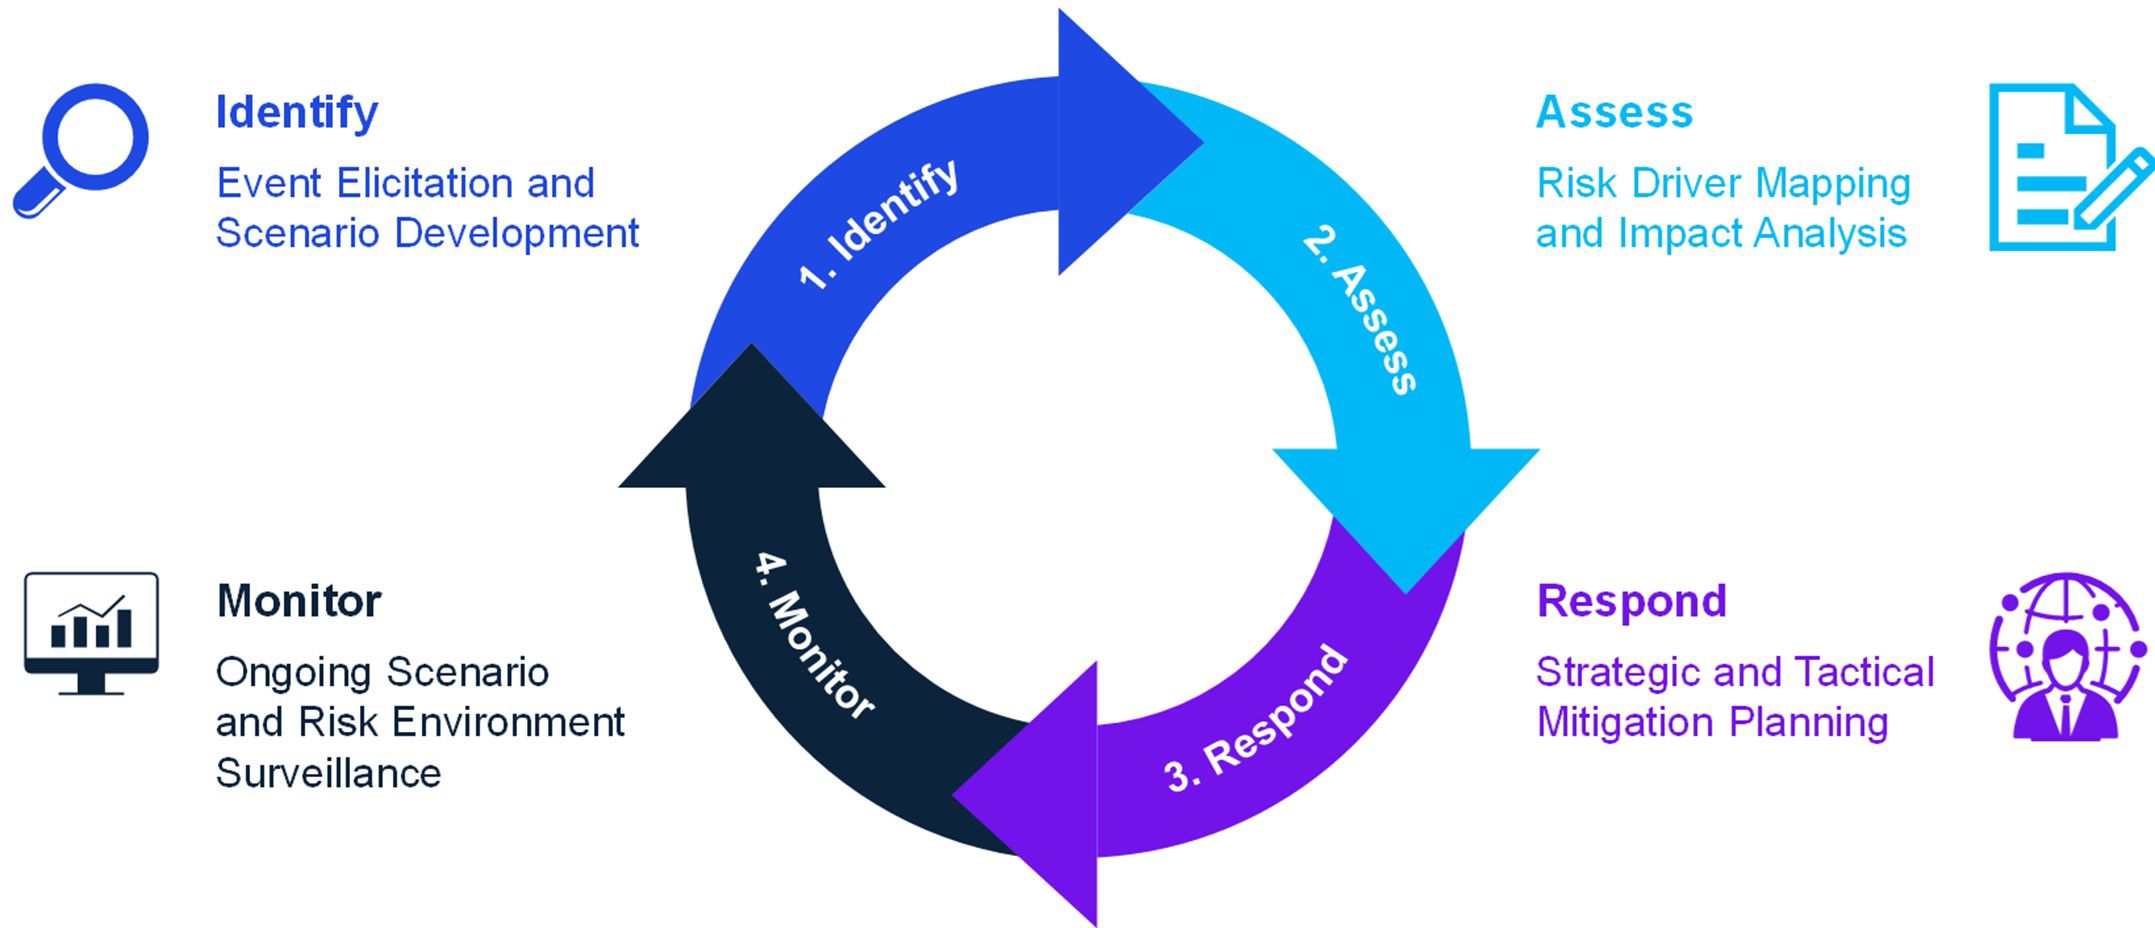
1. Identify – Event Elicitation and Scenario Framing
Goal: Systematically uncover potential geopolitical disruptions.
Activities:
- Open brainstorming (“event elicitation”)
- Organize events into scenarios with clear narratives
- Identify key macroeconomic parameters affected in each scenario
2. Assess – Scenario Quantification and Risk Driver Mapping
Goal: Understand how each scenario affects the institution.
Activities:
- Translate scenarios into macroeconomic variables (MEVs) using expert judgment and statistical tools (e.g. KPMG BVAR)
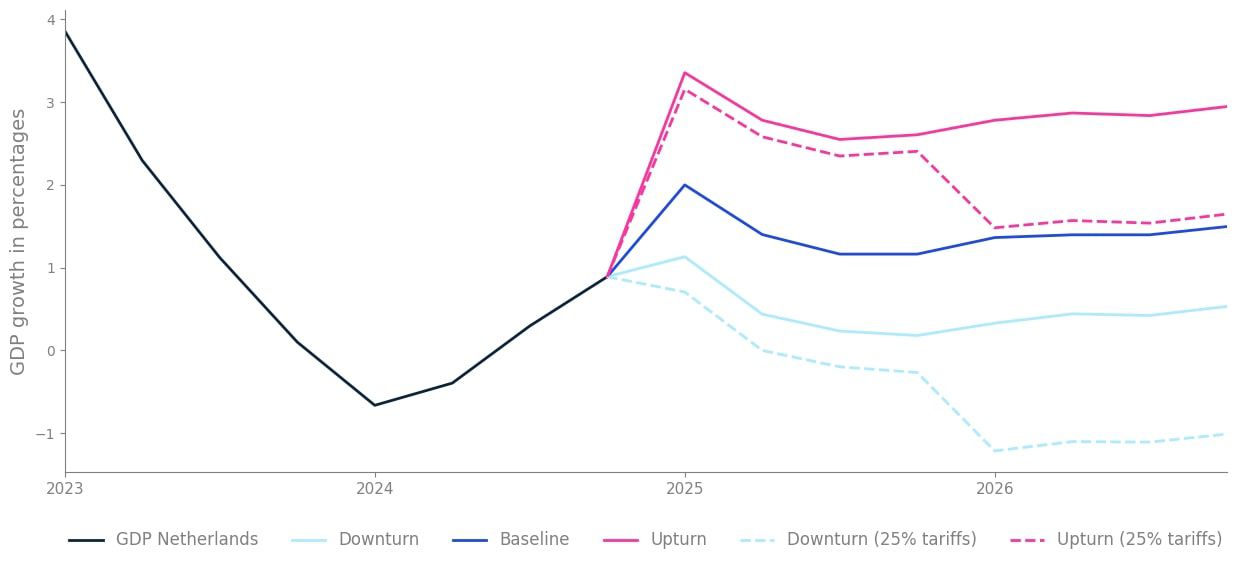
Figure 4. Forecasts of Dutch GDP under different scenarios in the event of a 25% tariff shock with a baseline anchored to DNB’s GDP Netherlands Baseline projection
Geopolitical tensions could affect Dutch trade directly and indirectly. Combining historical data and market consensus helps to estimate future Dutch GDP distribution. While market consensus considers some geopolitical risks, assessing alternative scenarios and preparing for potential disruptions is crucial. The example above uses a scaled trade war scenario from the DNB to adjust market consensus values and create an alternative GDP distribution. The dotted lines in the graph represent the potential Dutch GDP outcomes under a trade war scenario, illustrating how a 25% tariff imposition could shift GDP growth projections across different scenarios.
Source: KPMG BVAR model
- Map MEVs affected by scenarios to internal risk drivers used in models if they are not identical.
- Assess financial impact by applying stressed risk drivers in internal models.
3. Respond – Strategic and Tactical Planning
Goal: Define appropriate actions based on modelled scenario impact.
Activities:
- Mitigation measures as maintaining financial buffers, adjusting origination criteria, or applying targeted hedging instruments
- Strategic shifts such as portfolio reallocation
- Responses calibration to different risk appetites and capital planning needs
4. Monitor – Ongoing Scenario and Risk Driver Surveillance
Goal: Ensure relevance and timeliness of risk views.
Activities:
- Track geopolitical developments, market signals, and MEVs
- Regularly update scenario narratives and impact assessments
- Adjust models and mitigation actions dynamically
By following this structured approach, organizations — particularly those with international exposure and complex operations — can shift from reactive crisis management to proactive geopolitical risk governance.
Contact

Jonas van Nifterik
Consultant
KPMG in the Netherlands
Nobels Douwe
Consultant
KPMG in the Netherlands