There are established benchmarks for treasury costs, such as “cost as a percentage of revenue”, “FTEs per entity” and “cost per payment”. They are useful and provide an initial point of reference. However, a single benchmark is not enough to answer the question “How much should my treasury function cost?” because the same company can be classified very differently depending on the methodology used.

      A real, anonymized case from our project work illustrates this clearly. For the same company, two established sources, a cost comparison from a well-known benchmarking provider and a peer-group benchmark from a recognized strategy consulting firm, produced cost ranges that differed by more than 100%. Both results were understandable and supportable within their respective methodologies. For management, this means that the same company could operate a treasury function for around EUR 1 million or for EUR 2 million to EUR 2.5 million and cite a recognized benchmark in either case. Both figures are legitimate statements of what “the benchmark” says within the respective scope. However, neither source indicates what services sit behind the figure or what contribution the treasury function delivers in return.

      An isolated benchmark does not provide a robust budget figure. It becomes meaningful only when the company also considers its own circumstances. A cost comparison should therefore be supplemented by three steps: capture total costs accurately, normalize them within the appropriate peer range and calculate the value contribution transparently.

      The value contributed by a treasury function can significantly exceed its costs. The amount depends not only on revenue, but also on funding, liquidity, exposure, transaction volumes and the function’s starting level of maturity. Depending on the business model and starting position, a well-designed treasury function can make a substantial contribution to earnings, cash flow stability and capital efficiency. Given this leverage, the difference between a budget of EUR 1 million and EUR 2.5 million is no longer purely a cost issue. It is an investment decision. The illustrative calculations below show how this contribution can be composed.
      Step 1 – Total costs rather than the cost center

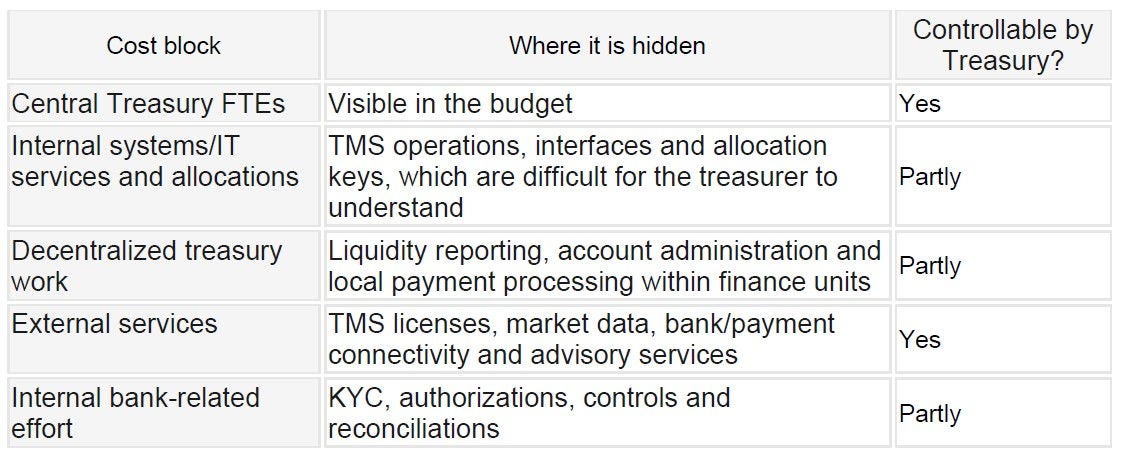
      A common mistake is to look only at the central treasury cost center. It rarely shows more than half the picture. Five cost blocks must be added together:


      Figure 1: Central treasury cost center

      Figure 1: Central treasury cost center
      Source: KPMG in Germany, 2026

      The decentralization paradox

      The third row is particularly revealing and reverses the intuitive assumption: a treasury function that appears “expensive” based on its cost center tends to require less decentralized work, while a seemingly “low-cost” treasury function leaves more tasks to local teams. A lean central treasury function often shifts work such as liquidity planning, account administration and local payment processing back to finance units. The central cost center appears low, but the work does not disappear. It merely becomes invisible and redundant.

      Example: If each of 40 entities performs local treasury tasks equivalent to 0.3 FTE, this represents 12 decentralized FTEs. Assuming illustrative average total costs of around EUR 80,000 per FTE, this produces almost EUR 1 million that does not appear in any treasury cost center. This amount can explain the difference between the “EUR 1 million” and “EUR 2 million” views in the benchmark discussion above. The more expensive central treasury function may be cheaper on a total-cost basis if it delivers the same service without forty instances of local duplication.

      The implication for assessment is clear: comparing two treasury functions based on their cost centers measures allocation logic, not efficiency. Only a total-cost calculation shows whether a low cost center reflects genuine efficiency or merely a shift into other budgets. It also reveals where centralization genuinely reduces costs: only when the local capacity released is actually removed or redeployed productively.

      Step 2 – Normalize within the peer range, not only by revenue

      Revenue explains neither the scope of services nor the number of entities, accounts, payments or risks. It is valid as one of several drivers, but it is insufficient as the sole measure. The peer range must be defined using structural drivers: countries and entities, scope of activities, bank accounts and banking relationships, payment, funding and investment volumes, degree of centralization, system landscape, existing financial risks and risk tolerance.

      Our Global Treasury Survey 2025 shows two things: resources tend to increase as scope grows, but the variation remains considerable. For functions covering fewer than two areas of responsibility, 67% of treasury teams operate with one to three FTEs. Even for functions covering seven areas of responsibility, the distribution ranges from one to three FTEs for 35% of companies to more than 25 FTEs for 27%.

      The same pattern appears for other drivers, including the number of bank accounts and the cost of the treasury system landscape.

      Individual metrics therefore show wide variation. They can indicate anomalies, but they are not suitable target values. Normalization should instead be relative, for example using the following metrics:

      • FTEs by revenue, entities, regions and activity covered
      • Bank accounts per entity; bank fees per account or payment volume
      • System costs per user/entity; internal system FTEs per system landscape
      • Decentralized treasury effort per entity

      Step 3 – The value contribution

      Two companies with identical exposure may devote very different levels of resources to risk mitigation. One consciously accepts risks, while the other measures them in detail and actively hedges them. Capital-markets orientation, funding structure, covenants and risk-bearing capacity can also shape the hedging strategy. A blanket statement that listed companies always hedge more than unlisted companies is therefore too simplistic. Although there is often greater pressure to limit earnings and cash flow volatility for investors and analysts, company-specific circumstances remain decisive.

      This is not an efficiency difference. It is a strategic decision.

      Costs without a corresponding benefit calculation show only half the picture. Yet not every euro spent on Treasury has the same effect. Treating all services collectively as “value contribution” undermines credibility with the CFO. Contributions should therefore be differentiated by the nature of their economic impact. This results in four categories:

      Value creation

      1. Revenue generation (value creation) – a new, P&L-positive contribution is created. A return-based assessment is appropriate. Examples: investing cash-pool surpluses, IHB net interest income and funding margins.

      2. Cost reduction (efficiency) – an existing cost block is reduced. Measurement is based on actual costs eliminated. Examples: lower bank fees through account reduction, fewer external payments and FX conversions through IHB netting and automation in payment processing.

      Required baseline

      3. Risk reduction (Value Protection) – existing value is protected against volatility. Measurement is based on risk metrics such as Cash Flow at Risk and hedge ratio, not return. A premium is deliberately paid. Examples: FX and commodity hedging and counterparty limits.

      4. Cost reduction (Efficiency) – an existing cost block is reduced. Measurement is based on actual costs eliminated. Examples: lower bank fees through account reduction, fewer external payments and FX conversions through IHB netting and automation in payment processing.

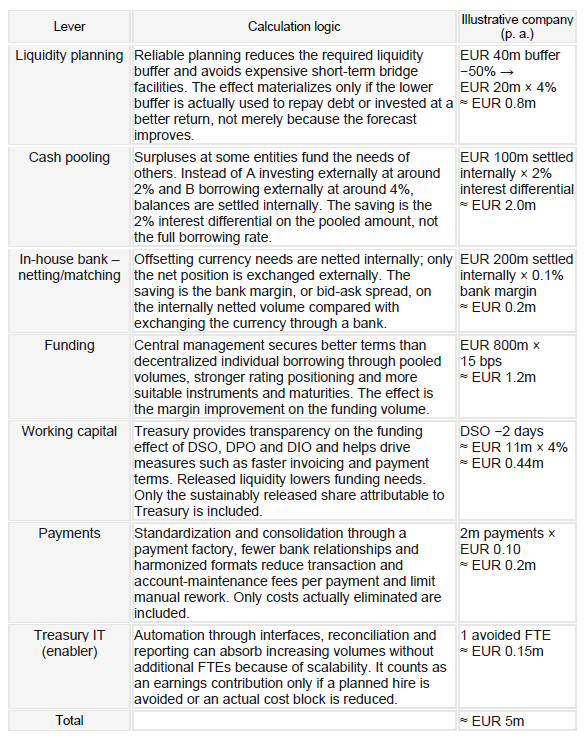
      To make the framework tangible, we apply it to an illustrative company: EUR 2 billion in revenue, 25 countries, 40 entities, multiple currencies and total treasury costs of around EUR 3 million.

      All values below are illustrative, intended to explain the approach and within a realistic order of magnitude. They do not replace a company-specific calculation. For readability, each lever is deliberately simplified and shows the central effect only. Other positive and partly offsetting effects are not included. The figures show gross potential. A company-specific calculation must consider implementation and ongoing incremental costs, tax, legal and regulatory restrictions, transfer pricing and overlaps between levers. In practice, an in-house bank operates through several channels at once; only the dominant effect is shown here. The method matters, not the second decimal place.


      Figure 2: Earnings contributions from value creation and cost reduction

      Figure 2: Earnings contributions from value creation and cost reduction
      Source: KPMG in Germany, 2026

      Two rules are non-negotiable for these figures:

      • Baseline rather than market movements. Falling market interest rates, for example, are not a Treasury achievement. The calculation should compare against the previous structure, a realistic alternative or comparable market offers, not against favorable market movements.
      • Realization rather than capacity. Better forecast accuracy is not a monetary benefit unless it leads to a different investment or funding decision. Processing time released in payments affects P&L only when costs are actually eliminated or recruitment is avoided. Otherwise, it is a capacity benefit and should be reported separately.

      Cash pooling and in-house banking generate benefits through several channels: avoided external funding, higher investment income, lower bank and transaction fees, fewer external payments, lower local process effort and, often underestimated, fewer FX conversions. Offsetting internal currency requirements do not have to be traded externally at the spread. A clean scope is essential: only volume that would genuinely have been converted externally without the in-house bank should be included.

      The result is the key point: these levers alone total around EUR 5 million. This is approximately 1.7 times the illustrative company’s total treasury costs of EUR 3 million and represents an order of magnitude that a well-designed treasury function can achieve.

      Contribution from the required baseline

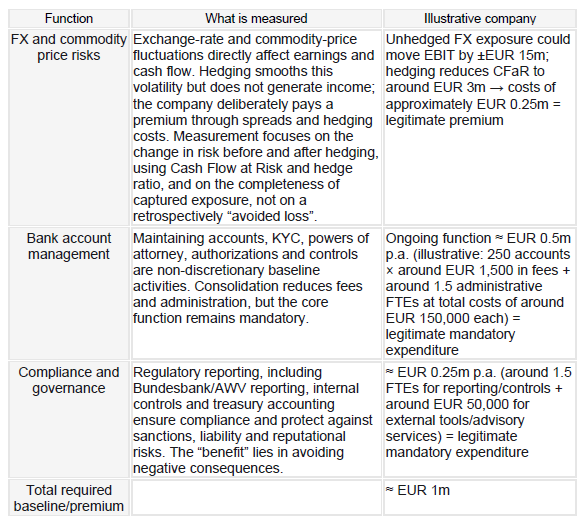
      No income is generated here. Instead, losses are prevented and compliance is ensured. These costs are not a justification problem. They represent an insurance premium and necessary hygiene. The functions themselves are not optional, but their costs must still be assessed against the scope of services, complexity and an efficient delivery model.


      Figure 3: Contribution from the required baseline

      Figure 3: Contribution from the required baseline
      Source: KPMG in Germany, 2026

      Two points are central to risk management. First, the value driver begins with complete identification of exposure, not only with the hedging transaction. Second, the contribution explicitly does not consist of generating trading gains. Nor should a retrospectively avoided loss be attributed entirely to Treasury. The meaningful measure is the change in risk before and after the measures.

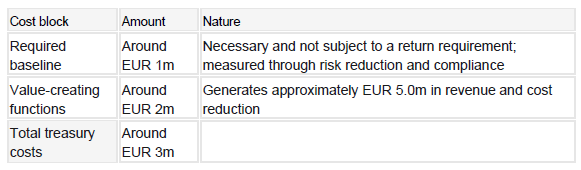
      The template: Net Treasury Contribution

      The EUR 3 million in total costs can be fully allocated:


      Figure 4: Net Treasury Contribution

      Figure 4: Net Treasury Contribution
      Source: KPMG in Germany, 2026

      This means that:

      approximately EUR 2.0 million in value-creating functions generates around EUR 5.0 million in revenue and cost reductions, a factor of approximately 2.5.

      It follows that:

      the costs of approximately 2.0 million EUR for value-adding functions are offset by approximately 5.0 million EUR in revenue and cost savings. This corresponds to a factor of about 2.5. 

      Mobilized liquidity, released capacity, contributions achieved jointly with Sales, Procurement or Accounting, for example at the point of sale, and non-monetizable management and resilience effects should be reported separately. This separation prevents liquidity, capacity and risk reduction from being presented as already realized earnings contributions.

      For the illustrative company:

      • Earnings contribution: EUR 5 million
      • Cost of value-creating functions: EUR 2 million (required baseline: EUR 1 million reported separately)
      • Surplus from value-creating functions: EUR 3 million before the required baseline

      This is where the benchmark discussion at the beginning falls apart: whether the cost center is EUR 1 million or EUR 3 million is not decisive on its own. What matters is that the net contribution is positive. The truly decisive point is that it is made transparent.

      The real question: how can this marginal benefit be determined for the specific setup?

      At its core, the following variables need to be estimated realistically for each lever:

      If the remaining potential is large, meaning the lever is clearly underused, and it can be realized with reasonable effort, the next euro is worthwhile. If the lever is already largely exhausted, the remaining potential is small and even limited additional costs can make the calculation negative. This does not require false precision, but a robust order-of-magnitude estimate for each lever.

      This may sound intuitive. In practice, however, such a calculation requires courage because assumptions are unavoidable. They should be derived from reliable data wherever possible, such as current bank fees, actual volumes or real terms. Nevertheless, they remain assumptions. A more detailed calculation does not improve accuracy if it does not improve the quality of the underlying assumptions. Accuracy is constrained by the weakest assumption, not by the depth of the calculation. Breaking a rough estimate into numerous sub-items makes sense only if each sub-item can be estimated more reliably than the overall figure. Otherwise, uncertainties are merely accumulated. The level of detail should therefore extend only as far as it genuinely improves the quality of the assumptions.

      In practical terms, marginal benefit is high when a lever remains underused, for example when cash-pooling participation is low, there are numerous accounts or exposure capture is incomplete. It flattens as the lever becomes largely exhausted.

      Our article “Which KPIs treasury teams track in 2026” shows KPIs that indicate where the next euro can still make a contribution, such as participation rate and bank accounts per entity, and where it cannot.

      So how much should my treasury function cost?

      A treasury function should not receive additional budget solely because its total contribution is high. Additional budget is economically justified only as long as the expected contribution from the next euro justifies its cost and uncertainty. Mandatory functions should be managed separately at the efficient level of service required. This may sound intuitive, but in practice treasurers often fail to create the necessary transparency. For the CFO, this means:

      • Never rely on a single benchmark. If two reputable sources differ by more than 100% for the same company, the benchmark does not provide a budget figure, but a starting point for discussion. The explanation lies in the scope of services, cost boundaries and peer-group definition.
      • Calculate total costs, not only the cost center. A supposedly low-cost treasury function may actually be more expensive if it merely hides work in decentralized teams, the decentralization paradox.
      • Separate earnings contributions from mandatory expenditure. Only then does the value calculation remain credible.
      • A positive Net Treasury Contribution does not justify every additional euro. Marginal benefit is decisive: does another investment, for example in an in-house bank, create more value than it costs? Conversely, are existing structures still required or do they merely create avoidable costs?
      • A value contribution that cannot be explained transparently may indicate a lack of transparency, unexploited potential or genuinely inappropriate costs.

      Treasury is not automatically an earnings driver. Its contribution is, however, less immediately visible to outsiders than its costs. If the value contribution is not made transparent, the discussion will inevitably focus only on costs and fall into the same benchmark trap that provides no useful answer.

      Our KPMG team of experts show you the right way for Corporate Treasury Management


      Source: KPMG Corporate Treasury News, Edition 168, September 2026

      Authors:

      • Börries Többens, Partner, Finance and Treasury Management, Corporate Treasury Advisory, KPMG AG
      • Alexander Horn, Senior Manager, Finance and Treasury Management, Corporate Treasury Advisory, KPMG AG

      Your contact

      Börries Többens

      Partner, Financial Services, Finance & Treasury Management

      KPMG AG Wirtschaftsprüfungsgesellschaft