Our people
Inclusion, Diversity and Equity
We embrace and harness diversity of background, experience and perspective. At KPMG, you’re empowered to come as you are.
We’re committed to creating an inclusive environment where all colleagues thrive and reach their full potential, whatever their identity or background. This is fundamental to our success as a business.
To help us achieve this, we’ve outlined bold ambitions and set long-term targets to 2030 as part of our inclusion, diversity and equity plan – Our KPMG: A fairer future for all. Our plan is designed to create an inclusive environment, equitable experiences and accountable leaders, which will in turn help improve the representation of historically under-represented groups at our most senior levels of the business. It is why we don’t just focus on getting into our profession, but also how you get on and progress within our firm.
It marks an ambitious but evolutionary chapter as part of our long-standing commitment to change. We know we need to continue to challenge ourselves, confront biases and listen and learn from each other, and this marks the next step in our journey towards a fairer future for all.
40:40:20 requires us to have a minimum of 40% female colleagues and 40% male colleagues in the relevant population. 20% is flexible and recognises the moving nature of our firm, while setting parameters for us to meet and stay within.
40:40:20 requires us to have a minimum of 40% female colleagues and 40% male colleagues in the relevant population. 20% is flexible and recognises the moving nature of our firm, while setting parameters for us to meet and stay within.
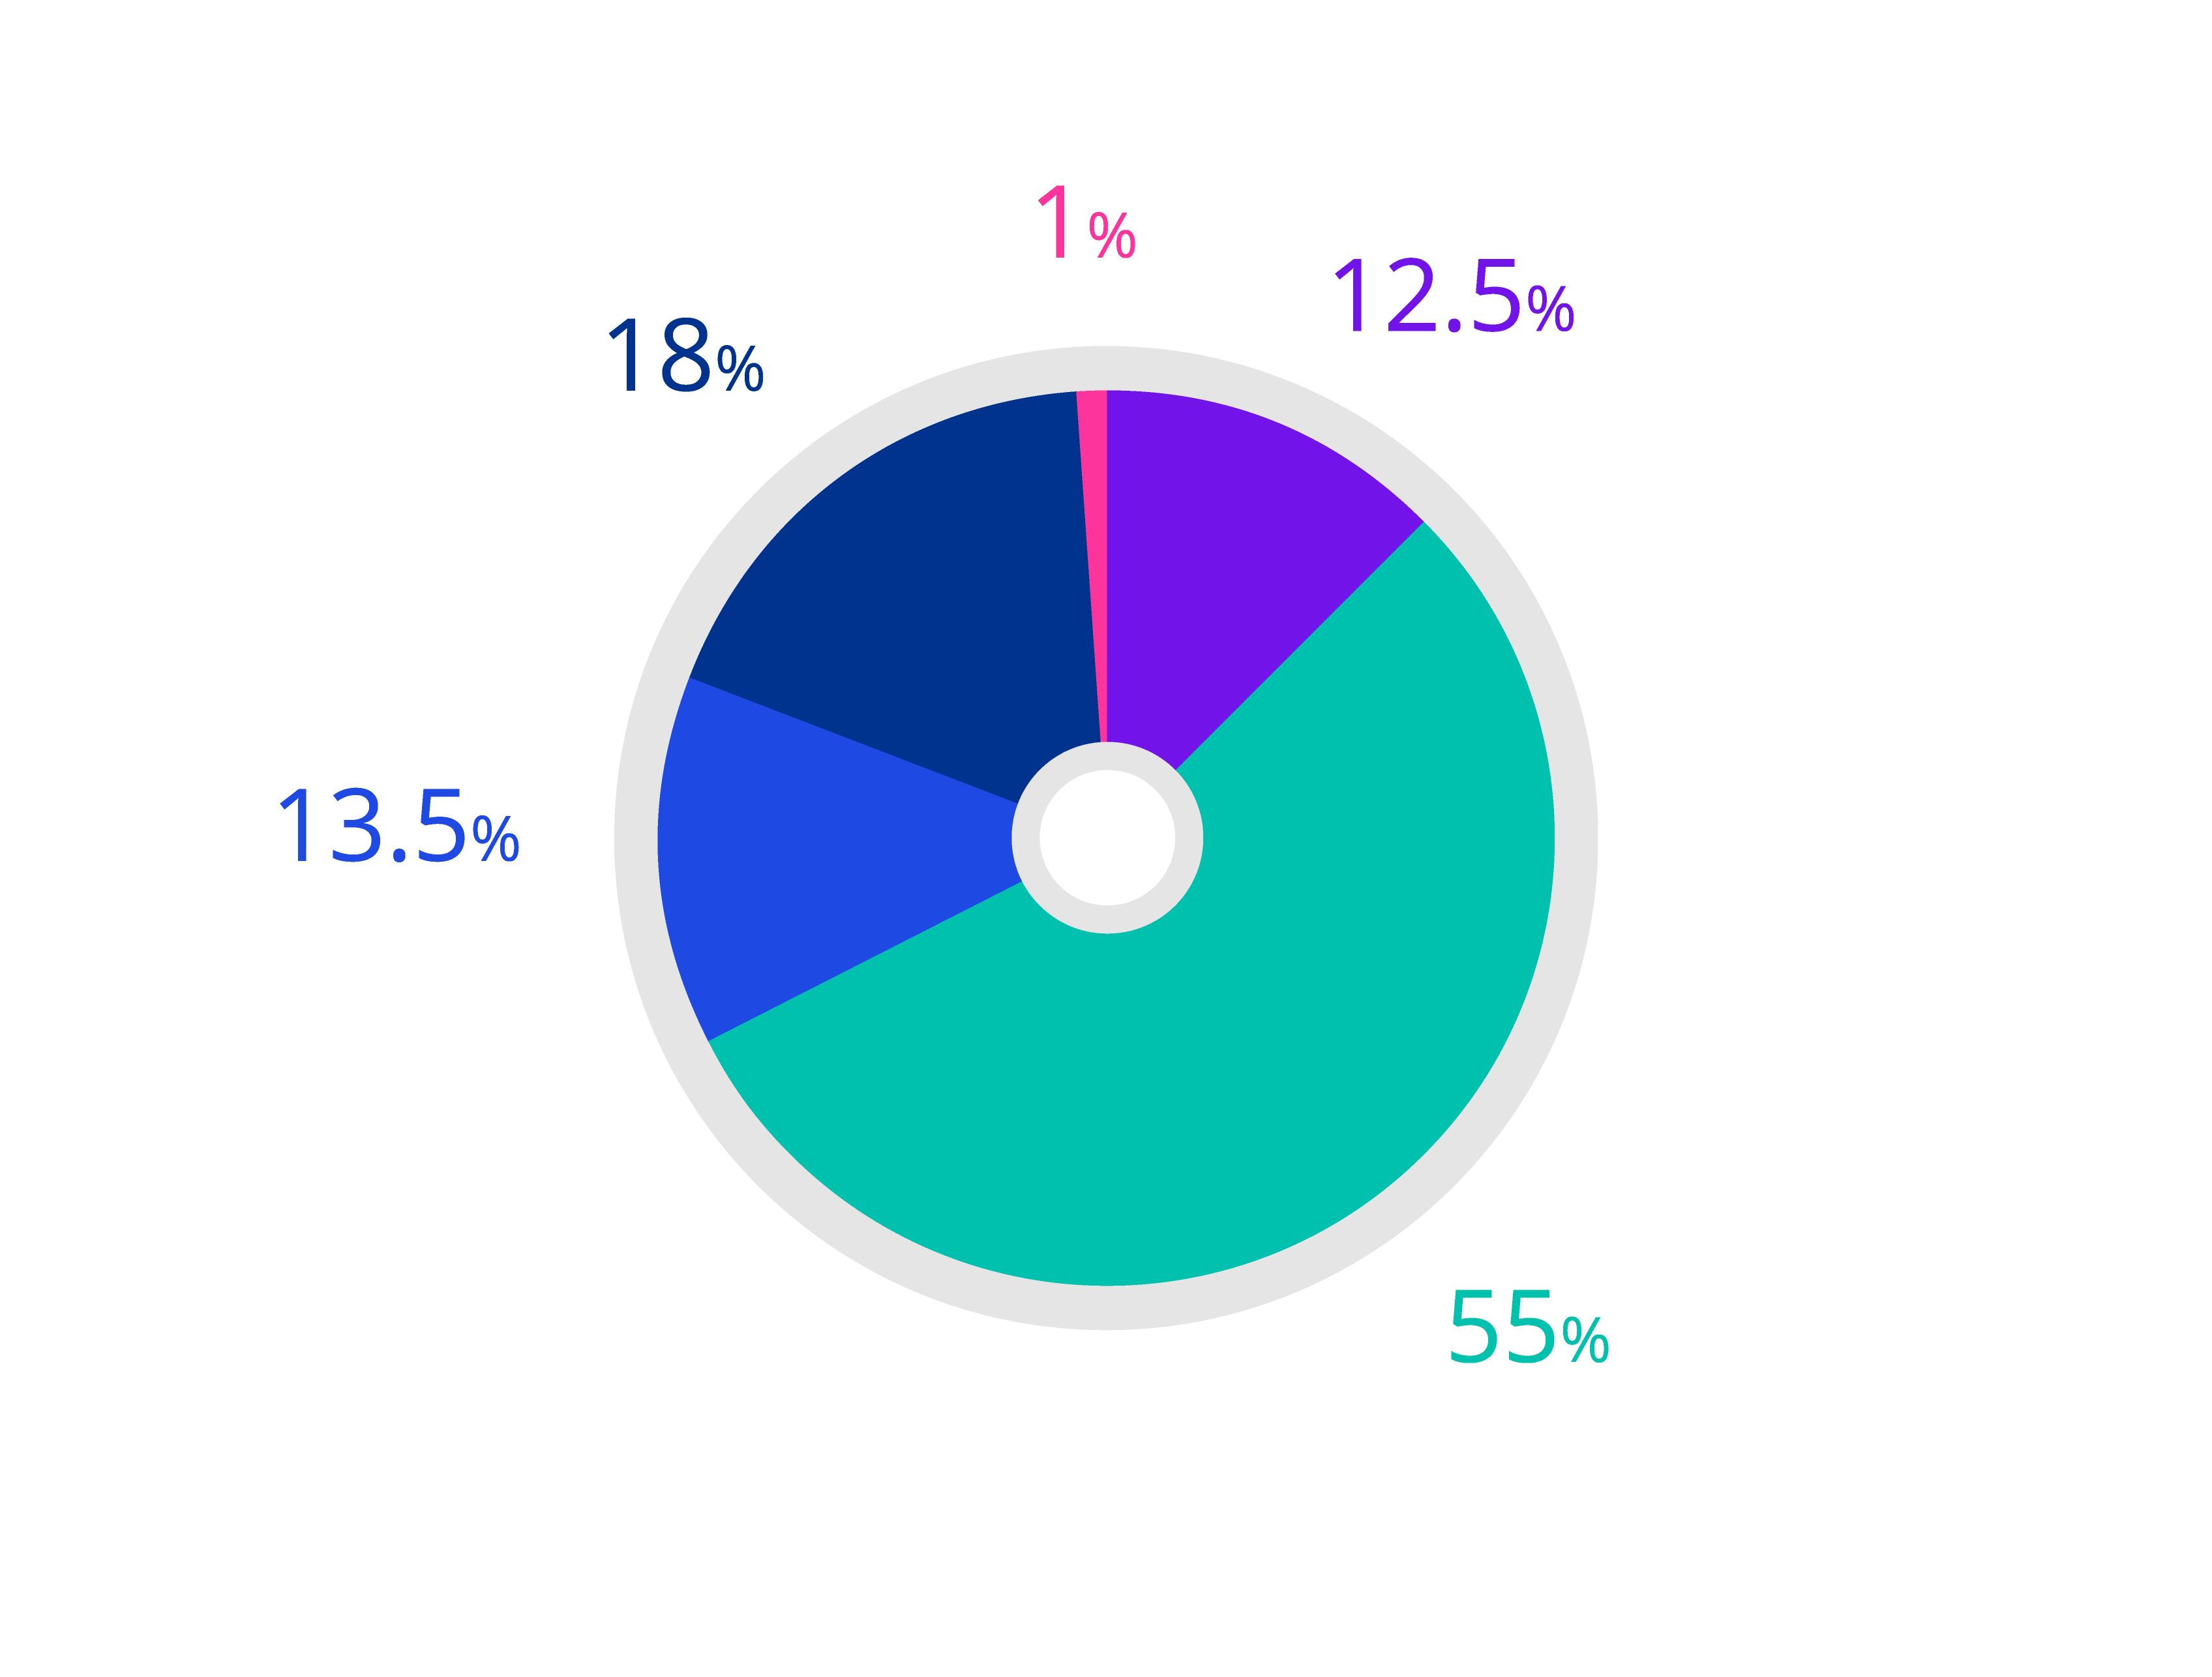
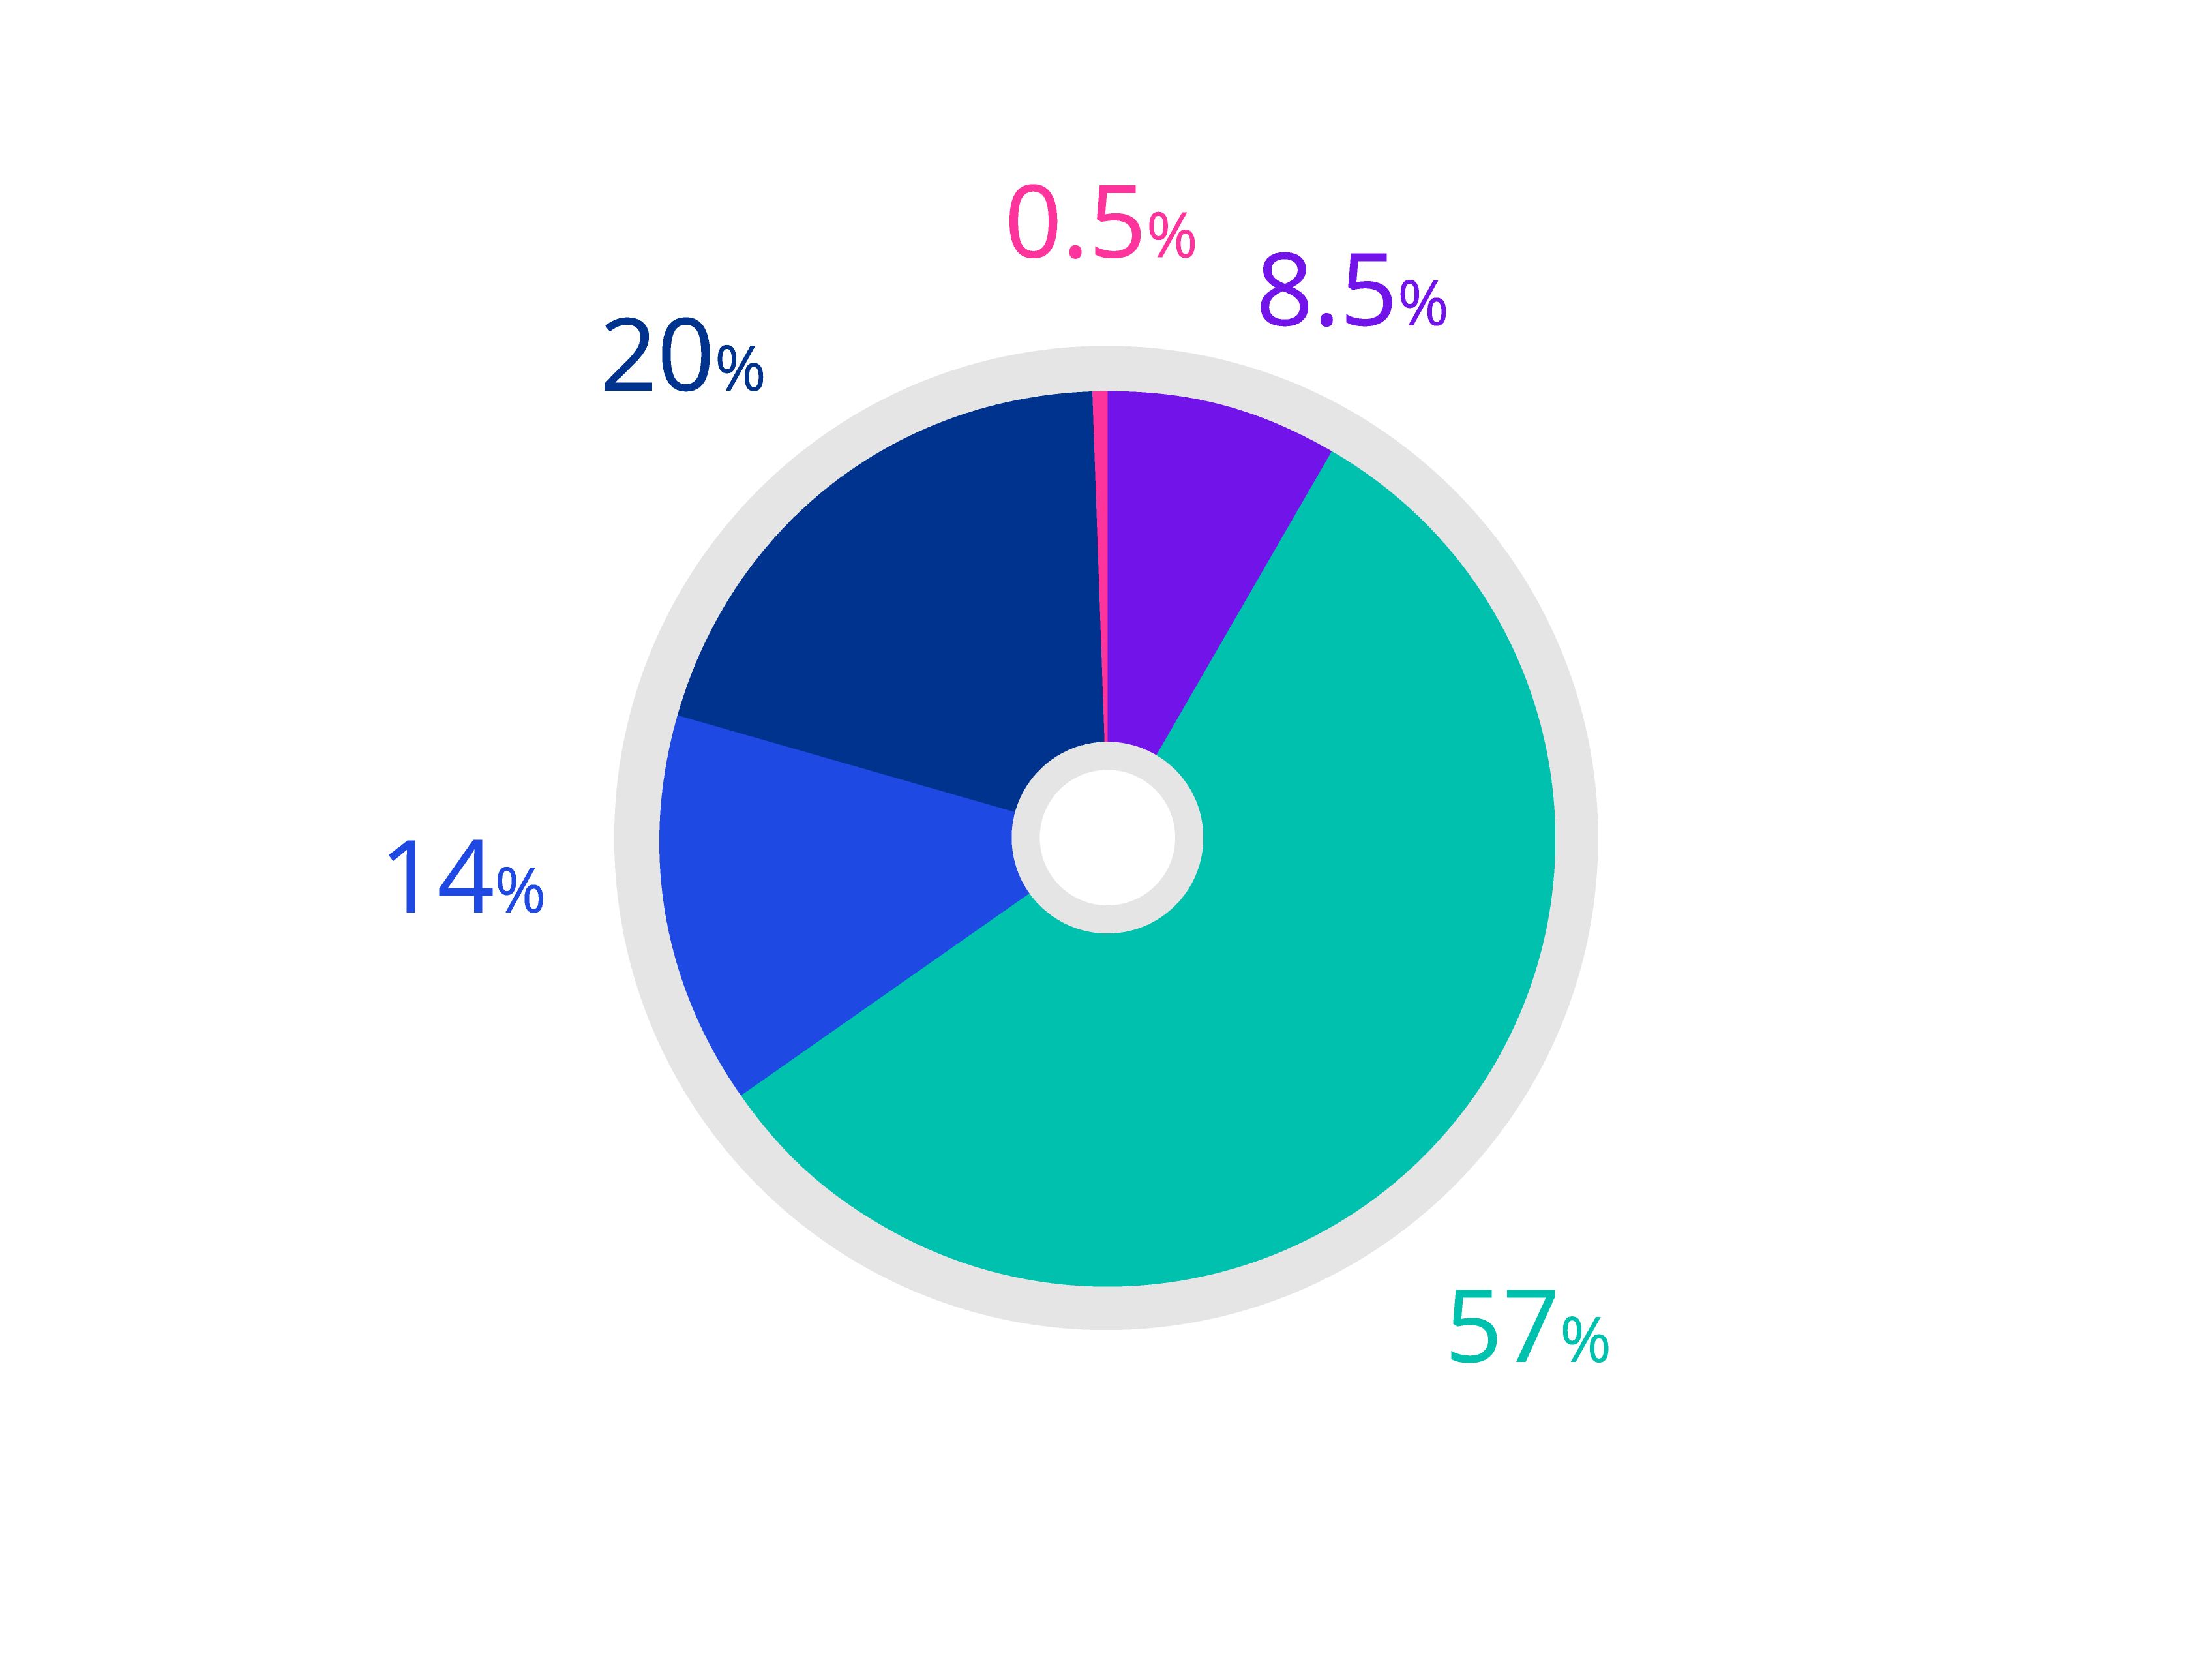
Senior representation includes Partners, Directors and Senior Managers.
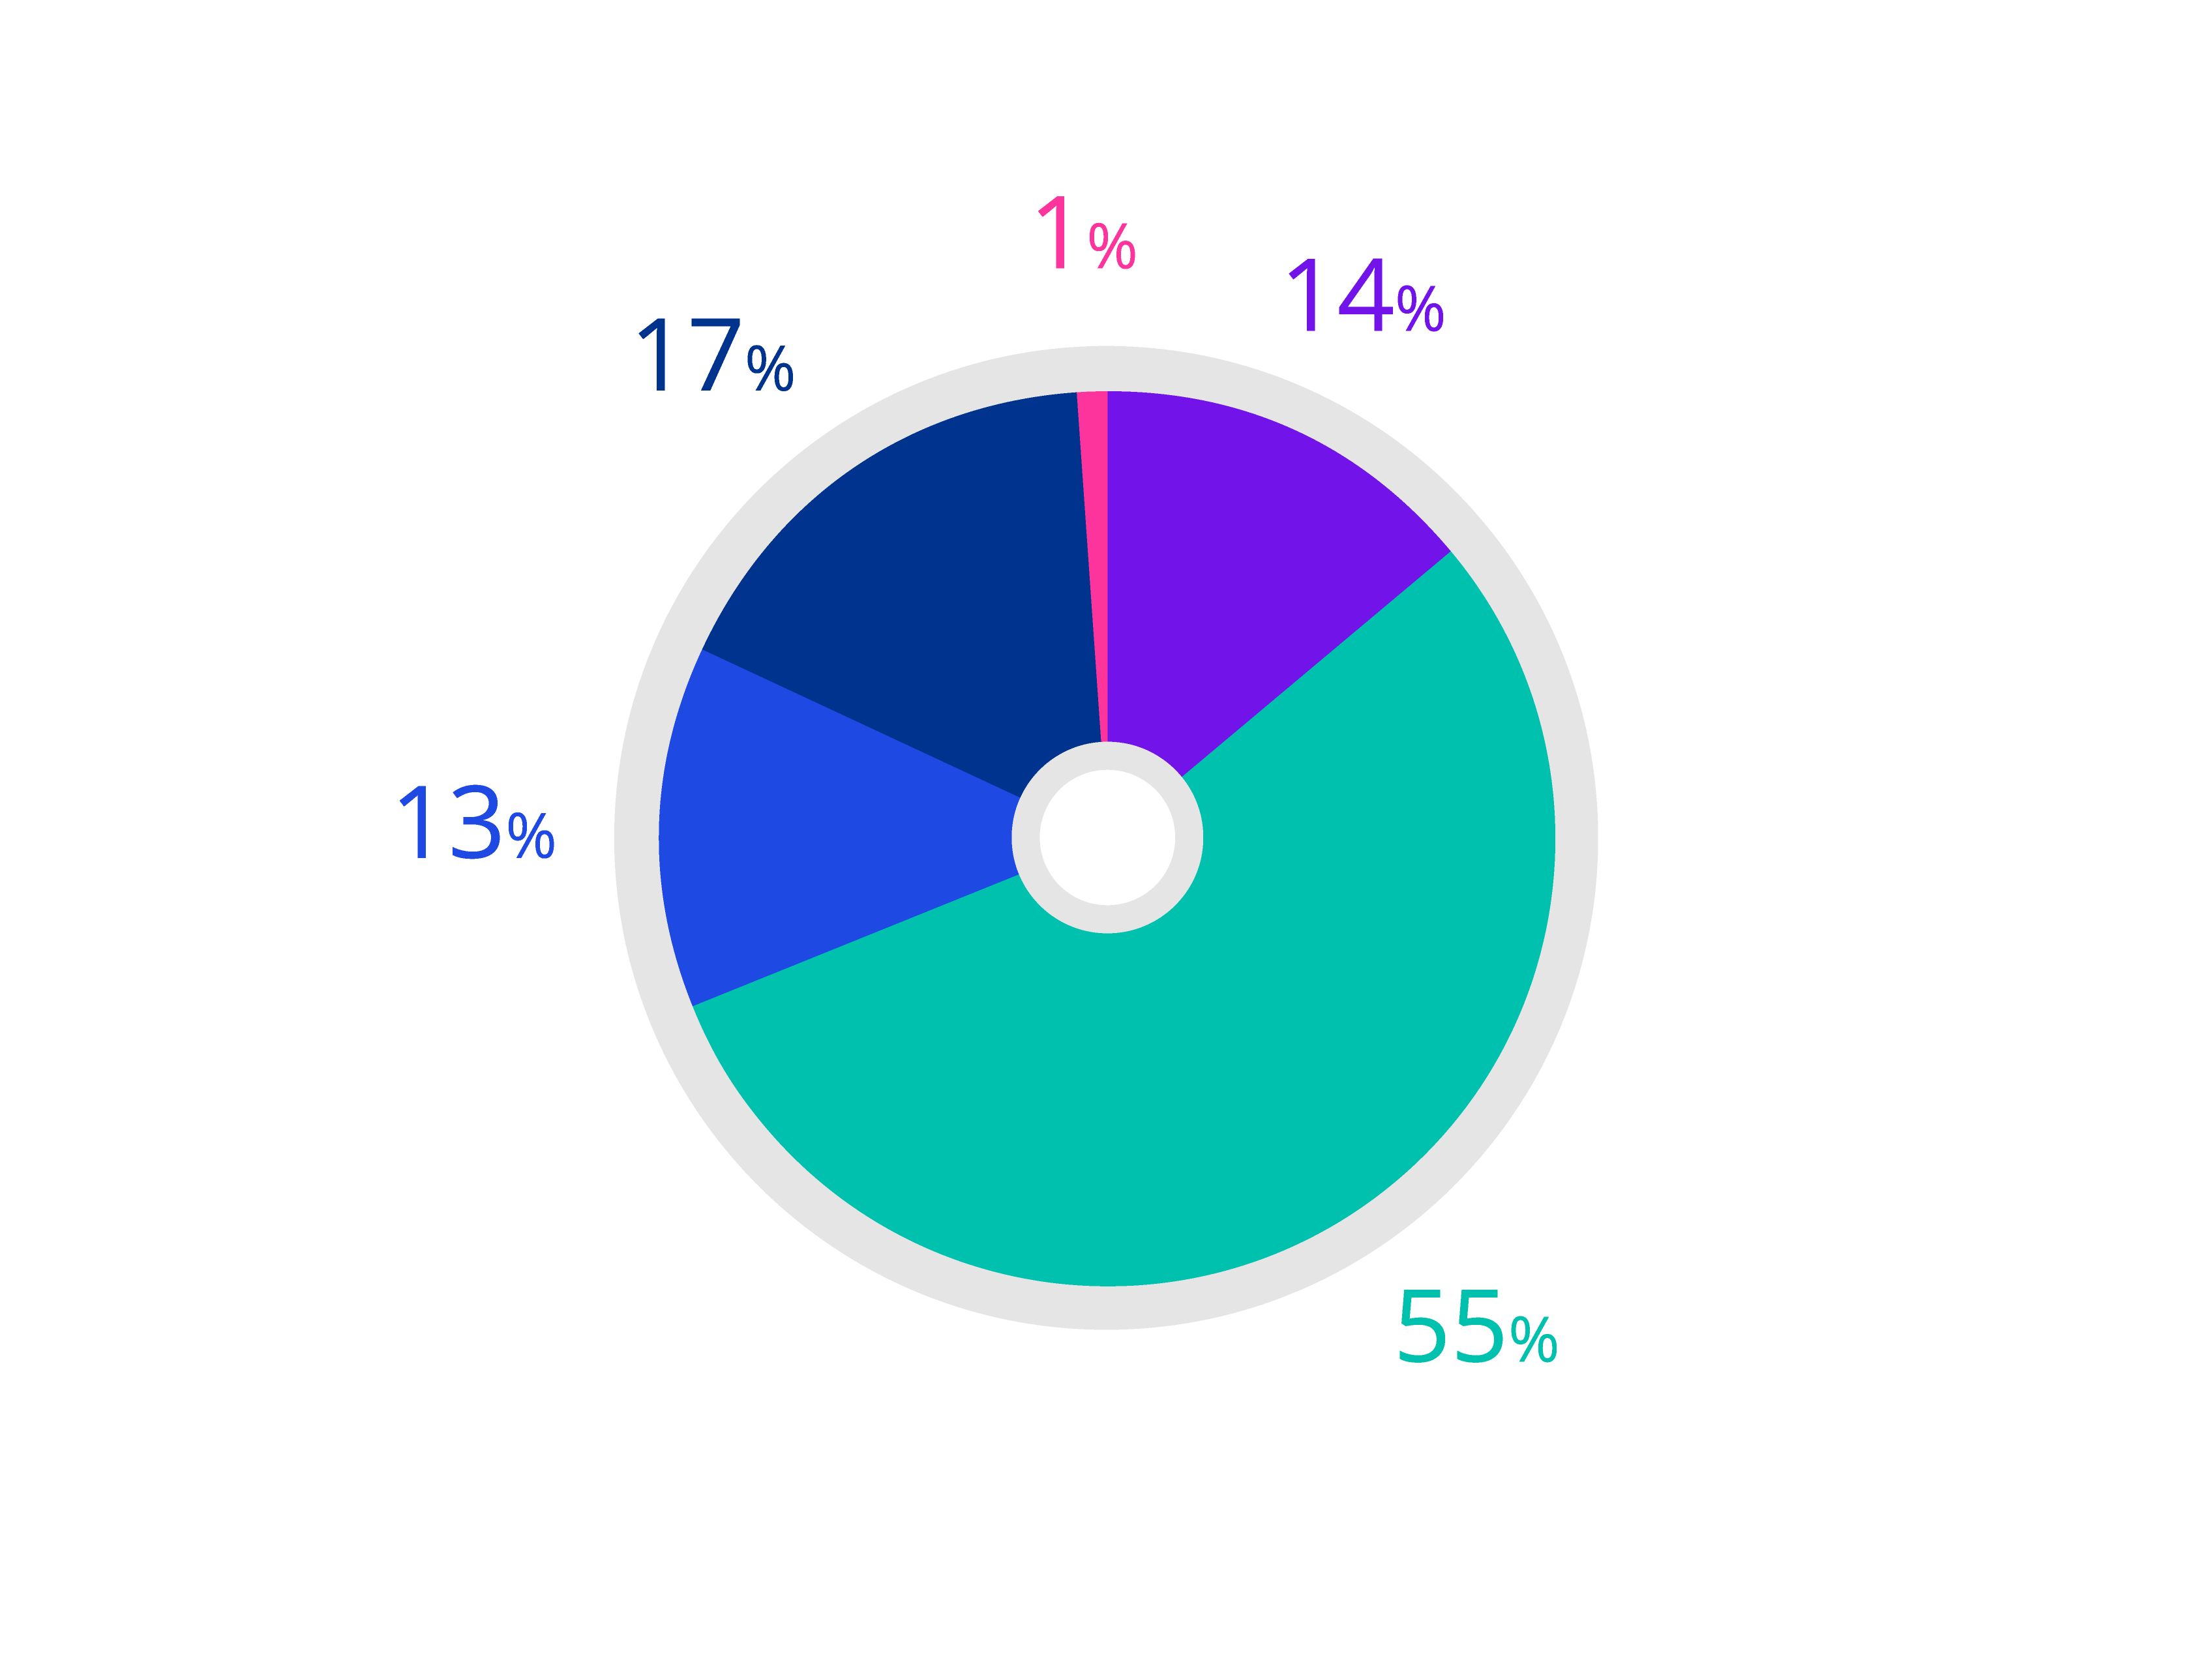
Junior representation includes Manager level and below, as well as our Graduates and Apprentices.
40:40:20 requires us to have a minimum of 40% female colleagues and 40% male colleagues in the relevant population. 20% is flexible and recognises the moving nature of our firm, while setting parameters for us to meet and stay within.
40:40:20 requires us to have a minimum of 40% female colleagues and 40% male colleagues in the relevant population. 20% is flexible and recognises the moving nature of our firm, while setting parameters for us to meet and stay within.
Junior representation includes Manager level and below, as well as our Graduates and Apprentices.
Senior representation includes Partners, Directors and Senior Managers.
Junior representation includes Manager level and below, as well as our Graduates and Apprentices.
Senior representation includes Partners, Directors and Senior Managers.
Junior representation includes Manager level and below, as well as our Graduates and Apprentices.
Senior representation includes Partners, Directors and Senior Managers.
Junior representation includes Manager level and below, as well as our Graduates and Apprentices.
Senior representation includes Partners, Directors and Senior Managers.
Junior representation includes Manager level and below, as well as our Graduates and Apprentices.
Senior representation includes Partners, Directors and Senior Managers.
Junior representation includes Manager level and below, as well as our Graduates and Apprentices.
Senior representation includes Partners, Directors and Senior Managers.
Junior representation includes Manager level and below, as well as our Graduates and Apprentices.
Senior representation includes Partners, Directors and Senior Managers.
Junior representation includes Manager level and below, as well as our Graduates and Apprentices.
Senior representation includes Partners, Directors and Senior Managers.
Junior representation includes Manager level and below, as well as our Graduates and Apprentices.
Senior representation includes Partners, Directors and Senior Managers.
Junior representation includes Manager level and below, as well as our Graduates and Apprentices.
Senior representation includes Partners, Directors and Senior Managers.
Junior representation includes Manager level and below, as well as our Graduates and Apprentices.
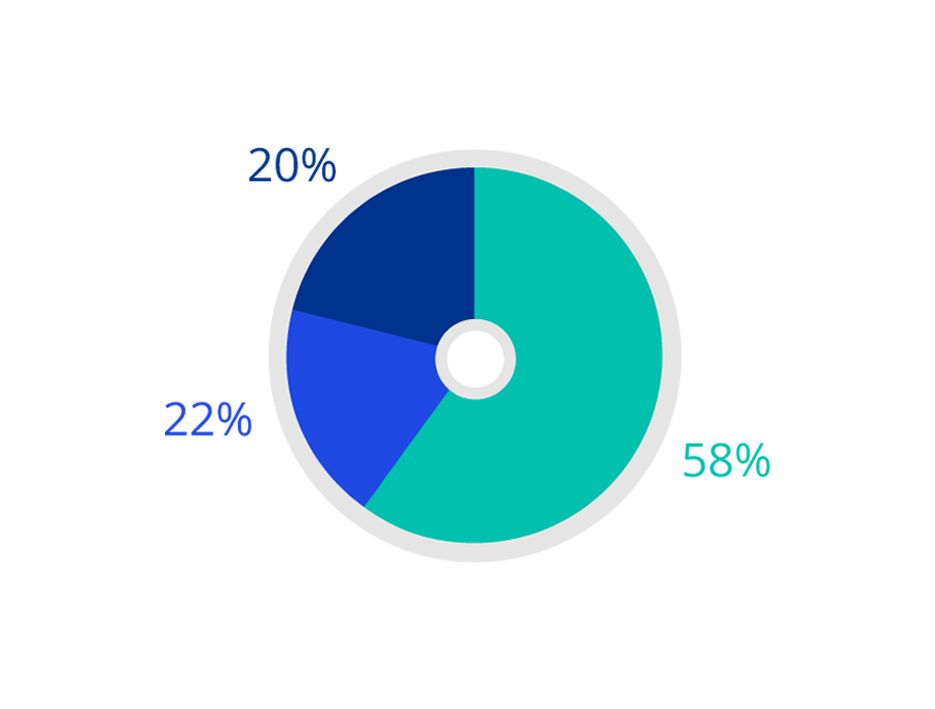
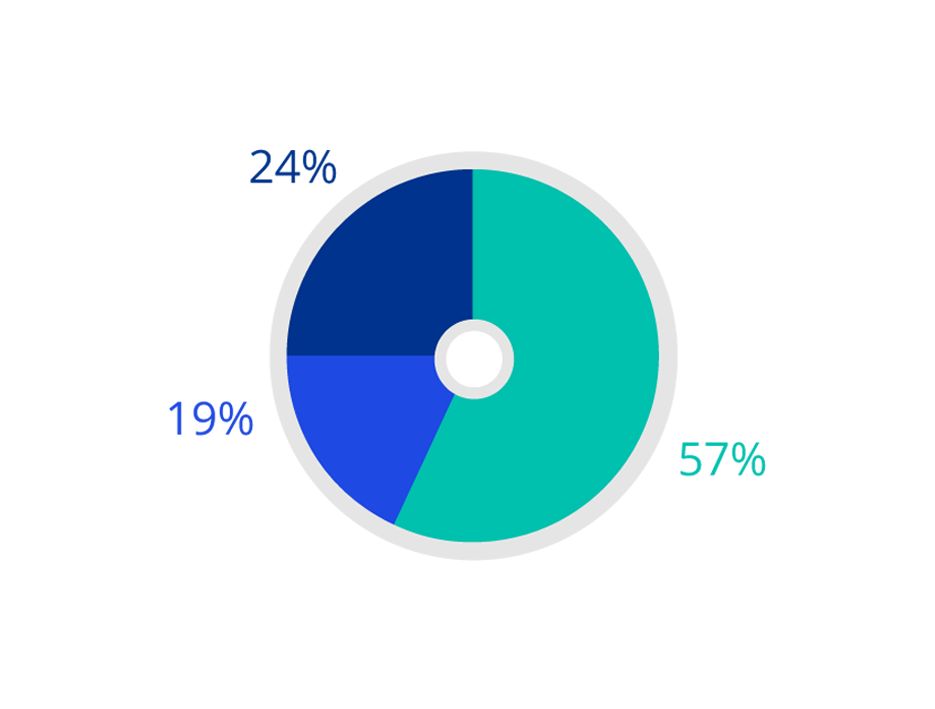
2030 target: 29% lower socio-economic background
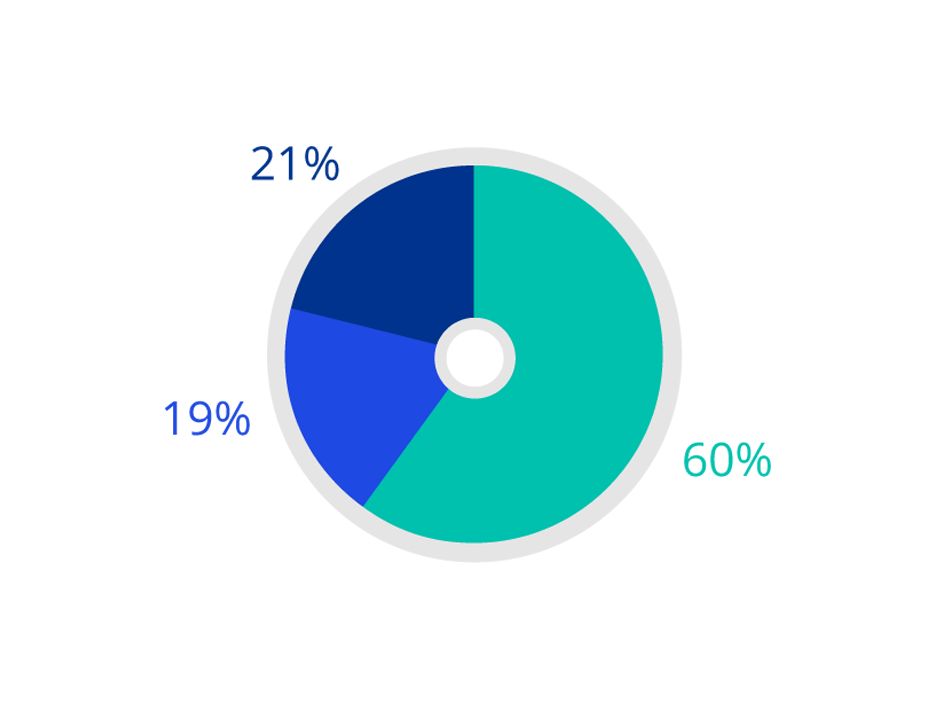
2030 target: 29% lower socio-economic background
Senior representation includes Partners, Directors and Senior Managers.
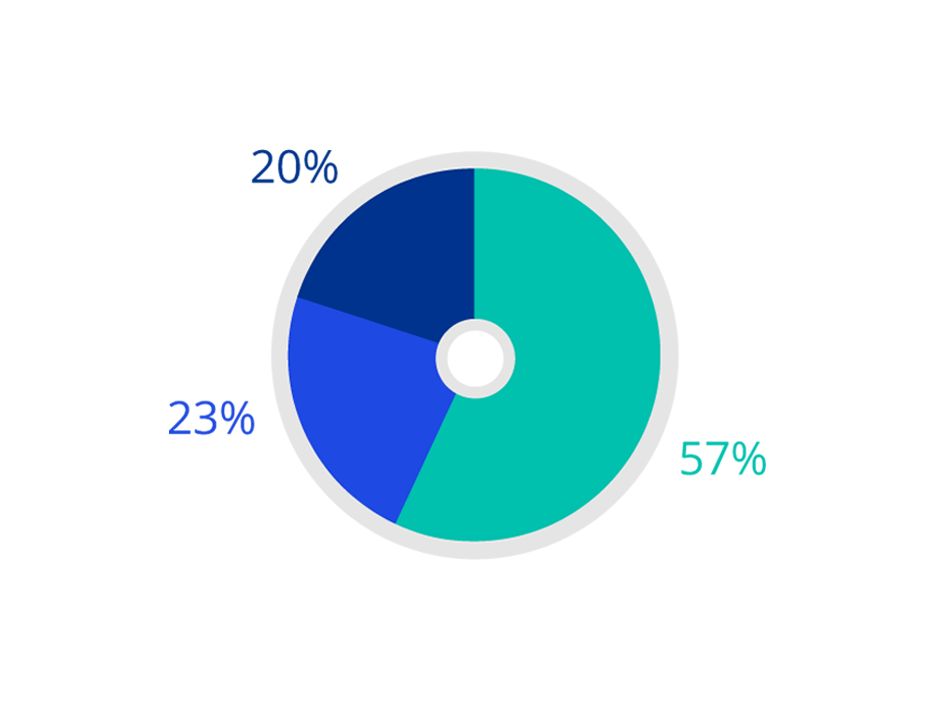
2030 target: 29% lower socio-economic background
Junior representation includes Manager level and below, as well as our Graduates and Apprentices.
Our reporting descriptions and methodology is based on guidance from social equality experts, the Bridge Group. We use parental occupation as our measure of socio-economic background. This is based on The National Statistics Socio-Economic classification, which identifies the occupation of the highest earner in your household at age 14 as the most robust indicator of socio-economic background. Low socio-economic backgrounds are defined as NS-SEC 5, 6 and 7 occupations. Examples include receptionists, electricians, plumbers, butchers and van drivers.
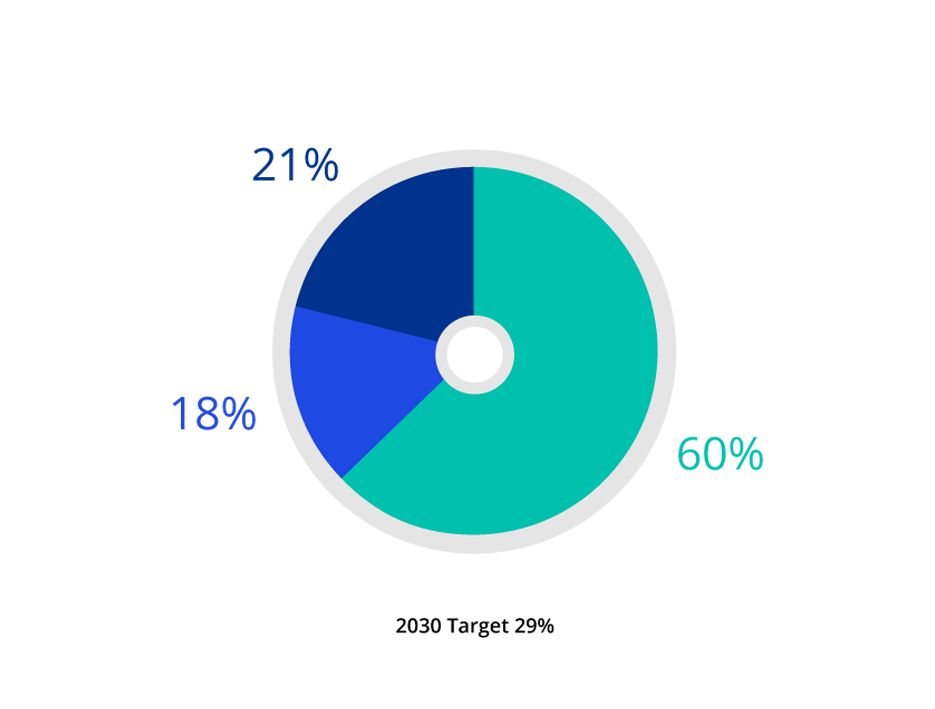
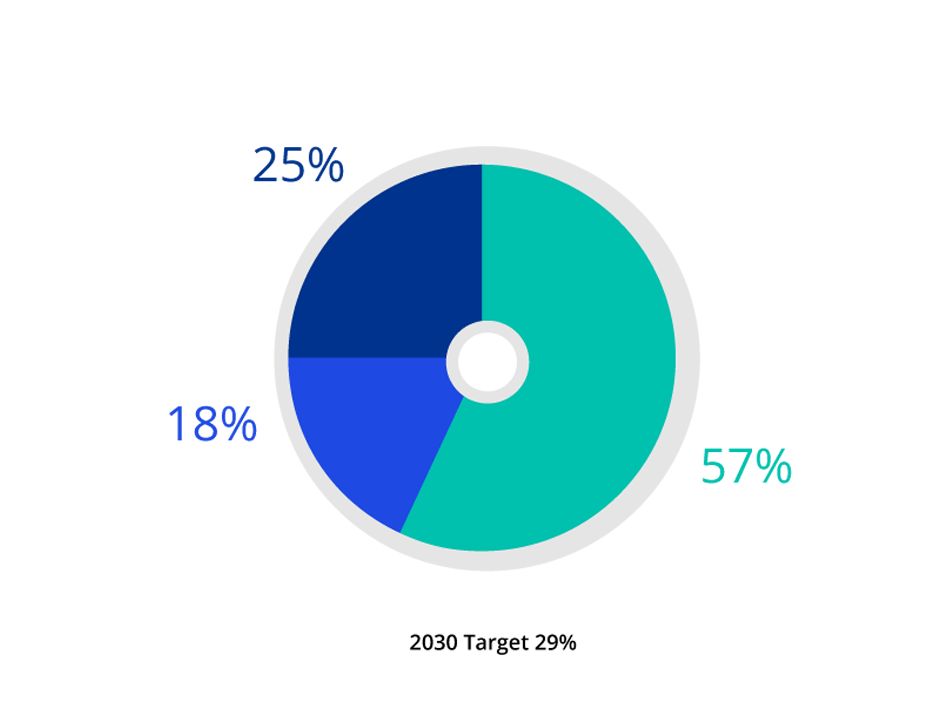
2030 target: 29% lower socio-economic background
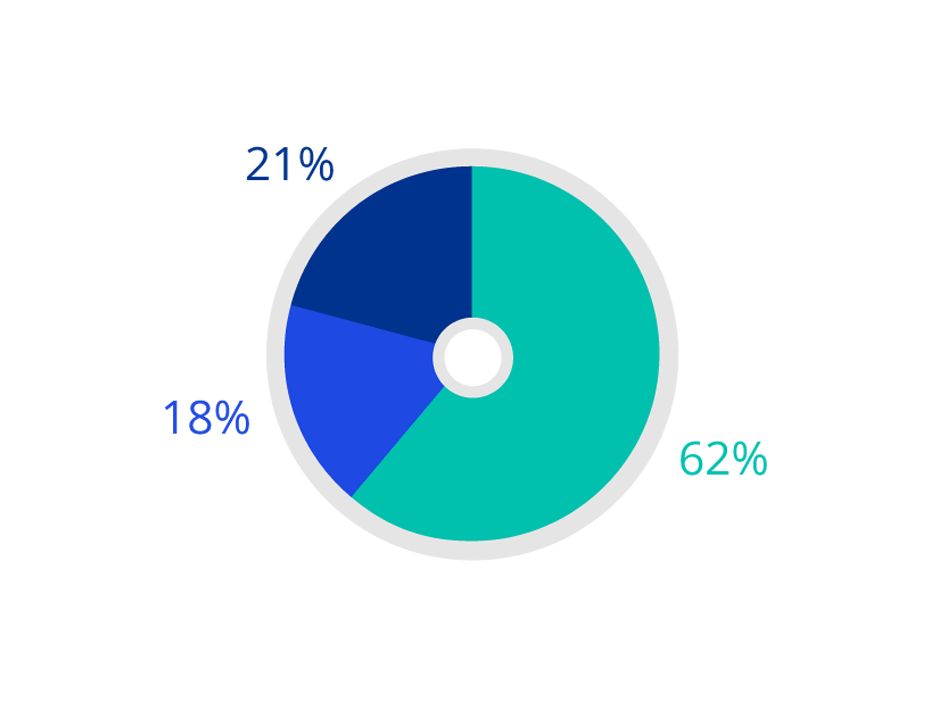
2030 target: 29% lower socio-economic background
Senior representation includes Partners, Directors and Senior Managers.
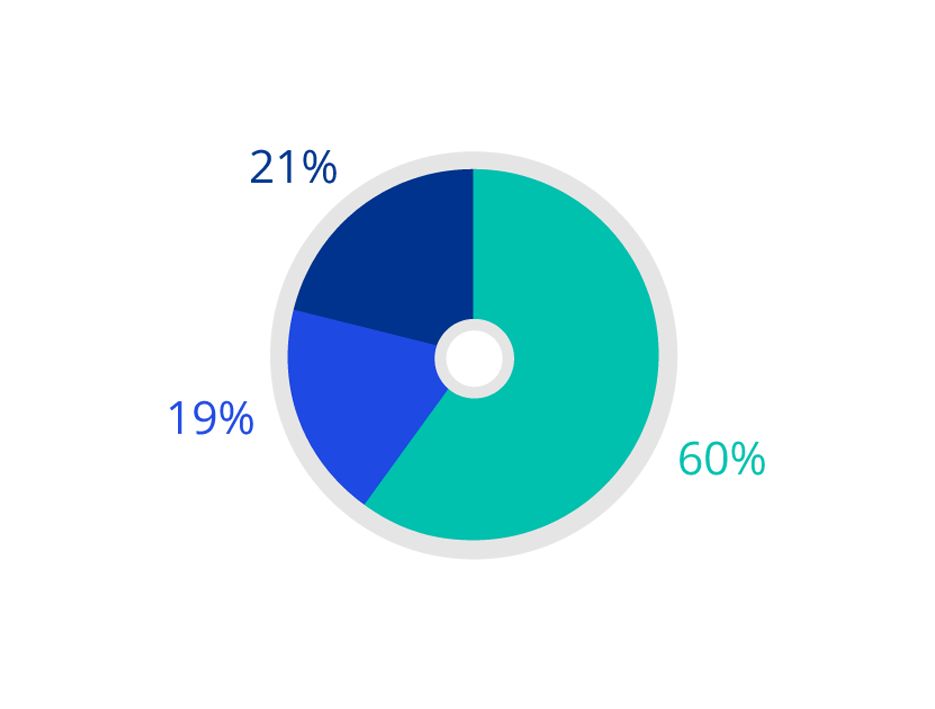
2030 target: 29% lower socio-economic background
Junior representation includes Manager level and below, as well as our Graduates and Apprentices.
Our reporting descriptions and methodology is based on guidance from social equality experts, the Bridge Group. We use parental occupation as our measure of socio-economic background. This is based on The National Statistics Socio-Economic classification, which identifies the occupation of the highest earner in your household at age 14 as the most robust indicator of socio-economic background. Low socio-economic backgrounds are defined as NS-SEC 5, 6 and 7 occupations. Examples include receptionists, electricians, plumbers, butchers and van drivers.
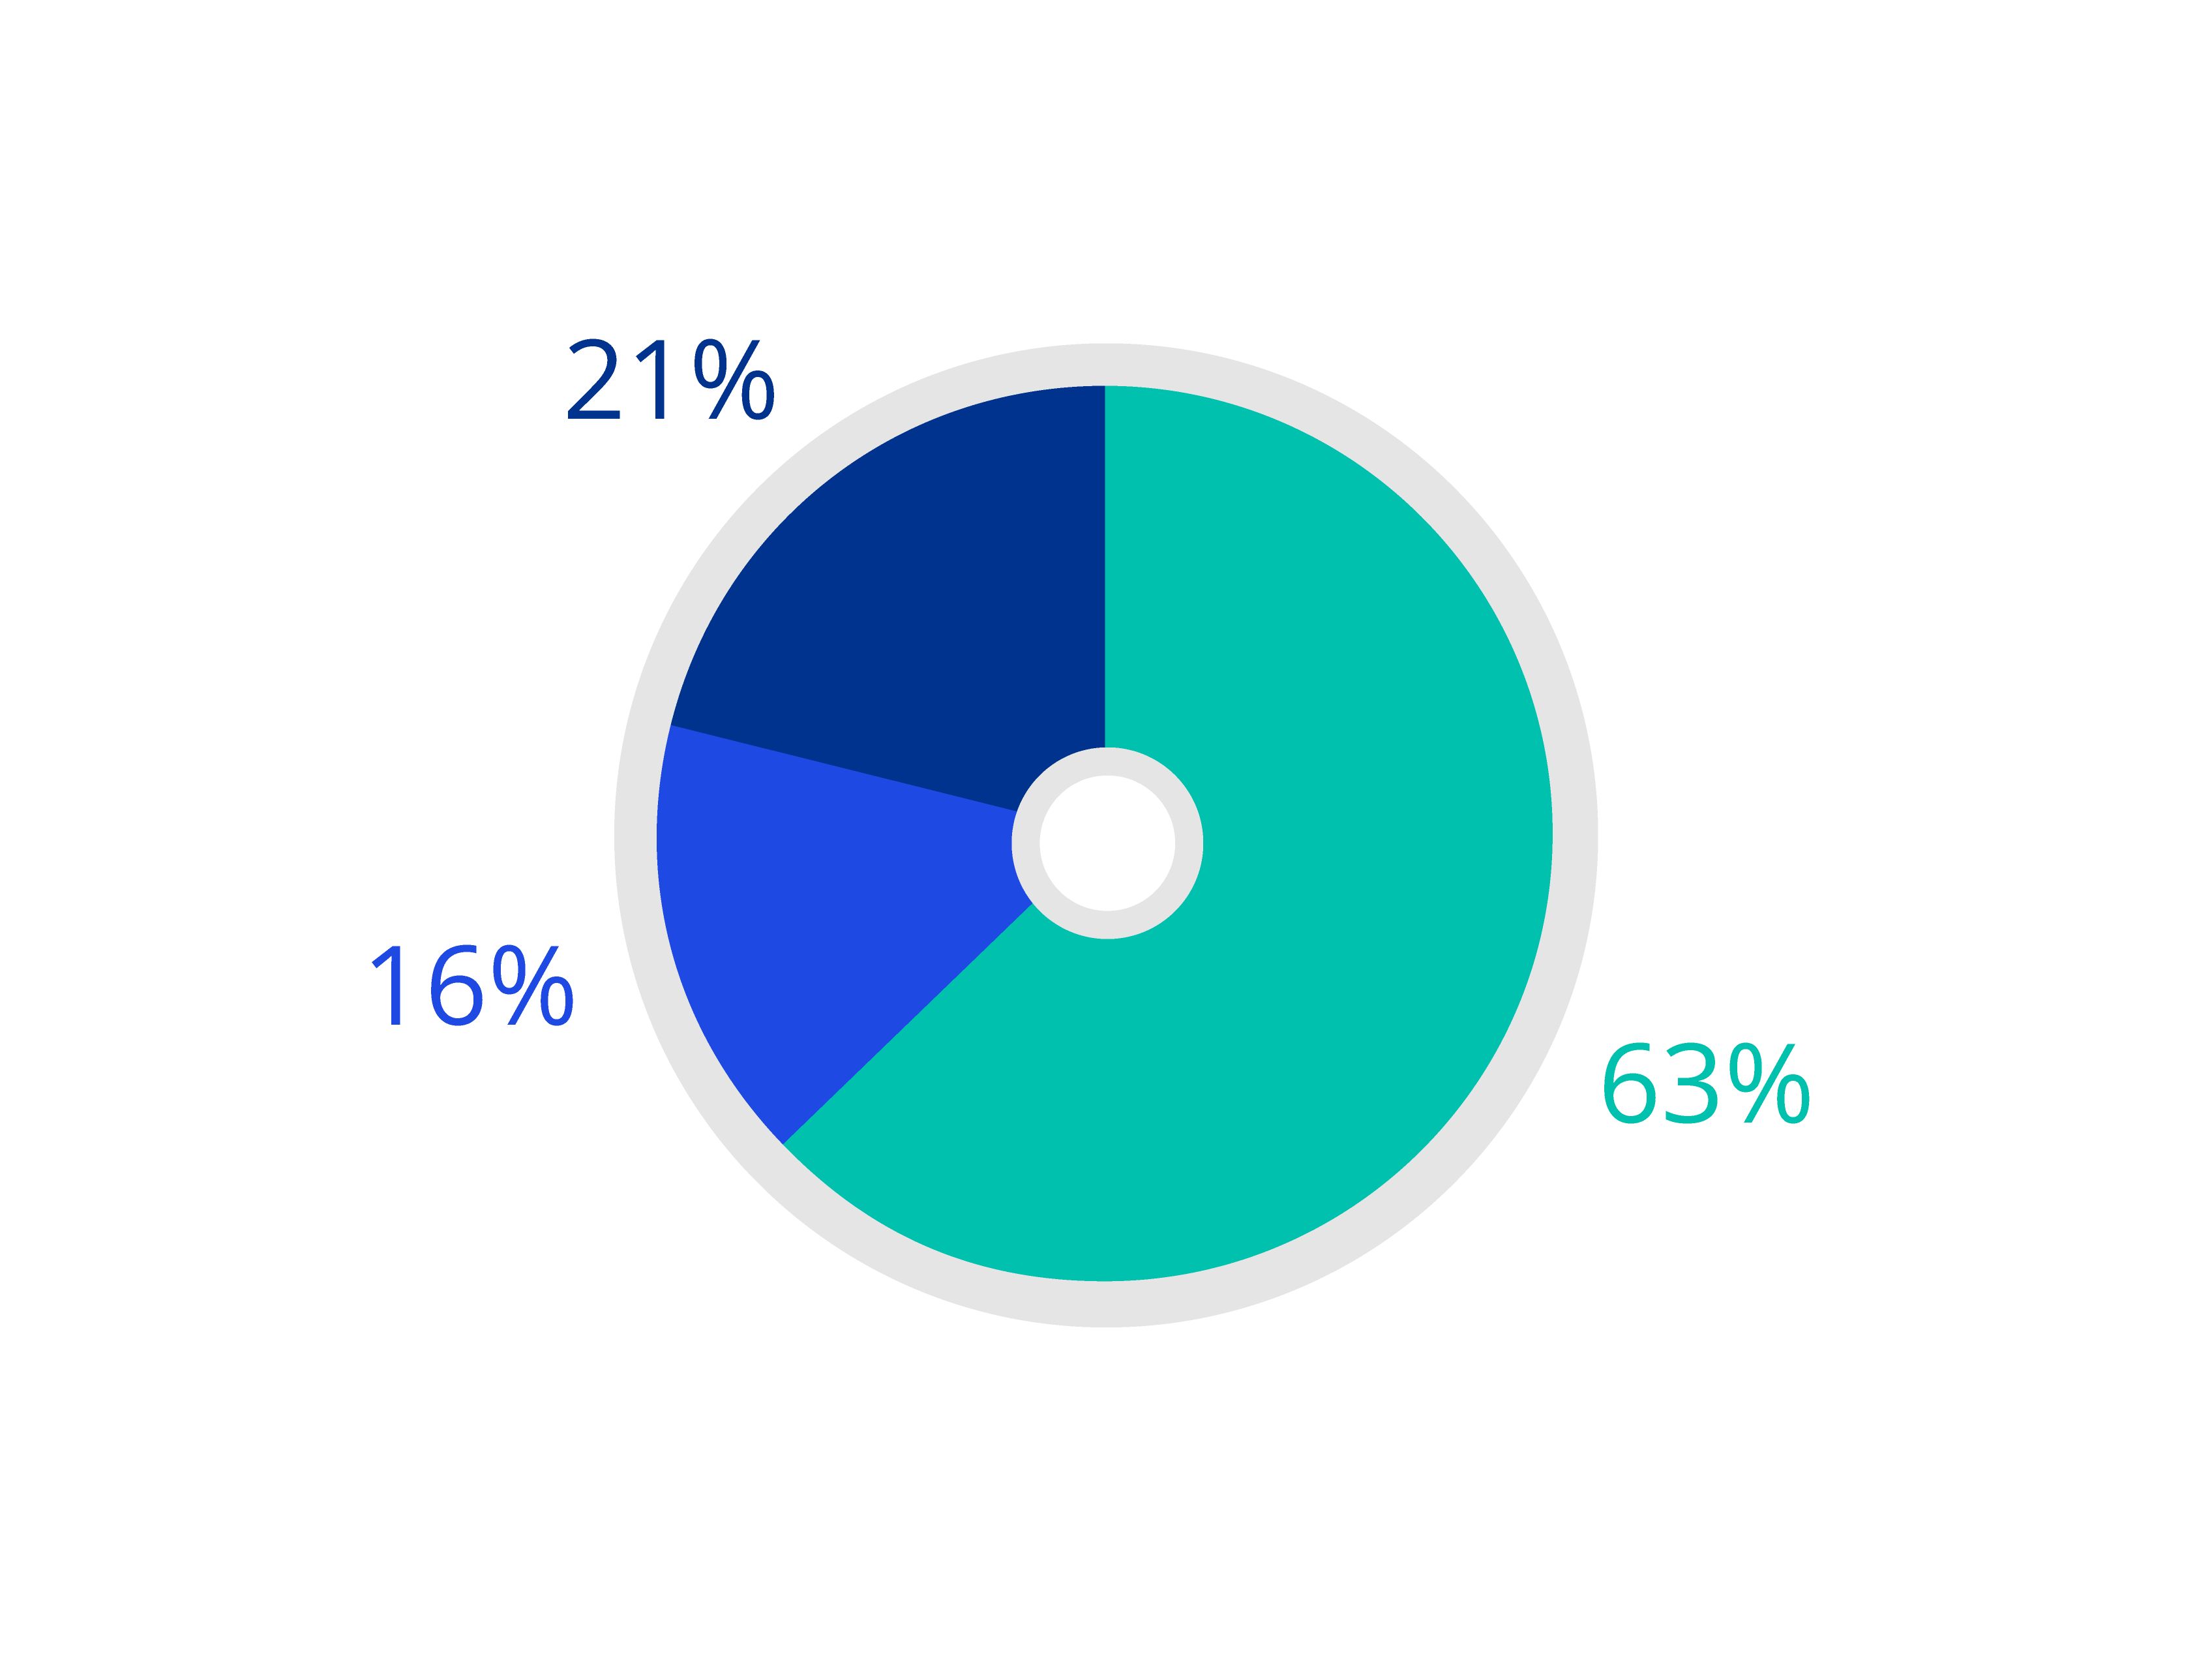
Our reporting descriptions and methodology is based on guidance from social equality experts, the Bridge Group. We use parental occupation as our measure of socio-economic background. This is based on The National Statistics Socio-Economic classification, which identifies the occupation of the highest earner in your household at age 14 as the most robust indicator of socio-economic background. Low socio-economic backgrounds are defined as NS-SEC 5, 6 and 7 occupations. Examples include receptionists, electricians, plumbers, butchers and van drivers.
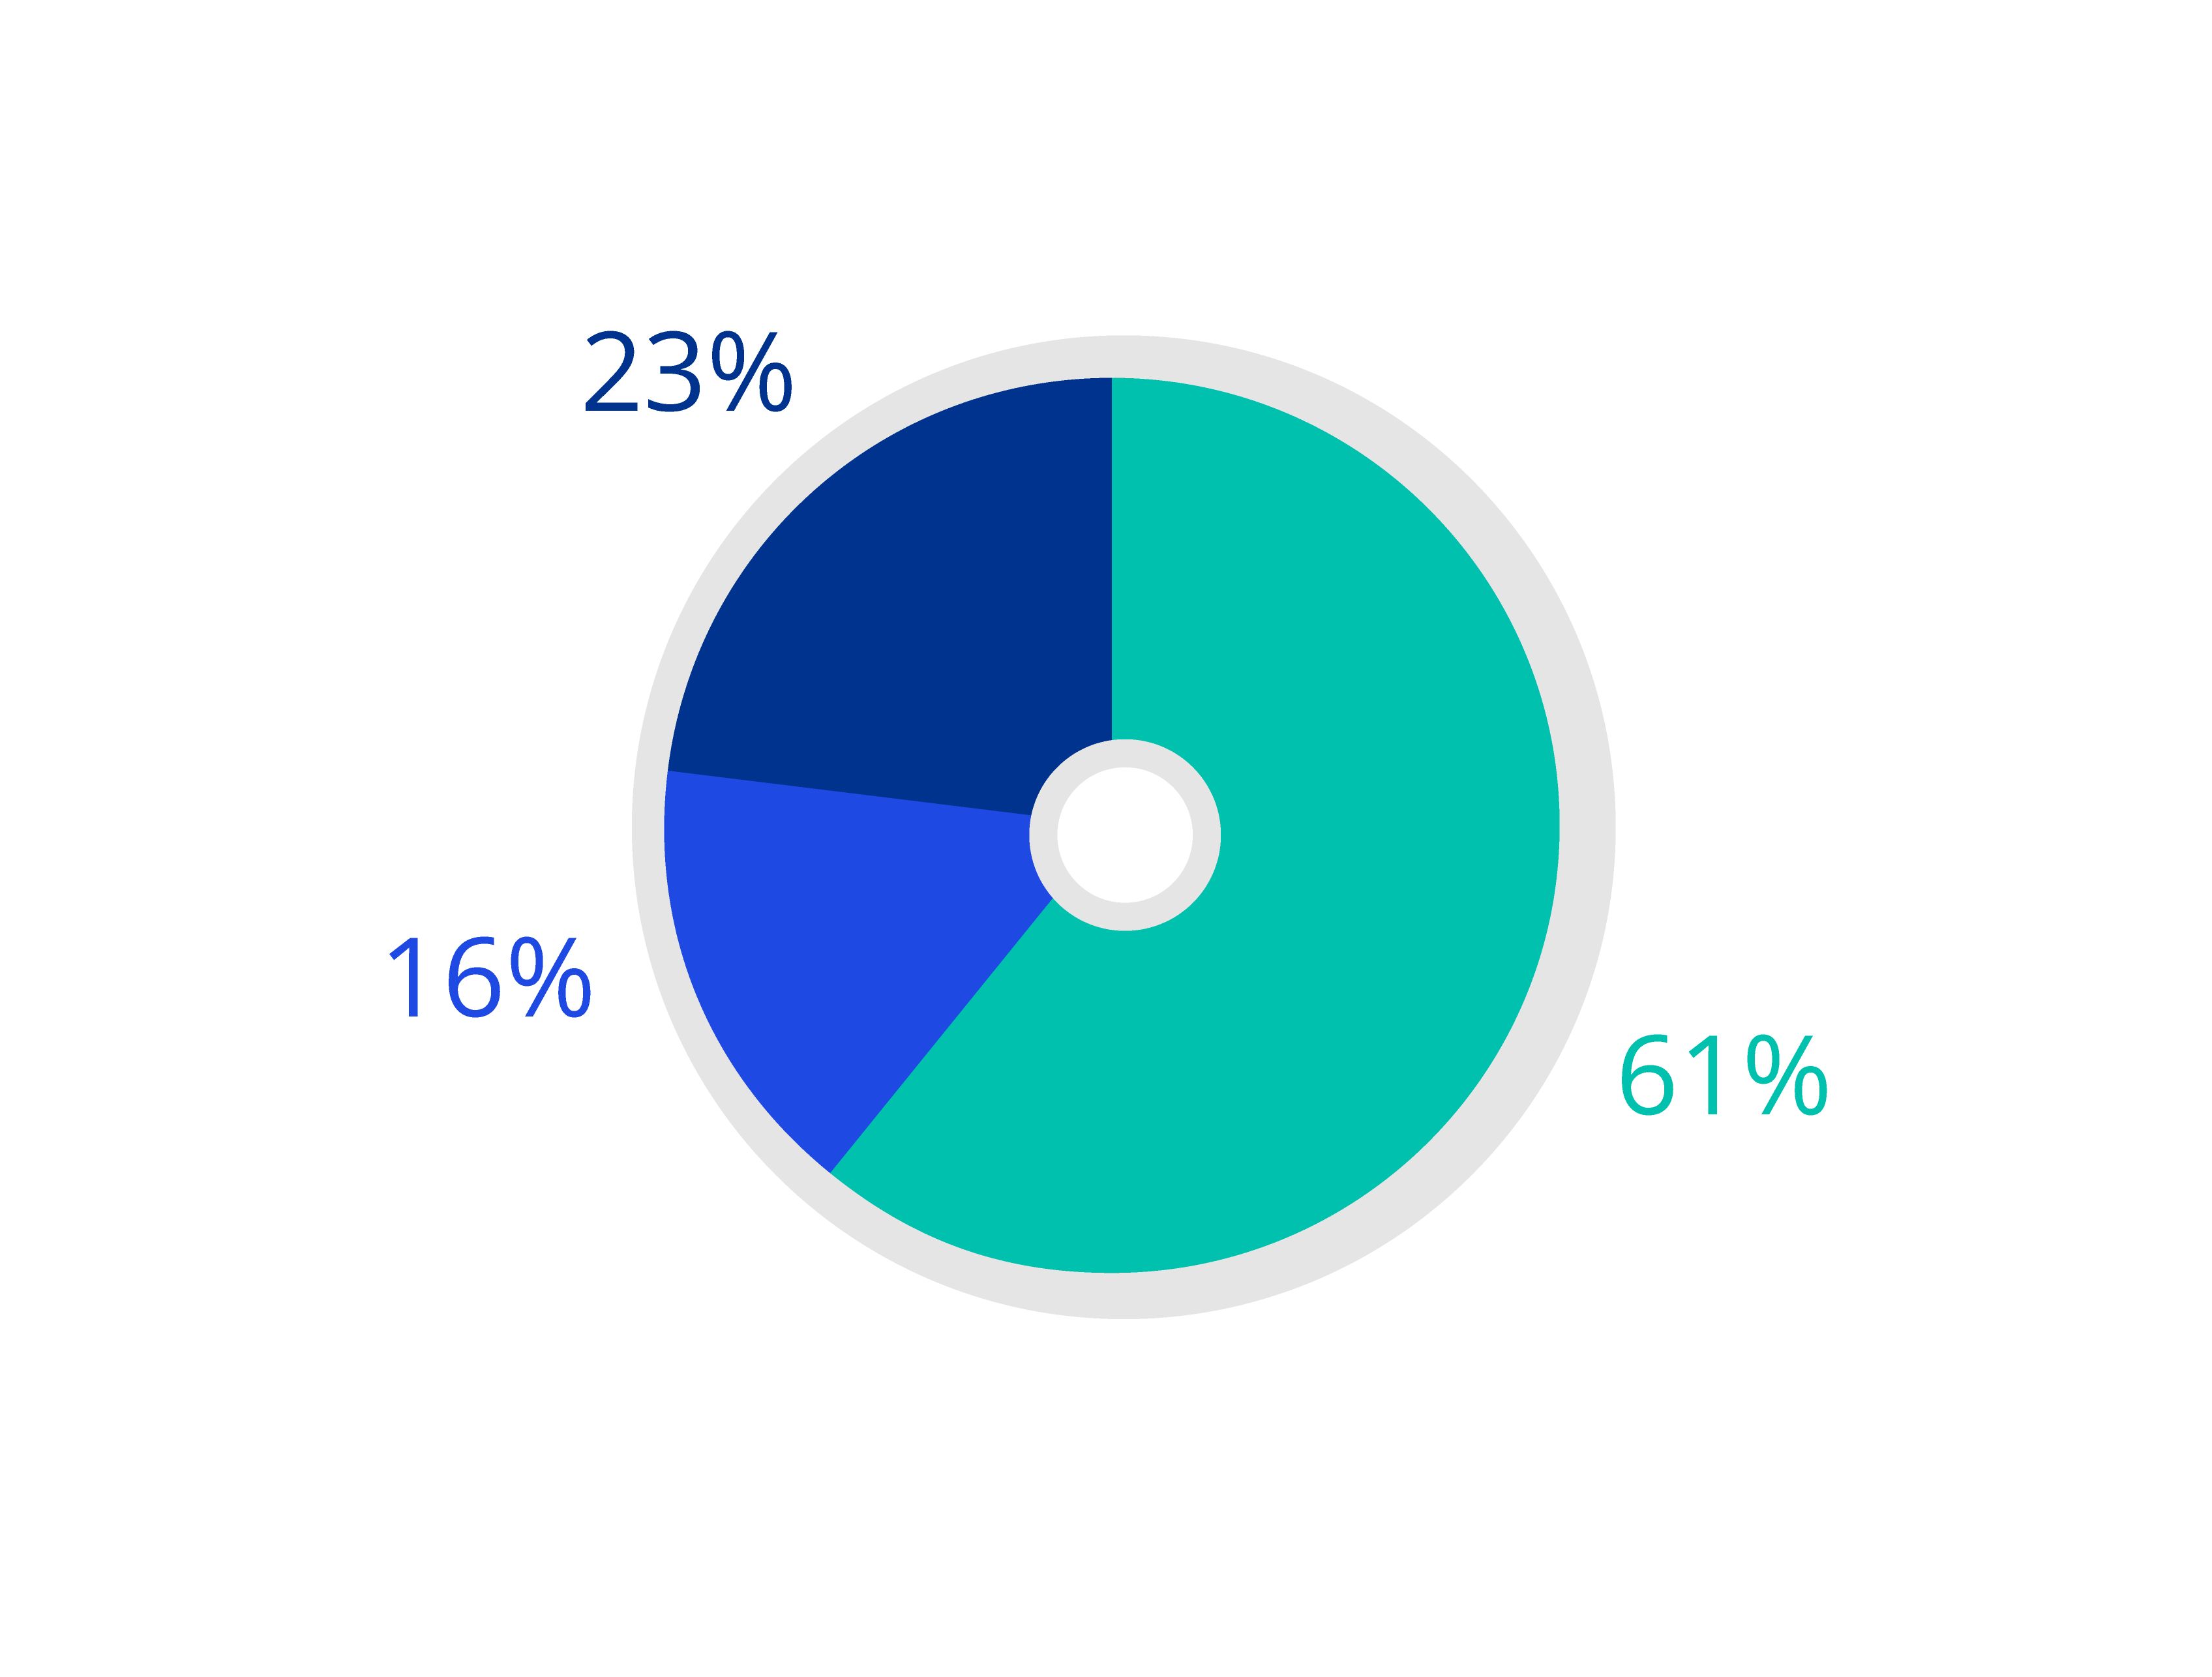
2030 target: 29% lower socio-economic background
Our reporting descriptions and methodology is based on guidance from social equality experts, the Bridge Group. We use parental occupation as our measure of socio-economic background. This is based on The National Statistics Socio-Economic classification, which identifies the occupation of the highest earner in your household at age 14 as the most robust indicator of socio-economic background. Low socio-economic backgrounds are defined as NS-SEC 5, 6 and 7 occupations. Examples include receptionists, electricians, plumbers, butchers and van drivers.
*This year’s figures are based on those that have declared this information to us. This is no longer comparable to previous data, as we have updated our methodology to bring it in line with advice from social mobility experts, the Bridge Group.
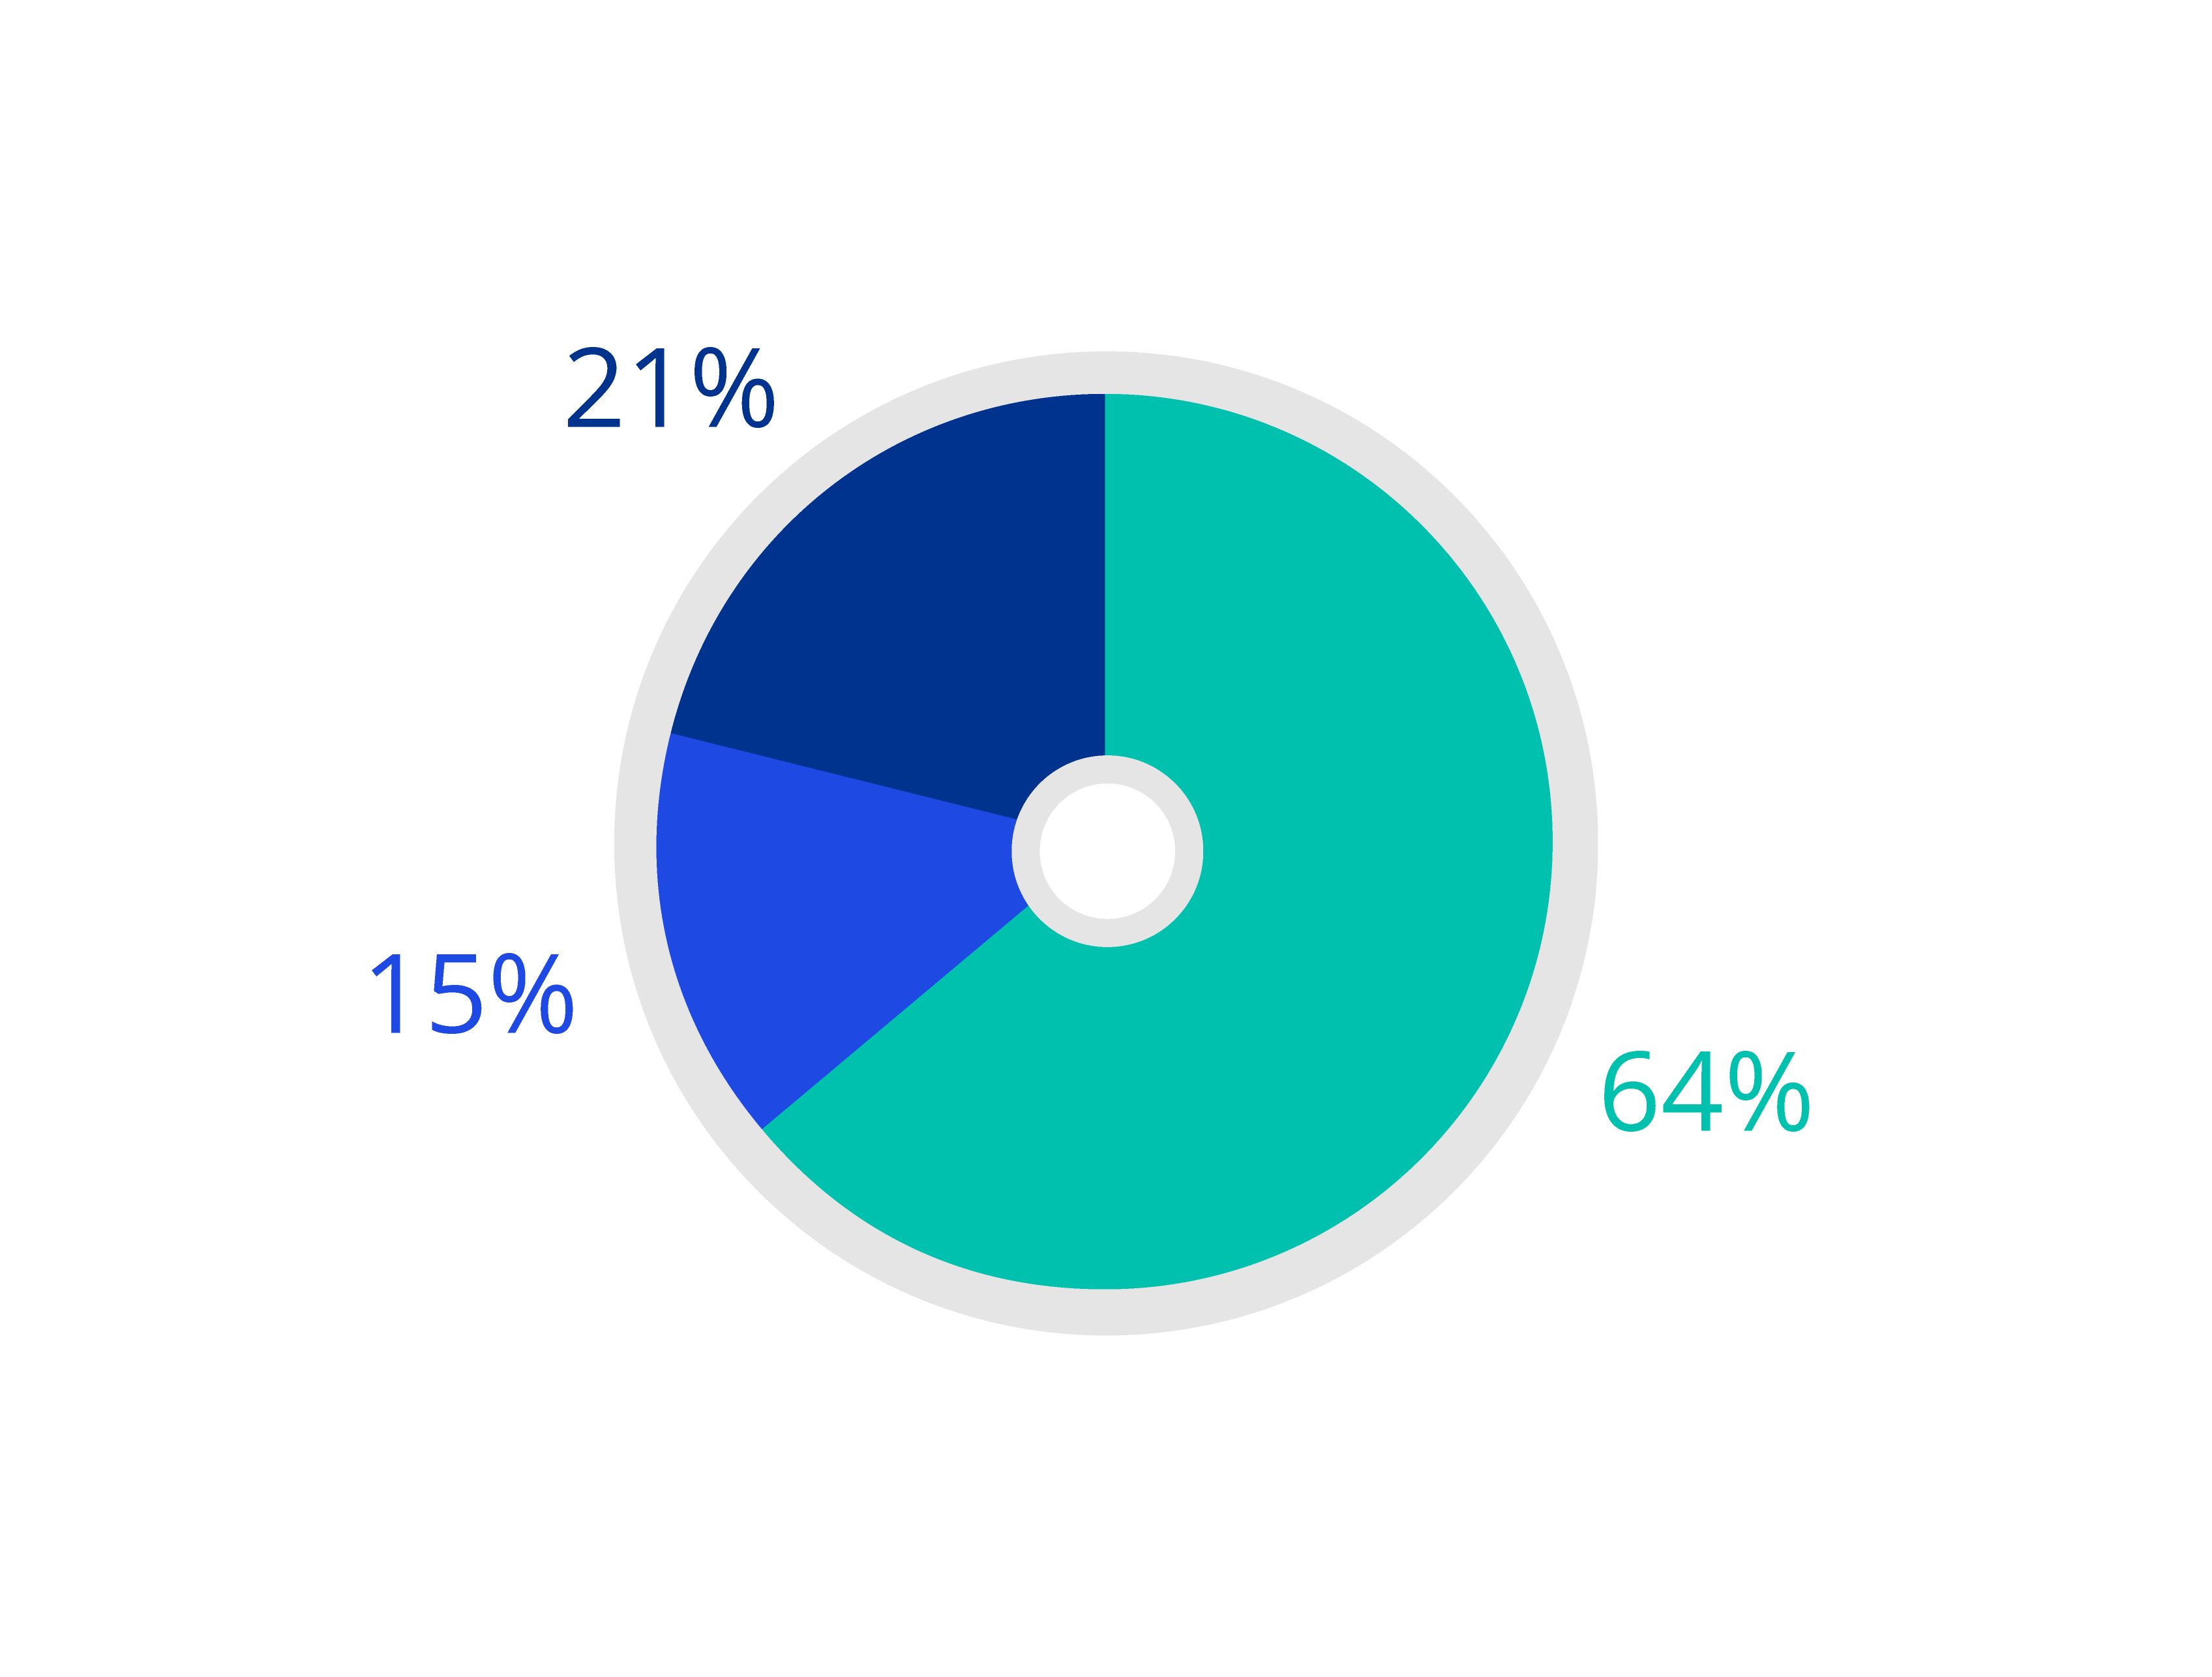
Senior representation includes Partners, Directors and Senior Managers.

2030 target: 29% lower socio-economic background
Our reporting descriptions and methodology is based on guidance from social equality experts, the Bridge Group. We use parental occupation as our measure of socio-economic background. This is based on The National Statistics Socio-Economic classification, which identifies the occupation of the highest earner in your household at age 14 as the most robust indicator of socio-economic background. Low socio-economic backgrounds are defined as NS-SEC 5, 6 and 7 occupations. Examples include receptionists, electricians, plumbers, butchers and van drivers.
*This year’s figures are based on those that have declared this information to us. This is no longer comparable to previous data, as we have updated our methodology to bring it in line with advice from social mobility experts, the Bridge Group.
Junior representation includes Manager level and below, as well as our Graduates and Apprentices.
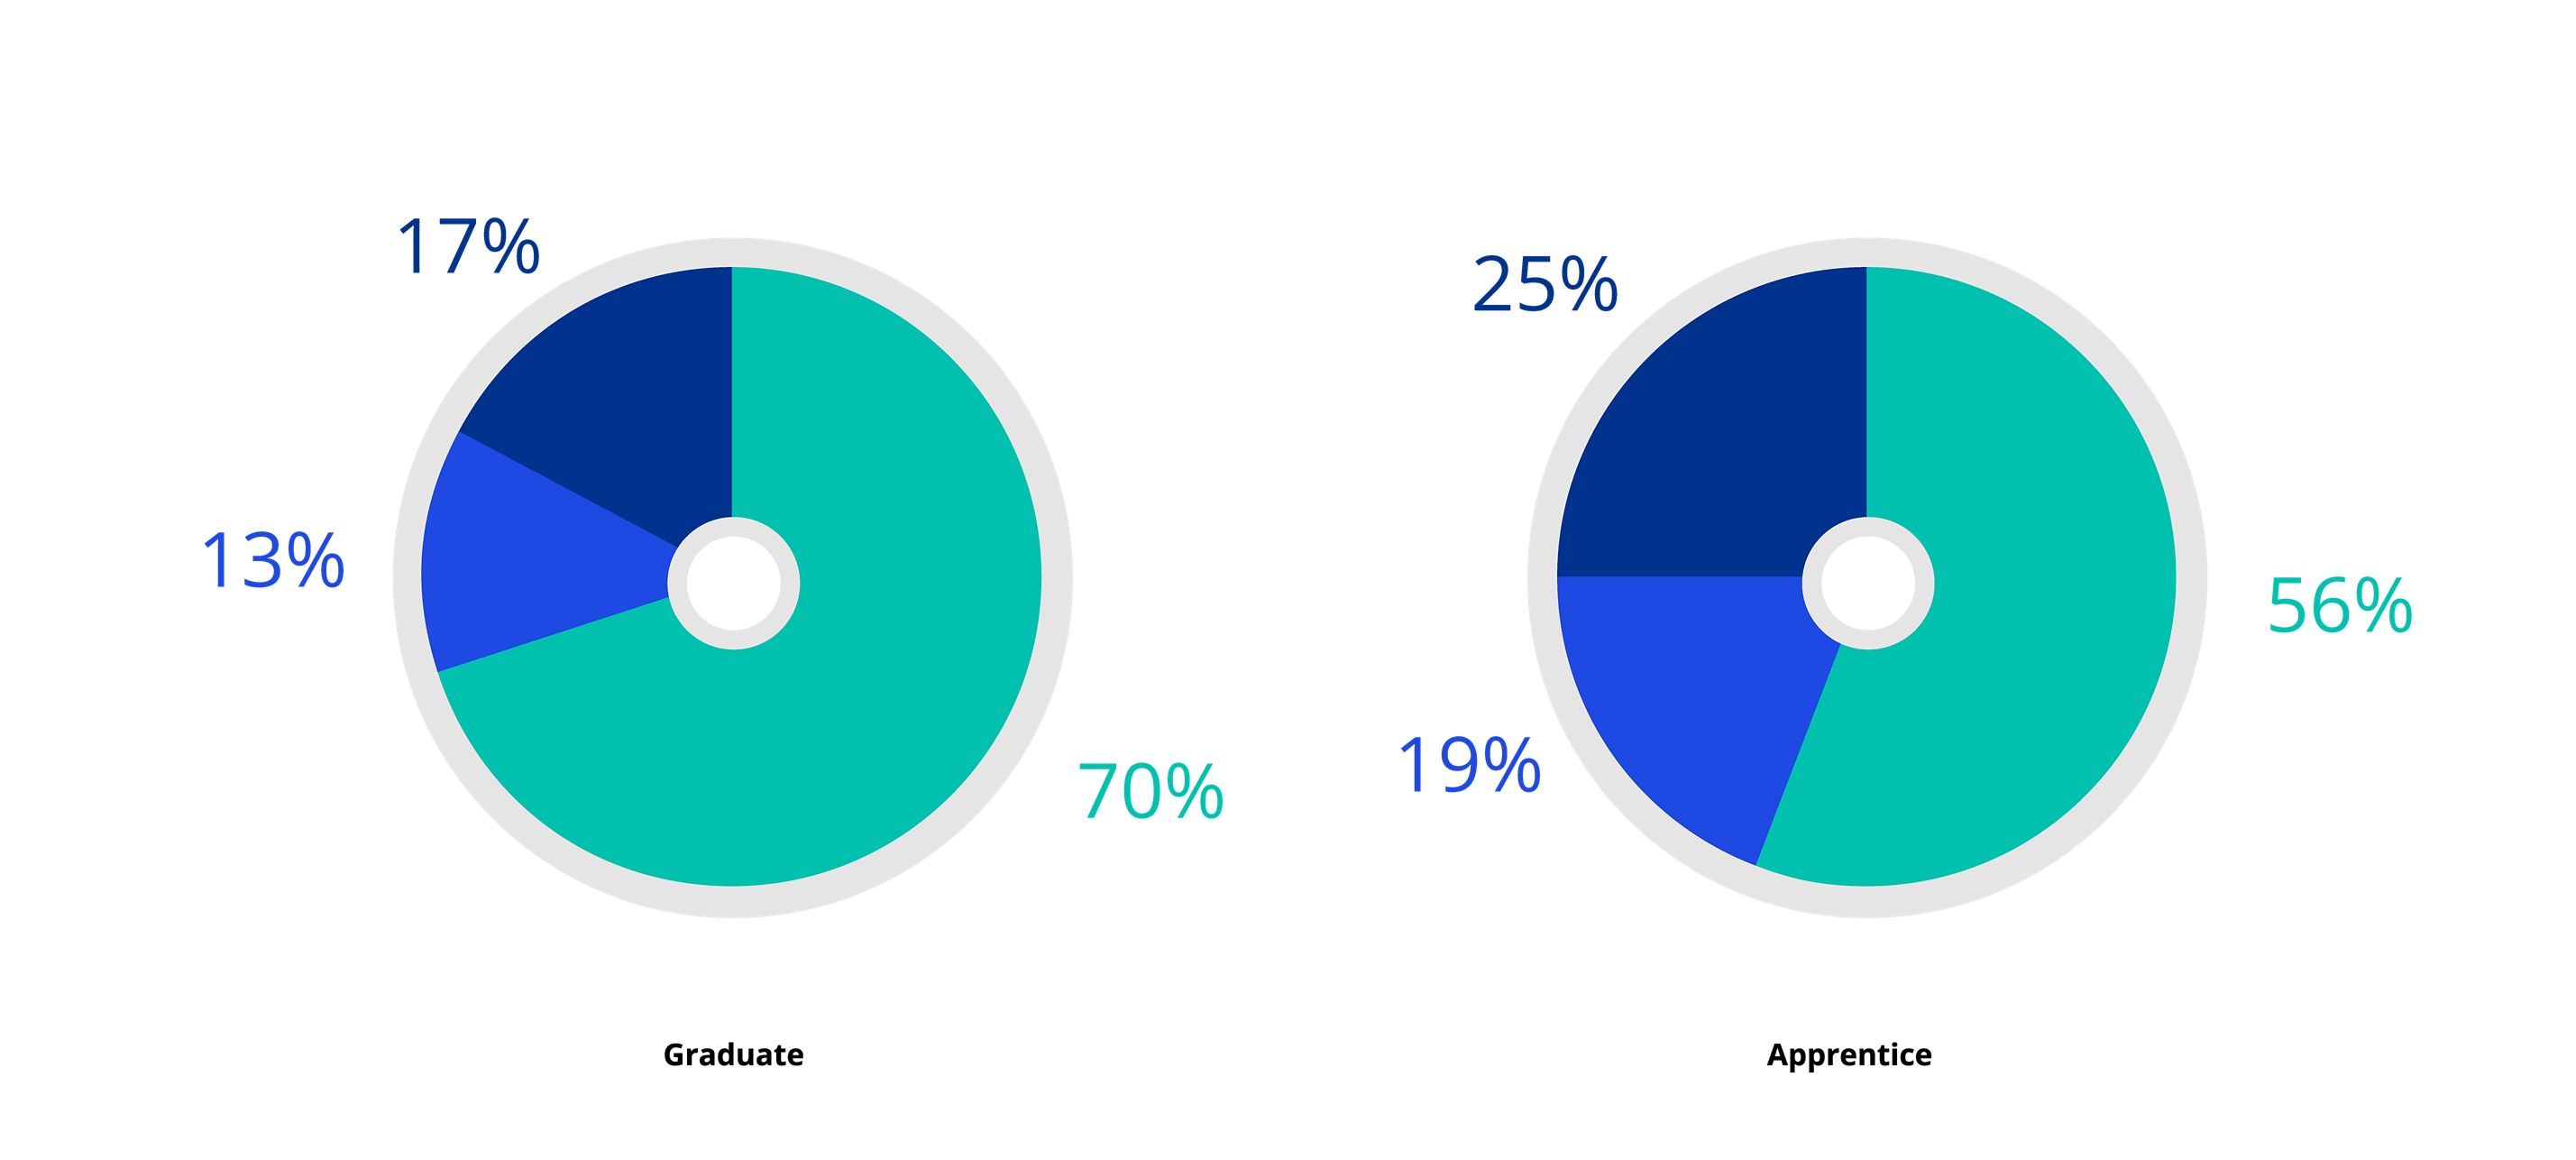
2030 target: 29% lower socio-economic background
Our reporting descriptions and methodology is based on guidance from social equality experts, the Bridge Group. We use parental occupation as our measure of socio-economic background. This is based on The National Statistics Socio-Economic classification, which identifies the occupation of the highest earner in your household at age 14 as the most robust indicator of socio-economic background. Low socio-economic backgrounds are defined as NS-SEC 5, 6 and 7 occupations. Examples include receptionists, electricians, plumbers, butchers and van drivers.
*This year’s figures are based on those that have declared this information to us. This is no longer comparable to previous data, as we have updated our methodology to bring it in line with advice from social mobility experts, the Bridge Group.
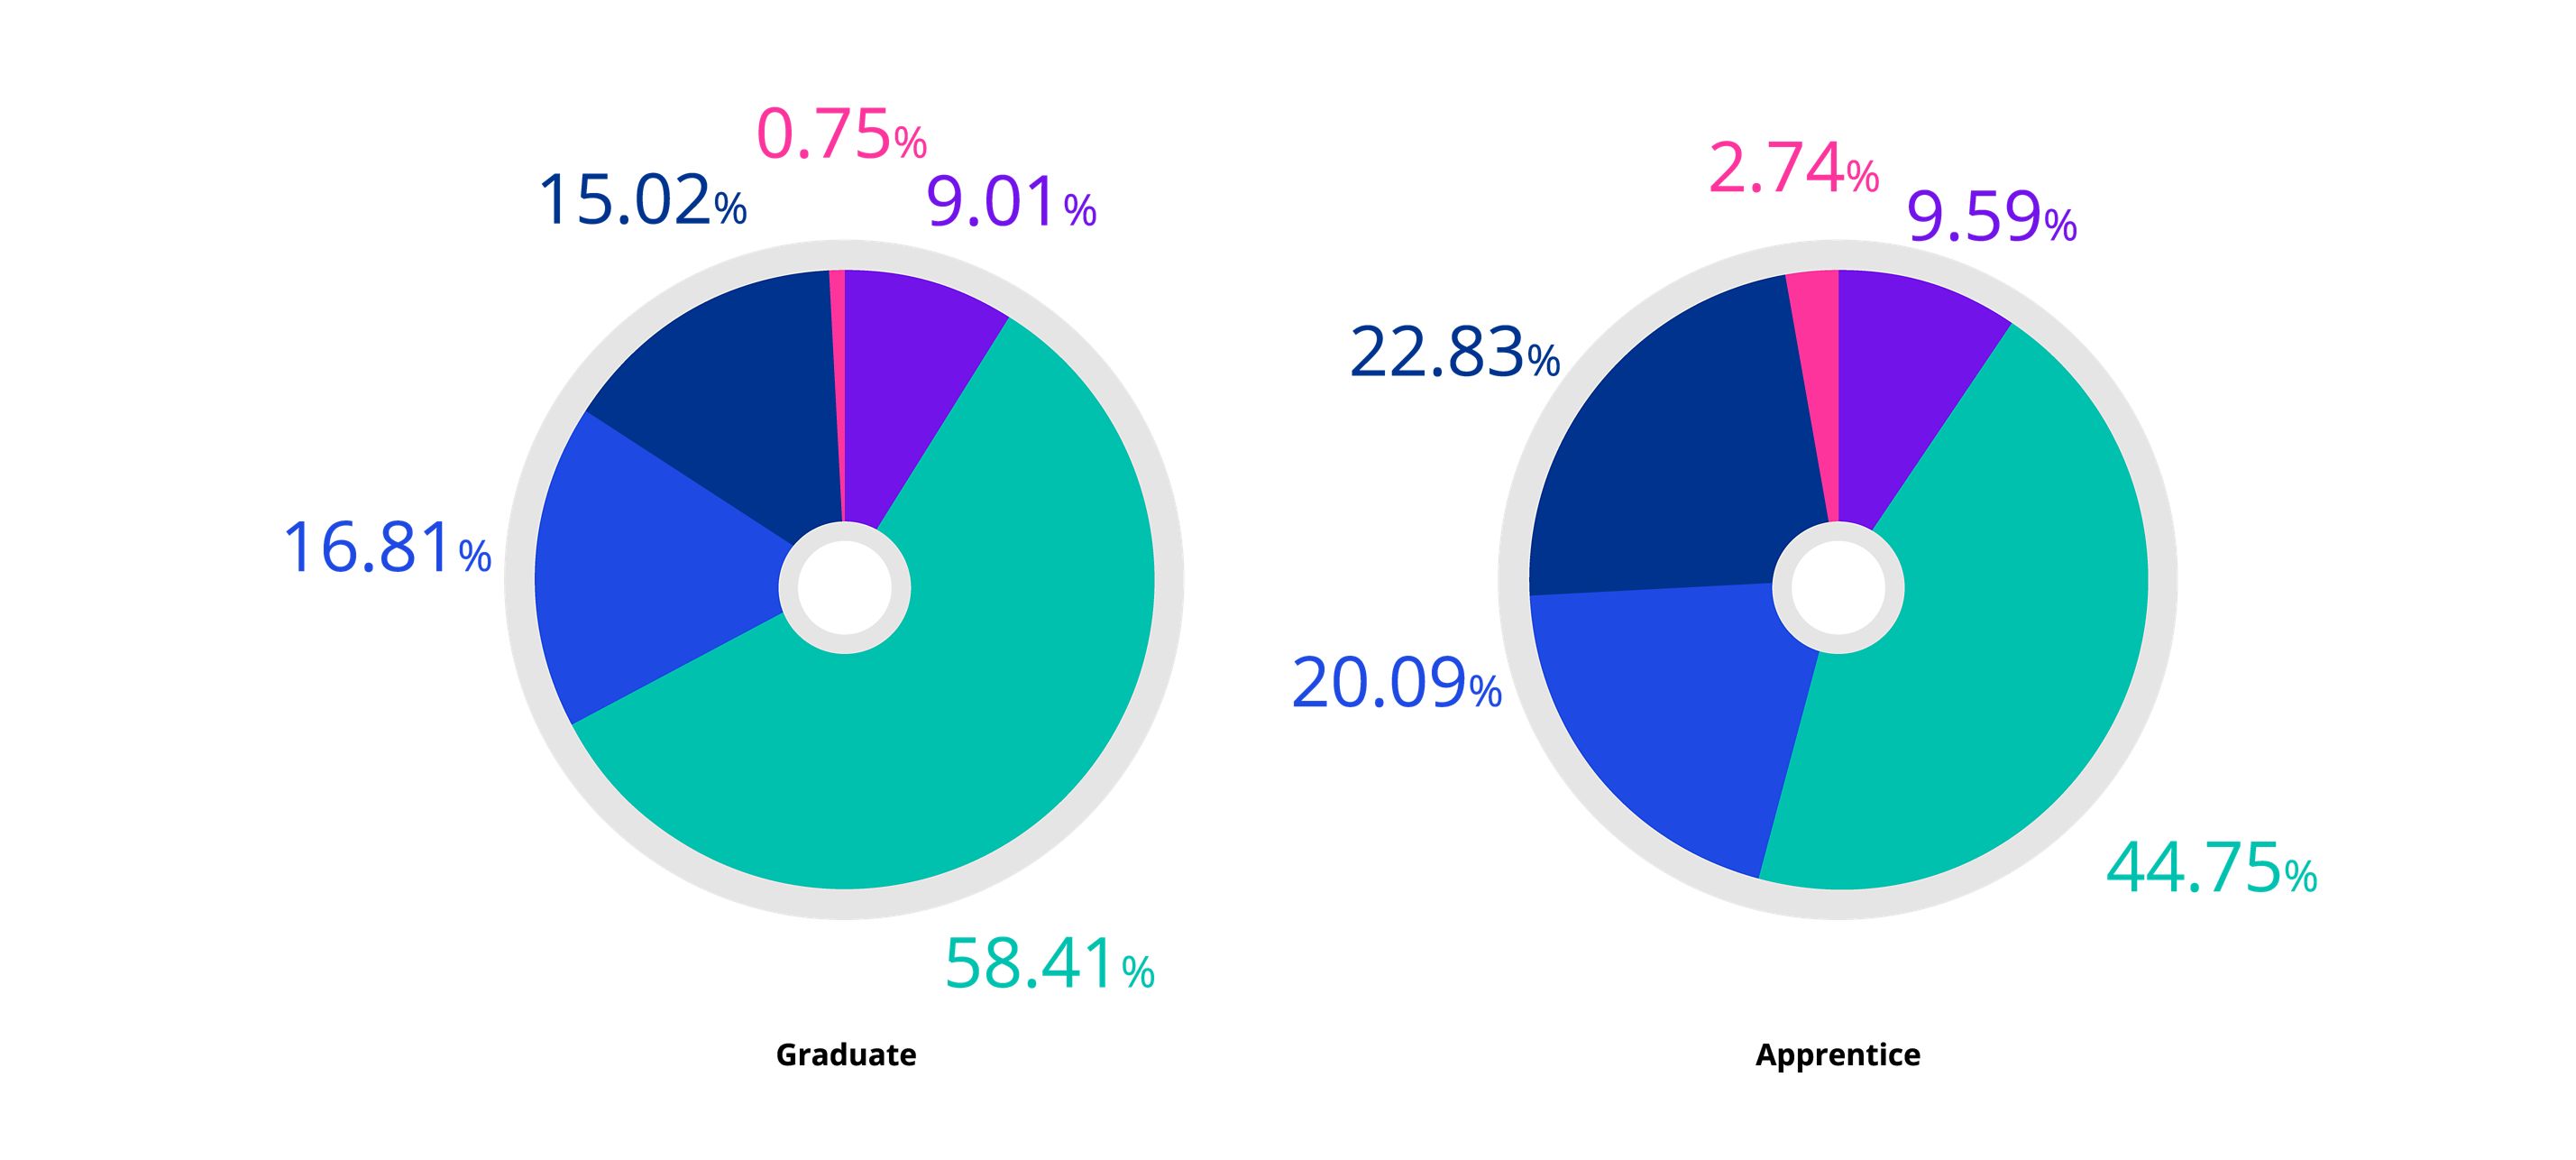
Graduate, school leaver and apprentice offers accepted.
Graduate, school leaver and apprentice offers accepted.
Senior representation includes Partners, Directors and Senior Managers.
Junior representation includes Manager level and below, as well as our Graduates and Apprentices.
Graduate, school leaver and apprentice offers accepted.
Graduate, school leaver and apprentice offers accepted.
Data is as at 1 October
Inclusion, diversity and equity is at the heart of our business strategy. We know that we need to see better representation at senior levels of our firm, so we’ve set long-term targets as part of our 2030 commitments.


Female (minimum 40% female)
Ethnic minority
Disabled
Sexual orientation
Black heritage
Lower socio-economic background
For the purposes of our inclusion, diversity and equity targets, we define leadership as our partners. *40:40:20 requires us to have a minimum of 40% female colleagues and 40% male colleagues in the relevant population. 20% is flexible and recognises the moving nature of our firm, while setting parameters for us to meet and stay within
Our leaders are committed to driving change and are held accountable with set targets and action plans for their respective areas, which they’re measured against regularly.
At partner level, we are investing in inclusive leadership learning, to help support them to build an inclusive culture and sense of belonging across their teams. And we’re driving greater leadership engagement with our Employee Networks, to enhance their understanding and support of historically underrepresented groups’ lived experience.
Our Inclusive Leadership Board, which comprises both internal and external members, is in place to challenge our progress against our commitments to ensure we create an inclusive environment where all colleagues thrive and reach their full potential.
Many of our leaders are also involved with charitable foundations, mentoring initiatives and education programmes to support communities on this agenda.
You can find out more about our Partner diversity here.
*Senior colleagues includes Partners, Directors and Senior Managers.
Helping our networks lead change
Our 16 Employee Networks are open to all, providing a sense of community and learning experiences for those who want to enhance their own cultural awareness or become an ally.
We recognise the importance of having champions at a leadership level for historically underrepresented groups. That’s why each of our Employee Networks have at least one KPMG Partner Sponsor.
Throughout the year they host inspirational and educational events helping to raise awareness for, and to celebrate, key moments in the calendar. They also provide us with vital feedback and insight, by representing and voicing our colleagues’ lived experiences.
In 2022, we introduced firmwide mandatory Inclusion, Diversity and Equity training for colleagues and Partners, and in 2023 launched an inclusive language guide to support us in our journey to embed behavioural change across the organisation.
Click through the carousel to hear how we’re supporting our colleagues through our Employee Networks and wider activity.
We strive to attract people from all backgrounds at every stage of their career and empower them to reach their full potential.
We publish data on new hires and introduced mandatory inclusion, diversity and equity training for all colleagues.
We’re continuing to invest in student programmes focussed on targeting historically underrepresented groups, such as students of Black heritage, from a low socio-economic background, women or those with a disability or long term health condition. Our Insight programmes have been designed to help students find out more about working life at KPMG. Through these routes, students can discover more about the work we do, as well as the teams they could join if they choose to embark on a career with us. Pathways that currently exist include: the Black Heritage Talent Insight programme, Social Mobility Talent Insight programme and a new Abilities Talent Insight programme.
Find out more about our Insight programmes.
We also work with a number of organisations, such as Access Accountancy and the Social Mobility Foundation, to provide work experience opportunities to students from lower socio-economic backgrounds.
Find out more about our Discovery work experience programme.
In 2013, we launched a programme aiming to assist former service personnel with their transition into a civilian life with a career in the professional services industry.
We recognised that partnering with Armed Forces organisations, including Service charities, is a highly effective way of recruiting high calibre talent and supporting our ambition to be a truly inclusive place to work. Over 5 years we have recruited over 130 veterans from all ranks across the Armed Forces, into different capabilities and UK offices, harnessing diverse thinking and valuing the differences that lead to stronger insights and innovation.
We have signed the Armed Forces Covenant, affirming our commitment to support the Armed Forces community and have also been recognised by the Ministry of Defence with a gold award for our positive work – the highest accolade in their Defence Employer Recognition Scheme.
Find out more about our Military Leaver’s Programme.
By using our data and evidence base, we’re able to focus our support on specific challenges and barriers. We recognise that historically underrepresented groups need tailored support and that our identities, backgrounds and circumstances are multi-faceted. We use a cross-section of data to take a holistic approach to inclusion, which ensures that intersectional impacts are visible. We’re proud of the initiatives we’ve created as a result of this and the impact they’re having. Whether it's our award-winning personal development programme, GROW; our mentoring and allyship programmes; or ensuring our promotions, performance, and talent management are fair and proportionate.
While our approach to inclusion is holistic, there are specific action plans in place across each of our capabilities and underrepresented groups, to make sure we’re targeting our efforts in the areas that are impacting them the most.
There’s still a long way to go, but we know this work is already having impact. Recent research by The Bridge Group into progression at KPMG demonstrated that over a 5-year period, the majority of our historically-underrepresented groups progressed as quickly, if not more so, than their counterparts.
In response to the findings, we've launched a targeted promotion readiness programme ‘Reach’, to help support this particular group of colleagues to develop and progress at a comparable rate to their peers.
You can find out more about how we support our colleagues from historically underrepresented groups here.
*This figure is based on those that have declared this information to us.
As well as putting programmes and initiatives in place that support our people, we also ensure that our systems, processes and policies have inclusion, diversity and equity at their very heart. Collecting a robust data set on the diversity demographic of our workforce is an important first step and enables us to understand and address systemic bias across all levels of the employee lifecycle; from entering the workforce to managing talent and addressing potential barriers to progression.
The results of our annual Global People Survey feeds into this data-led approach and allows us to take positive action in areas of greatest need to better support our people. In this year’s Global People Survey the three highest scoring areas for IDE questions were response rates to staff feeling that they; are treated with dignity and respect at work, I can be myself without concern for how I will be accepted, and Partners actively champion inclusion and diversity in the workplace recognising and respecting the value of differences.
In 2022, we published extensive analysis into progression rates at our firm, examined through an inclusion, diversity and equity lens over a 5-year period. This has allowed us to assess the impact our programmes and interventions are having and evolve our action accordingly.
Alongside this, we’ve enhanced our overall approach to inclusion, diversity and equity analytics with the introduction of new technology, with the ambition of being able to provide more in-depth, real-time data in the future. We also use the data and insight we gather to assist with work allocation – a critical component in achieving equal and fair access to opportunities. By combining our extensive data analysis with our dedicated resourcing tools and skills database, we’re able to be deliberate and consistent with the way we allocate opportunities across our firm.
As a firm we’re committed to being transparent about our remuneration and pay gaps. We voluntarily report on our pay gaps against each underrepresented characteristic and in 2021 became one of the first UK businesses to publish our socio-economic background pay gaps.
Whilst being transparent about where we are is critical to making progress, we know pay gaps are just one part of the picture. What's important is what we do with that data. That's why we continually monitor our progress to understand what’s working and challenge ourselves on where we can go further to focus our efforts and increase representation and inclusivity in our firm.
Find out more about our 2023 pay gaps and how we’re addressing them.
Our values of Together and For better guide us to be a force for good in society. From our sponsorship of the FTSE Women Leaders Review which advocates for greater gender diversity at the most senior levels within the FTSE 350 and Top 50 private companies in the UK, to our Cross Company Allyship Programme (CCAP), a mentorship initiative with some of our biggest clients, which brings together senior figures with junior mentees and focuses on supporting those from Black Heritage and ethnic minority backgrounds, working with our clients to inspire confidence and empowering change.
One of our key areas of focus is social mobility. We believe that fair pay is a fundamental driver of social mobility and that paying the real living wage (which we have paid to our employees and contractors since 2006) not only reduces in-work poverty, but also makes business sense – reducing costs to the business through reduced attrition, improving competitiveness through increased productivity, market position and profitability. We were a founding Principal Partner of the Living Wage Foundation and in June 2021, our Head of Inclusion, Diversity and Equity was appointed Chair of the Living Wage Advisory Council. We also have representation on a number of their regional living wage steering groups, including Anna Purchas, London office senior Partner co-chairing ‘Making London a Living Wage City’ Project Steering Group. Our long-standing partnership with the Living Wage Foundation has helped to grow this initiative into a movement of over 14,000 accredited Living Wage employers. Over 460,000 employees have received a pay rise as a result of the Living Wage campaign. Collaboration is key in driving change and that's why we support our suppliers and our clients, where they can, to implement the real Living Wage across their businesses too.
In 2021 we were one of the first organisations to report our socio-economic background pay gaps, working with experts in the field of social equality, the Bridge Group. This is new territory for a lot of businesses, but we hope this work provides a comprehensive framework to help other businesses to follow. In 2022 we went a step further and published extensive analysis into the impact different characteristics, including socio-economic background, have on progression rates at our firm. As part of the report, we included a toolkit to support other businesses to make progress in this area.
We’re also using our own experience to support our clients in transforming their approach to inclusion, diversity and equity (IDE), as a key pillar of their Environment, Social and Governance strategy. Our offering is tailored to IDE maturity, but predominantly focuses on four key areas; understanding the current position through benchmarking and diagnostics; engaging the Board and Executive in the strategy, to ensure alignment and buy-in to commitments; delivering the strategy through transformation of culture, operations, processes and policies; and supporting on regulatory reporting, data analysis and auditing.
While we take a holistic approach to inclusion, diversity and equity, we also have dedicated action plans and initiatives in place to support historically underrepresented groups.