Statistical Approaches to Transfer Pricing
Statistical Approaches to Transfer Pricing
Although the comparative uncontrolled price method (the CUP method) is the primary choice in TP analysis, OECD and Ukrainian government restrictions place limitations on its use. However, there are rare cases that demonstrate the possibility of applying statistical approaches alongside the CUP method. In this way, it is possible to improve the reliability of the CUP method, and increase the flexibility of its application, allowing it to be used for transactions that may significantly differ from each other in commercial terms, and to which adjustments cannot be applied.
Although the comparative uncontrolled price method (the CUP method) is the primary choice in TP analysis, OECD and Ukrainian government restrictions place limitations on its use. However, there are rare cases that demonstrate the possibility of applying statistical approaches alongside the CUP method. In this way, it is possible to improve the reliability of the CUP method, and increase the flexibility of its application, allowing it to be used for transactions that may significantly differ from each other in commercial terms, and to which adjustments cannot be applied.
The approach: the comparison of not just particular prices, but a wide range of pricing data. For example, 1,000 deliveries to a related party and 1,000 deliveries to an unrelated party. However, this approach does require a large quantity of data to be statistically valid.
The statistical method can be applied using four approaches:
1) graphical analysis;
2) interval approaches;
3) hypothesis testing;
4) econometric methods.
In this article we will consider the first three of them in more detail. Econometric methods will be described in later publications.
Graphical analysis.
Suppose that in our controlled transaction (CT), say for the export of sunflower oil, we have a sample of CT prices for FY2018. Export takes place on FOB terms. While trying to compare these prices with prices from the APK-Inform website, we will encounter the problem of not knowing the physical characteristics of the product (they may not be indicated in the data), and these are important for verification of comparability.
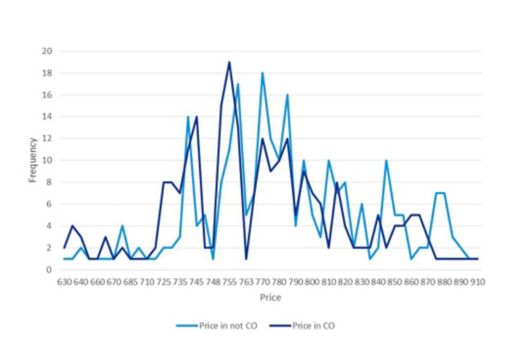
However, if we create a histogram of prices for both CTs and NCTs (non-controlled transactions), over the period under analysis, we can then graphically visualise the price data, showing the frequency of particular price points for both controlled and non-controlled transactions, placing price on the X-axis, and the frequency on the Y-axis.

In this example, the graph shows that prices generally follow the same pattern, so we can assume that prices in NCTs can be used to confirm that prices in CTs are in compliance with the ‘arm's length’ principle.
Interval approaches
Approach based on mean and standard deviation: The standard deviation is the value by which, on average, data deviates from the mean. For example, in a sample of 1, 3 and 5, the mean is 3, and the standard deviation is 2. The advantage of standard deviation is that it is widely used and well established mathematically. Let’s calculate the standard deviation for our data (if you have already picked up a pen and calculator, put them down). For this we need only one function in MS Excel – STDEV. Our data returns the following values: for NCT 58.72, and for CT - 55.86. This difference of less than 3 dollars indicates that the prices are comparable.
Approach based on the confidence interval: This approach is based on the assumption that by sampling data on the mark-up for independent buyers it is possible to construct an interval into which all future mark-ups, including those with related parties, should be likely to fall.
Hypothesis Testing.
Hypothesis testing is based on testing the hypothesis of statistical equality of averages or the dispersion of two data sets to determine their differences. This process consists of setting a hypothesis (in our case, equality of means or dispersion) and statistically testing the data. The statistical test is based on calculating the practical value based on actual data, which is then compared with the theoretical value (the T-test tables) and depends on the quantity of data in the sample and on the probability of rejecting or accepting the hypothesis).
Let’s say you are flying off on vacation, but at the airport you must pass through the metal detector. Our null hypothesis would be that you have no metal objects about your person. The alternative hypothesis would be that you have left some small change in your pocket and will be subject to an additional check. The actual value is whether you have passed the metal detector screening. The theoretical value is the green light and no sound (Hurrah! You are ready to fly). The probability here is your forgetfulness, which led you to leave some coins in your pocket.
To apply this approach in the case of our sunflower oil sales, we need to apply a little more effort (if you have not already given up!). Before running the test, you need to connect the analysis package in Excel and apply any of the t-tests, selecting two samples of data. If the p probability is less than 0.05 you can be sure (to a 95% certainty level) that the prices are comparable.
Practical application of statistical methods in TP-documentation is much easier than it seems at first glance. As we demonstrate above, these methods can be easily implemented using standard MS Excel functions (and one or two non-standard tools).
Considering the very cautious approach adopted by the tax authorities to all methods and models of TP, other than those directly stated in article 39 of the Tax Code of Ukraine, at this stage of development of TP practice, statistical models can be used as an additional argument to justify comparability of data. Unfortunately, however, it is unlikely that they will be accepted as a primary tool in the analysis of comparability in the near future.
Despite the fact that the Tax Code of Ukraine and the OECD both regard the CUP method as a primary tool, its use is not common and has many restrictions placed upon it. The statistical methods we present here can help to justify the applicability of the CUP method, even if there are commercial differences between CT and NCT. Although use of statistics in the TP field in Ukraine is not well established (except perhaps for the use of interquartile ranges), it has great potential both alongside the CUP method, and with other TP approaches.
Denys Vasylenko, Consultant, Transfer Pricing, KPMG in Ukraine
© 2025 KPMG. KPMG refers Limited Liability Company “KPMG Ukraine” and/or Private Joint-Stock company "KPMG Audit" and/or ATTORNEYS ASSOCIATION ''KPMG LAW UKRAINE'', companies incorporated under the Laws of Ukraine, member firms of the KPMG global organization of independent member firms affiliated with KPMG International Limited, a private English company limited by guarantee. All rights reserved.
For more detail about the structure of the KPMG global organization please visit https://kpmg.com/governance.

