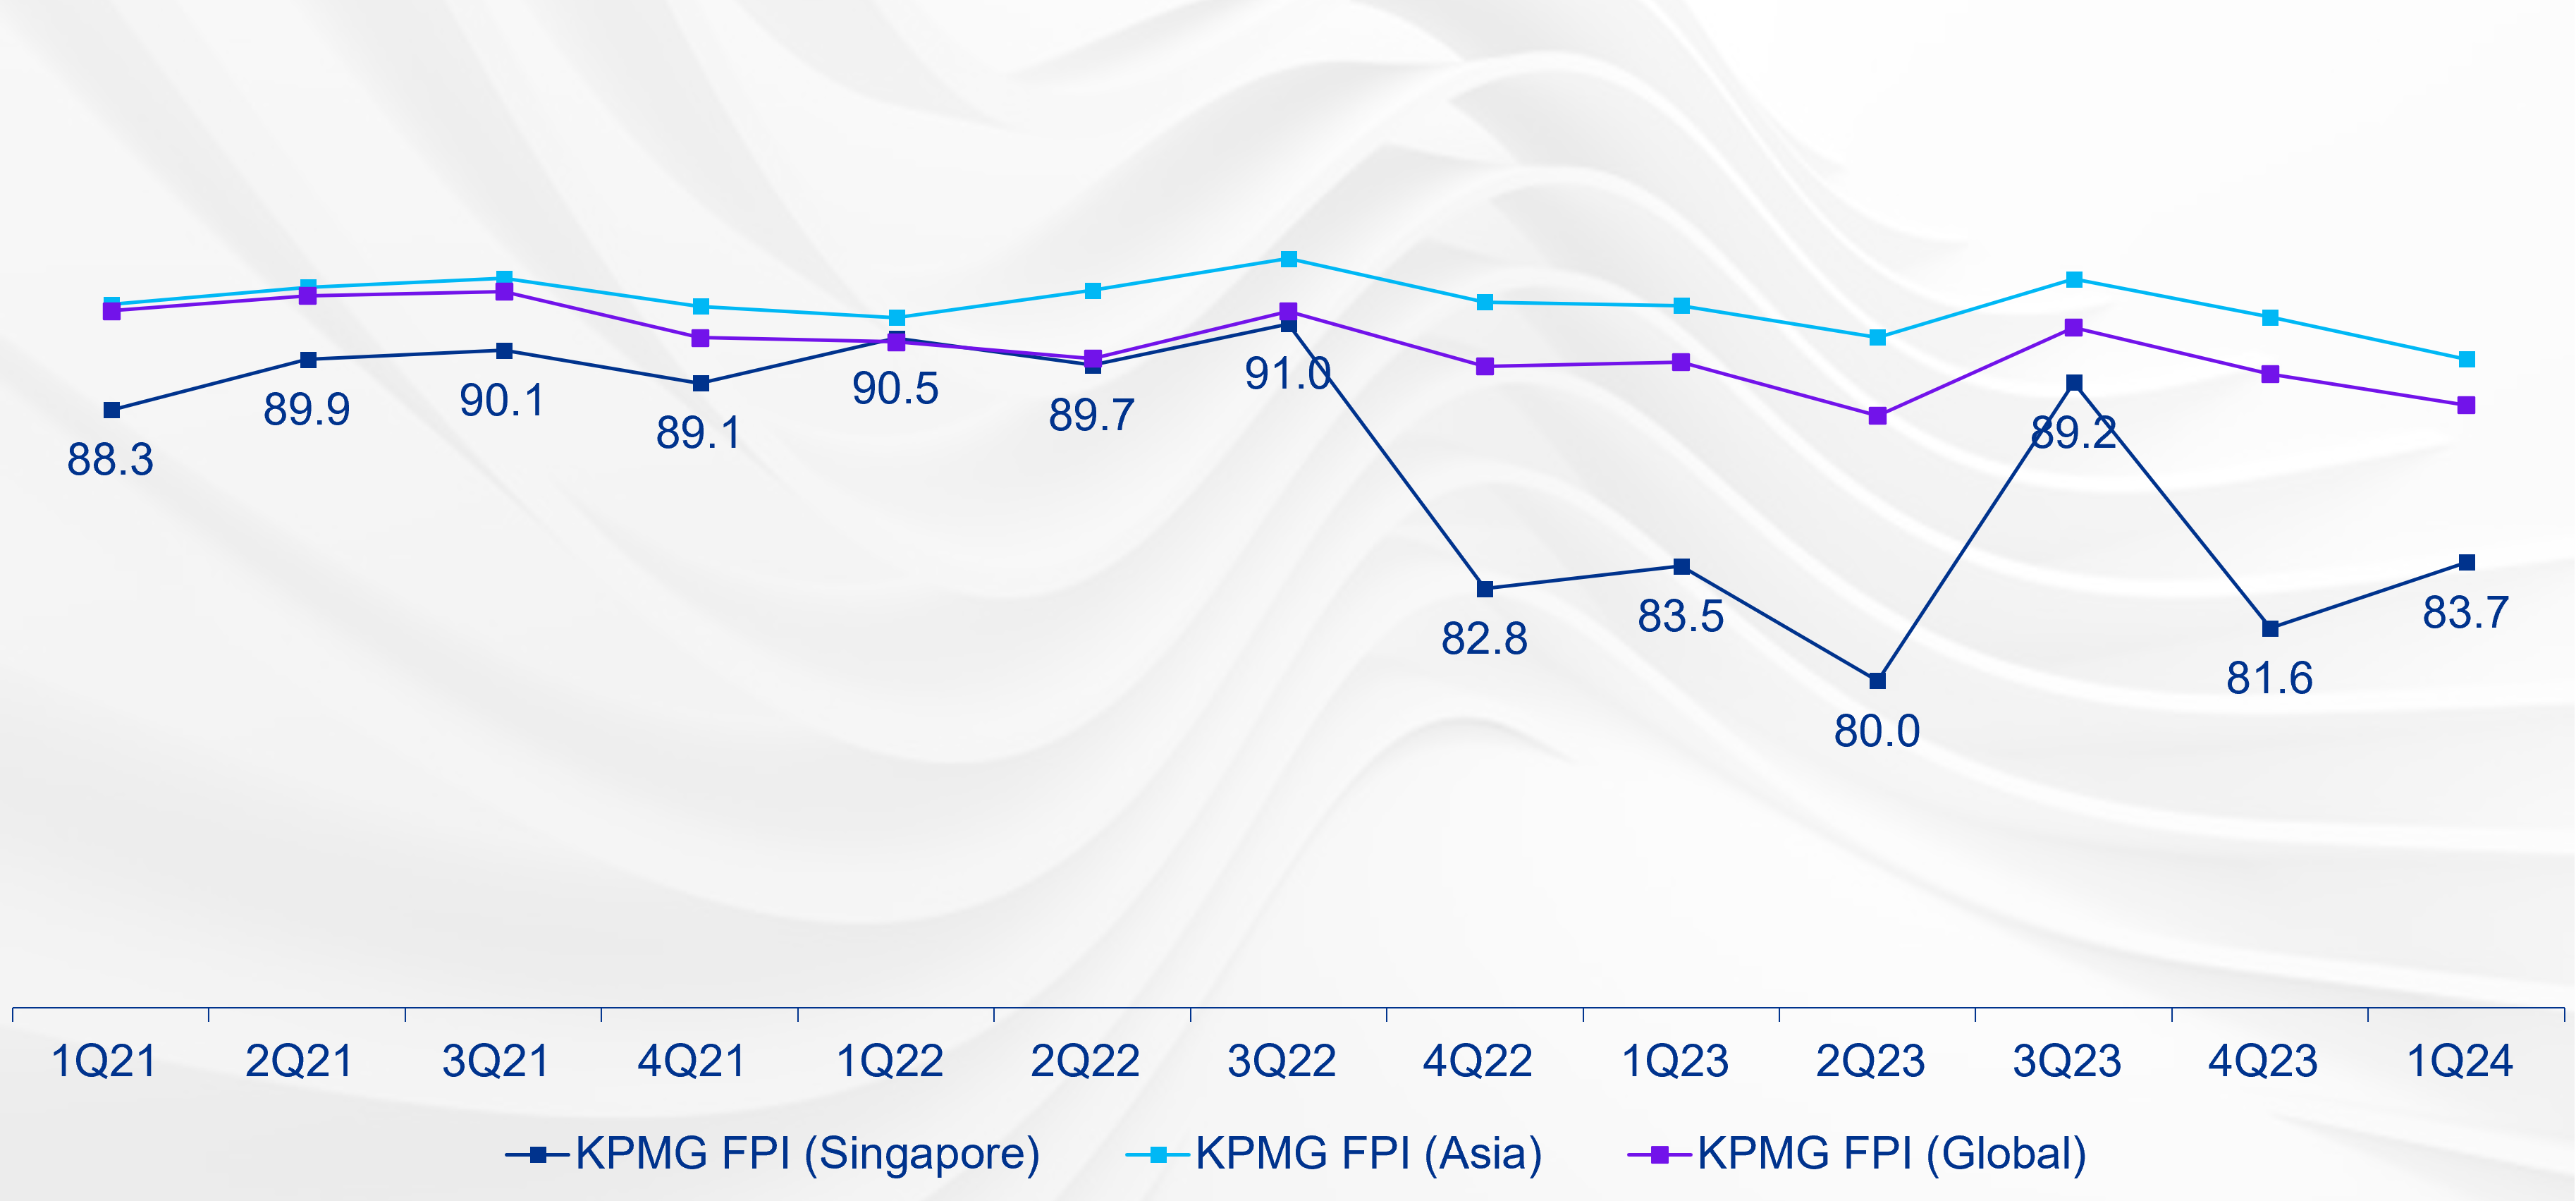
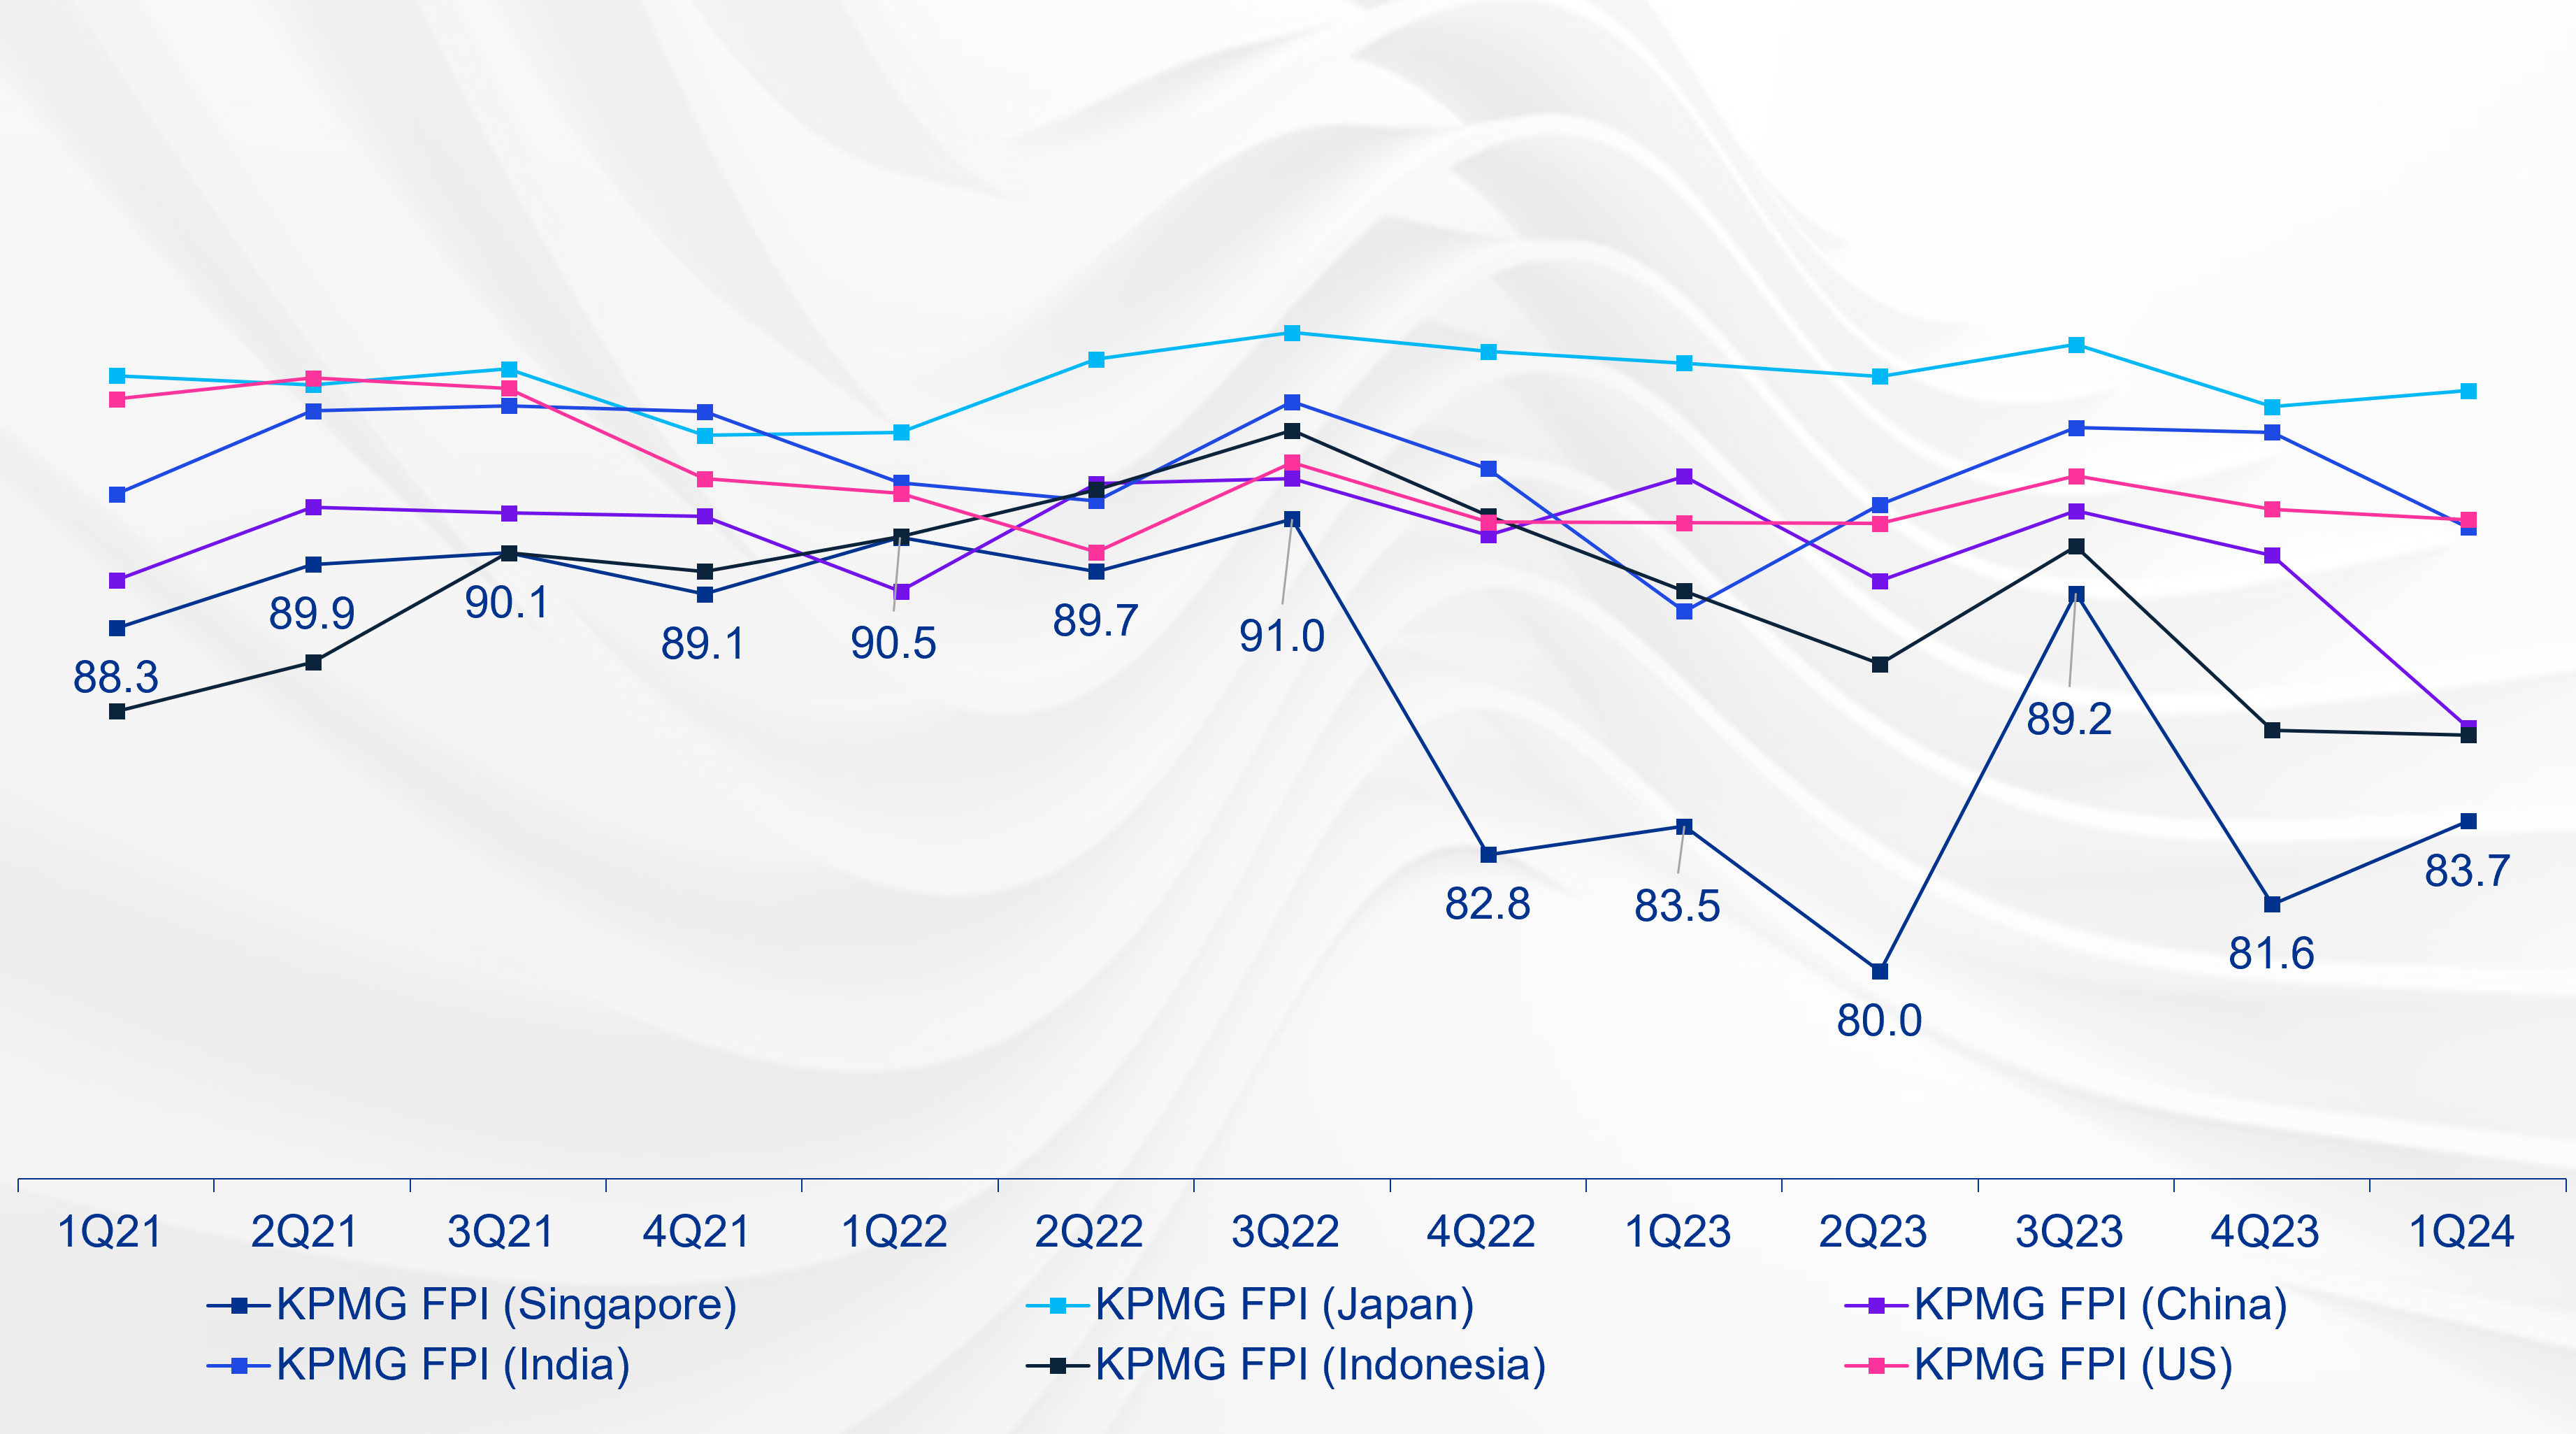
We are pleased to share with you the latest edition of our quarterly KPMG Financial Performance Index (FPI) publication. This publication provides insights into the changing state of corporate health across all companies listed in Singapore across all sectors, following the end of the reporting season for the three months to March 2024. KPMG FPI data is refreshed on a quarterly basis.

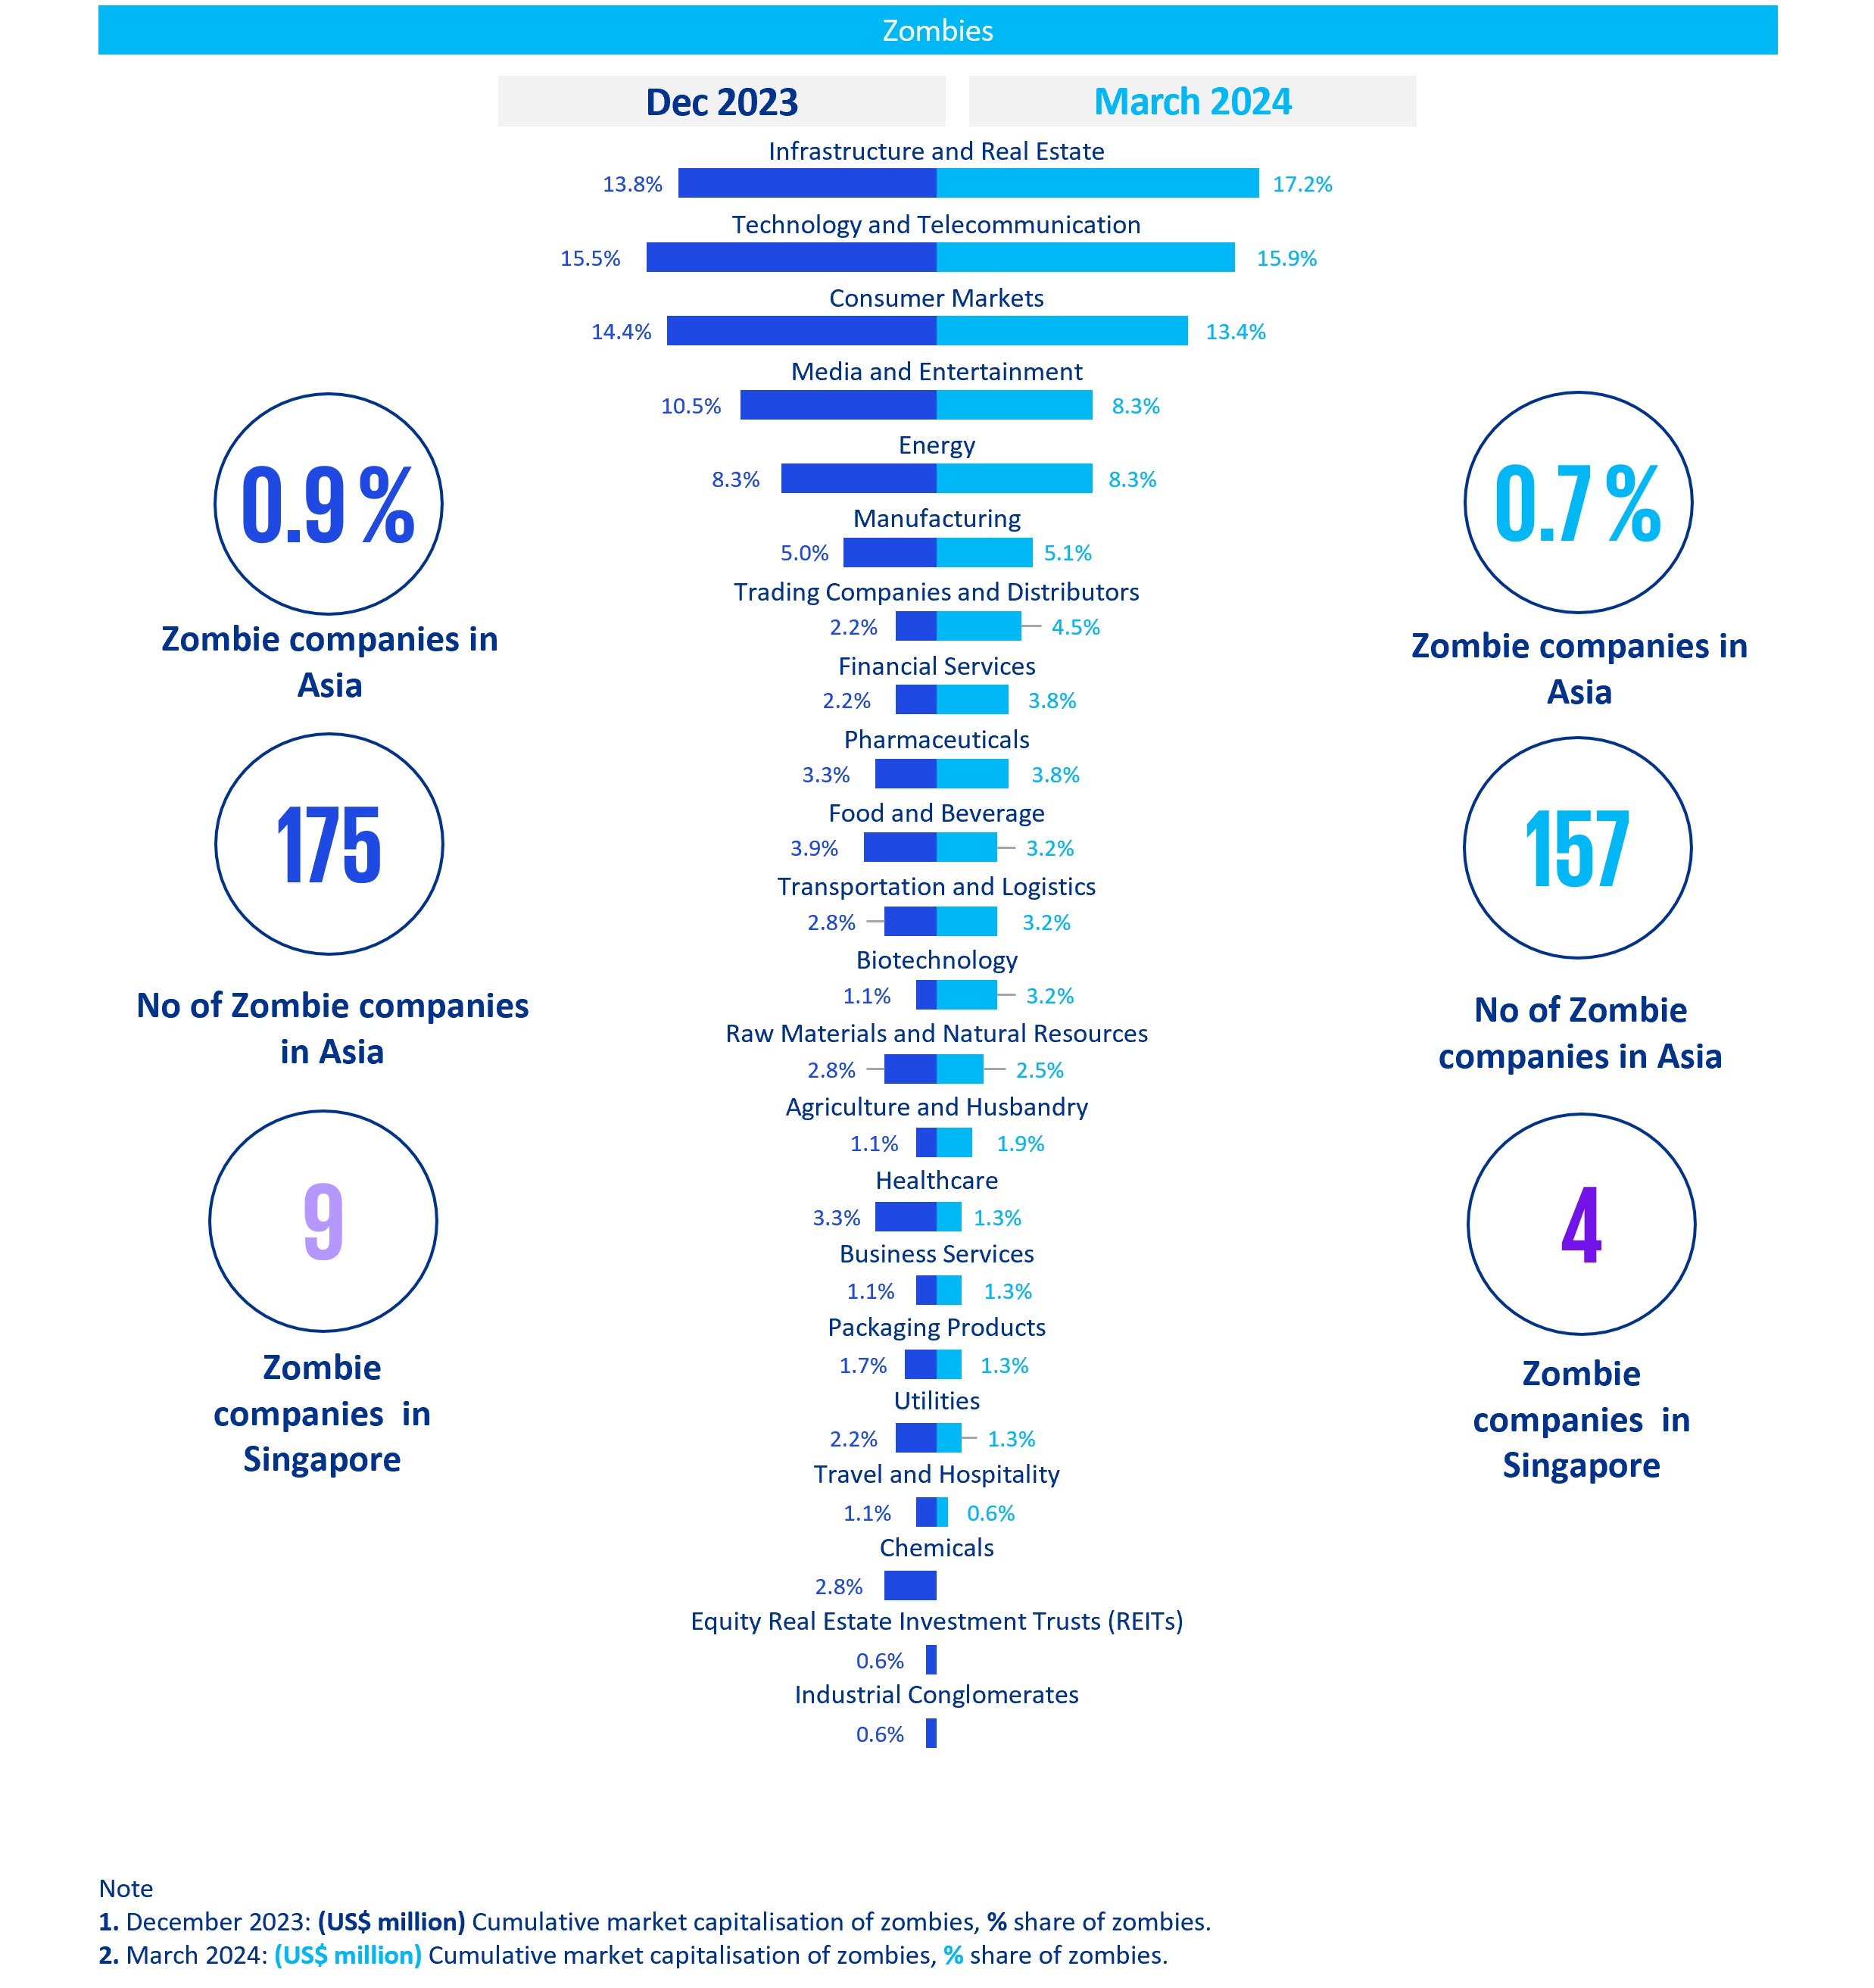
Singapore's financial corporate health improved slightly from 81.6 to 83.7 in FPI scores between December 2023 and March 2024. Out of 76 subsectors in 23 sectors, some businesses saw a big increase in KPMG FPI index by the end of March 2024: Trading Companies and Distributors rose by 44.6% and Business Services by 33.5%. However, Media & Entertainment and Infrastructure & Real Estate sectors dropped by 9.9% and 7.5% respectively.

Singapore FPI performance comparison

KPMG Financial Performance Index (KPMG FPI Singapore) analysed across:


  • The KPMG FPI score for Singapore changed substantially from 1Q23 to 4Q23, with the peak score of 89.2 points in 3Q23. The latest quarter saw the FPI score improving from 81.6 to 83.7 points. But the country lags far behind Asia (90 points) and global (88.5 points) FPI trends in terms of improvement.
  • FPI scored for companies that are listed in regional markets like Japan, China, India, and Indonesia have performed better than those listed in Singapore. FPI scores are particularly high for the Japanese and Indian markets. The same pattern holds true as compared with Western countries such as the US markets.
  • Singapore's economy is expected to expand at 2.4% in 2024, fueled by a rebounding global electronics market and a strong services sector, especially tourism. However, the nation's high dependence on food and energy imports exposes it to trade and fiscal vulnerabilities given the geopolitical uncertainty, requiring careful fiscal policy to cushion the effect of global price changes on households.

Historic FPI movement of Singapore with respect to Asia and global trends


Historic FPI movement of Singapore with respect to India, Japan, China, Indonesia, and US


Sector movers

  • The main reason for the growth in FPI score compared to the last quarter is the performance of the Trading Companies and Distributors, Business Services and Raw Materials and Natural Resources sectors. The FPI score in Trading Companies and Distributors saw a steep rise of 44.6%. Similarly, Business Services and Raw Materials and Natural Resources also added to the overall increase in the FPI score and experienced considerable growth in FPI scores by 33.5% and 8.1% respectively.
  • The general trend for Singapore shows that the best performing sectors are Pharmaceuticals, Utilities, Financial Services and Chemicals, as these sectors have improved the FPI performance by keeping an average above 90 points. However, in the latest quarter from 4Q23 to 1Q24 only Pharmaceuticals and Chemicals sector saw a growth of 5.2%. Utilities and Financial Services saw a small negative growth of 0.9% and 1.1%.
  • Pharmaceuticals sector in the country is one of the strongest as the government along with public/private institutions have invested close to $14 billion USD till 2022. Singapore is expected to receive investments from a leading pharmaceutical organization for up to $1.5 billion USD in 2024.
  • Technology and Telecommunication, which has many sub-sectors, experienced both positive and negative effects at the same time, as Technology Distributors and Electronics Instruments, Components and Manufacturing, one of its sub-sectors, saw a large increase in percentage terms (about 41% and 27% in 1Q24). On the other hand Semiconductors and Semiconductor Equipment and Telecommunication Services saw a big drop in FPI scores of 24.9% and 8.2% respectively, as Singapore’s semiconductor industry, which mainly produces mature node products, did not manage to recover in the first quarter.
  • A sub-sector of Raw Materials and Natural Resources, Metals and Mining had the largest drop among the sub-sectors. It went down by 31.6%.
  • Over the period, from 4Q23 to 1Q24, 17 sub-sectors witnessed growth and 25 sub-sectors witnessed negative growth. Out of the sub-sectors which witnessed negative growth, 13 sub-sectors reported FPI score below 85 points. Notably, even though there’s a higher count of sub-sectors observing declines, the FPI scores of 7 sub-sectors are still ranging between 90 to 97 points, which demonstrates the presence of resilient forces in the Singapore market.

From December 2023 to March 2024


Strongest and weakest sector outperformers


From December 2023 to March 2024


Strongest and weakest sub-sector outperformers


Singapore economy and landscape

  • The projected 2.4% economic growth in 2024 is expected to be driven by the resurgence of global electronics demand, particularly in the latter half of the year, along with continued support from the services sector, especially tourism and related industries. This indicates the importance of external demand and the services industry in driving Singapore's economic growth.
  • Singapore is also managing inflation in its market; the country is witnessing a two-and-a-half-year low inflation numbers. Headline inflation in the country slowed to 2.7% (March 2024) lower than 3.4% which was recorded in February 2023. The primary reasons for a dip in inflation are the decline in private transport costs and the decline in core inflation which was due to lower food and services inflation.
  • The government's counter-cyclical fiscal management approach and the expected fiscal surplus for 2024-25 suggest a prudent fiscal stance. However, the increase in the goods and services tax (GST) from 8% to 9% in 2024 is a necessary measure to keep pace with rising fiscal spending linked to demographic aging, social support, and infrastructure development. This highlights the challenges of balancing fiscal sustainability with meeting the needs of an aging population and infrastructure investments.
  • Singapore's heavy reliance on imports to meet most of its domestic food and energy demand leaves the country vulnerable to fluctuations in global prices. This poses a risk to the goods trade balance and the fiscal account, as authorities may need to allocate significant fiscal resources to cushion the impact of food and energy price rises on households. This underscores the need for diversification of energy sources, enhancing food security, and prudent management of fiscal resources to mitigate external price shocks.


Trends of Zombies in the KPMG FPI

  • Zombies are companies close to default (scoring 0 on the KPMG FPI) for three or more consecutive quarters. These companies may already be experiencing distress or working through restructuring strategies.
  • In the Asian financial market, the number of zombies has reduced quarter over quarter from 175 in 4Q23 to 157 in 1Q24. The highest Zombie share has been accounted for Infrastructure and Real Estate (with 17.2% contribution), Technology and Telecommunication (with 15.9% contribution) and Consumer Market (with 13.4% contribution).
  • For Singapore, a similar trend has been observed with respect to the Asian market, where the number of zombies decreased from 9 to 4 in the latest quarter 1Q24. Infrastructure and Real Estate, Media and Entertainment, Technology and Telecommunication and Trading Companies and Distributors each account for 1 Zombie company in 1Q24.
  • Consumer Market, Chemicals, Business Services, Financial Services and Equity Real Estate Investment Trusts, which accounted for Zombie companies in 4Q23 showed improvement and there were no Zombies accounted in 1Q24.

About KPMG FPI

The KPMG FPI is a metric used to measure a company’s financial health by its ‘probability to default’. The analysis has been prepared using John Y. Campbell, Jens Hilscher, and Jan Szilagyi’s probability to default formula which takes into account financial information and market data. The KPMG FPI score ranges from 0 - 100. The lower the KPMG FPI score, the more likely a company is to default. In contrast, the higher the score, the less likely it is to default. In this analysis, released every three months, we analyse the KPMG FPI score movements of publicly listed companies in Singapore (following the reporting season of full year and half year results) to draw insights into corporate health across the Singaporean economy.

KPMG FPI combines both market and financial information to determine a company’s relative financial health. KPMG believes that combining the two types of information detects deteriorating corporate health more effectively than either source alone.

Global analysis

The global version of this tool is also available.


How we can help

To understand your company’s current index score, or to uncover deeper insights about specific markets or segments, contact us today. KPMG’s global network of professionals have the data, sector, and geographic expertise to help you understand your score and tie it back to your business needs. Whether it is benchmarking, identifying targets, comparing sectors, or looking for trends over time, KPMG professionals can connect you to the information you need to capitalise on your opportunities.


Connect with us