In the 2023 EBA Stress Test, the EU banking sector has demonstrated ongoing financial resilience – despite the current uncertainty in the macroeconomic environment.
In this article, Ian Nelson and Adrian Toner of our Banking team consider the key performance drivers for the significant institutions that took part in the EU-wide exercise set by the EBA. We highlight the drivers of the level of Common Equity Tier 1 (CET1) capital depletion in the Adverse scenario (i.e., the amount of initial capital eroded through the forecast period in the stressed scenario).
In particular, we focus on the Irish banks’ performance – and compare the drivers behind their performance with EU counterparts – as well as changes from the previous stress testing exercises.
Key observations
- In the 2023 EBA Stress Test, the EU-banking sector has demonstrated ongoing financial resilience – despite the current uncertainty in the macroeconomic environment.
- Across the EU, overall depletion in the CET1 capital ratio was 459 bps (c.f. 485 bps in the 2021 exercise). The lower capital depletion was primarily driven by higher earnings and lower credit risk losses.
- For the Irish banks, there is an improving trend in performance, resulting mainly from their strong initial capital position. However, capital depletion over the stressed period was higher than the EU-average; therefore, continued vigilance is required to manage key vulnerabilities.
- Deficiencies remain in banks’ modelling capabilities, particularly around sectoral level breakdowns. This was highlighted by the ECB, which recommend strong enhancements, including the collection of more granular data. This will be critical in the coming years, particularly with the upcoming climate risk stress test in 2024.
Background
- The EBA has published the latest results of their biennial stress testing exercise. The exercise involved 70 banks from 16 EU and EEA countries, covering 75% of EU banking sector assets.
- The stress test requires a 3-year forecast (2023 – 2025), for common macroeconomic scenarios (Baseline and Adverse) under a prescribed methodology, with several constraining assumptions.
- In terms of macroeconomic factors, the geopolitical tensions lead to a severe GDP decline in the 2023 adverse scenario, with severe shocks also applied to economic growth, unemployment alongside persistent inflation and high interest rates.
- There is no pass/fail threshold; instead, the outcomes form part of the supervisory dialogue, with qualitative outcomes informing P2R and quantitative outcomes impacting P2G, under the risk governance element of the Supervisory Review and Evaluation Process (SREP).
EU results overview:
The EU CET1 capital ratio decreased from 15.0% (Dec-22) to 10.4% (Dec-25) – an overall CET1 depletion of 459 bps (c.f. 485 bps CET1 depletion in the 2021 exercise). The lower capital depletion was mainly driven by (i) notably higher earnings (356 bps vs. 290 bps); and (ii) lower credit risk losses (-405 bps vs. -423 bps):
- The largest contributor of the Higher earnings is Net Interest Income (NII), reflecting the increase in interest rates (184 bps deviation in 2023 compared with 47 bps in 2021) in the Adverse scenario. Administrative expenses also offset the positive contribution of NII.
- The impact of Credit losses (-4.05%), whilst the most material negative contributor, is lower than the previous exercise. This reflects the increase in initial asset quality (1.6% stage 3 share vs 2.1% in 2021) and higher provision overlays, due to the current uncertain macroeconomic and geo-political outlook. Corporate and SME exposures account for over half of total credit losses (approximately 60% of credit losses in 2025).
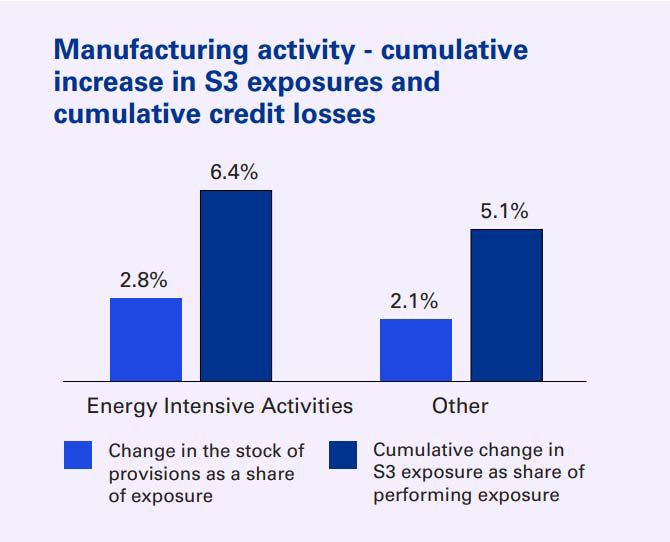
For the first time, this year’s exercise included an assessment of credit risk at the sectoral level. The results show that the manufacturing sector accounts for a fifth of the losses in corporate exposures – with loss rates for energy intensive companies being notably higher (see graph below). The accommodation, food services and construction sectors experience the highest loss rates and are the sectors most negatively affected by the scenario.
However, results show weak correlation between loss rate impacts and the Gross Value Added (GVA) shocks. This suggests that further improvement in modelling capabilities is needed to accurately model the sectoral projections. For the 2023 exercise, there was a reliance on sensitivity analysis rather than developing models to accurately project loss rates which correlate to the GVA shocks.
Overall, the results show that EU banks, on average, finished the exercise with a fully loaded CET1 capital ratio above 10%. This demonstrates that EU banks hold sufficient capital to continue to support the economy in times of severe stress.
Irish banks' performance
In the 2023 exercise, out of the 16 EU countries, Ireland was ranked:
- 4th for its starting CET1 ratio in 2022 (17.5%);
- 7th for its final CET1 ratio at the end point in 2025 (12.0%); and
- 13th in terms of overall CET1 deterioration (-549 bps), which was higher than the EU average (-459 bps).
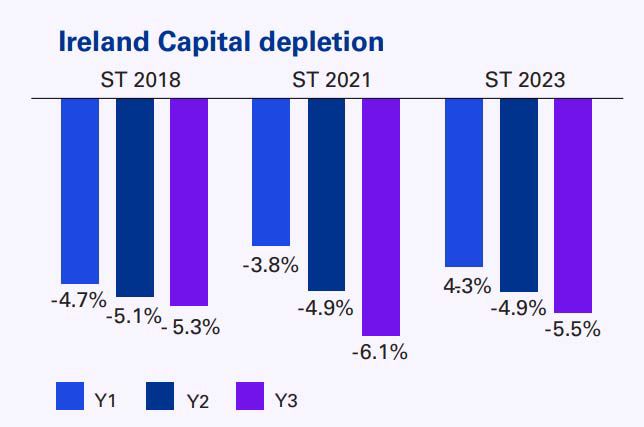
Compared to the 2021 Stress Test, the CET1 depletion for Irish banks is lower (-549bps vs. -607bps). Similarly, to the observations at an EU level, the lower capital deterioration was mainly driven by notably higher earnings and lower credit risk losses. This graph illustrates the evolution of the capital depletion over the last 3 stress tests (2018, 2021 & 2023).
The key focus areas are outlined below:
Starting CET1 ratios
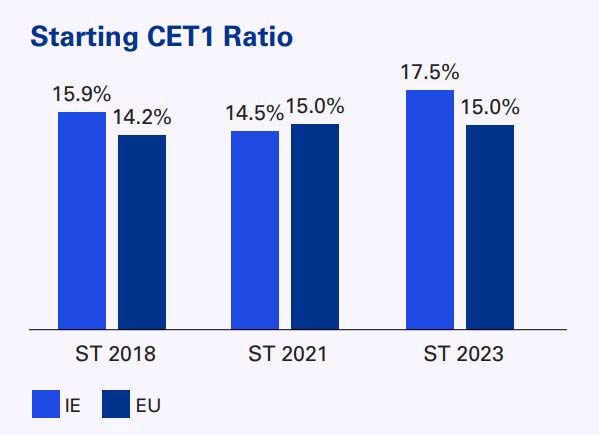
While EU banks’ initial CET1 ratio remained at 15.0%, Irish banks CET1 ratio increased by 3.0% to 17.5% from the 2021 Stress Test. The lower CET1 ratio in the 2021 exercise was highly impacted by adjustments for the Covid-19 pandemic. The 17.5% ratio is also notably higher than the pre-Covid level at 15.9% in the 2018 exercise. The improved starting point increases the ability of the Irish banks to absorb future losses.
Earnings
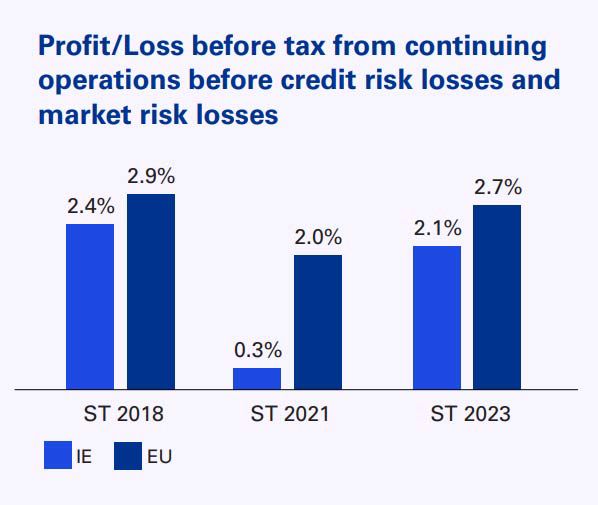
- The contribution of pre-impairment profits dropped from 2.4% (ST 2018) to 0.3% (ST 2021), and then increased to 2.1% (ST 2023). This movement was primarily driven by a significant reduction in NII in ST 2021, and a subsequent increase in ST 2023. The increased NII in the 2023 exercise results from a combination of a higher starting value and positive projections for interest rate growth under the adverse scenario.
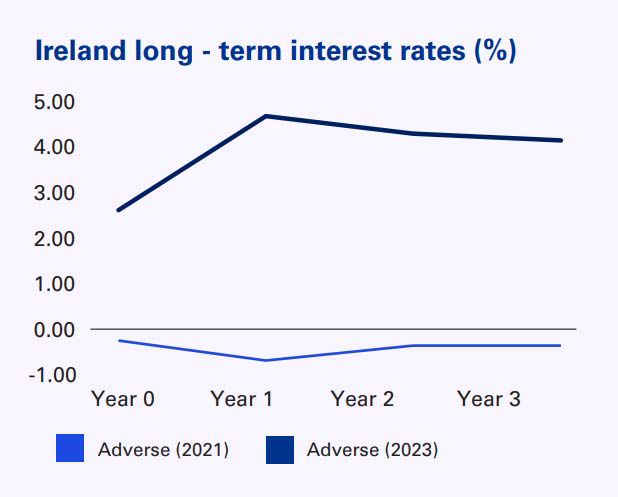
- The Irish banks’ pre-impairment profits impact (2.1%) is consistently lower than the EU equivalent (2.7%), as shown below along with the scenario interest rates and NII figures. The difference can mostly be contributed to the lower interest rate environment, 2.6% long-term interest rate starting point (ST 2023) for Ireland compared with the 3.11% of EU average.
Credit risk
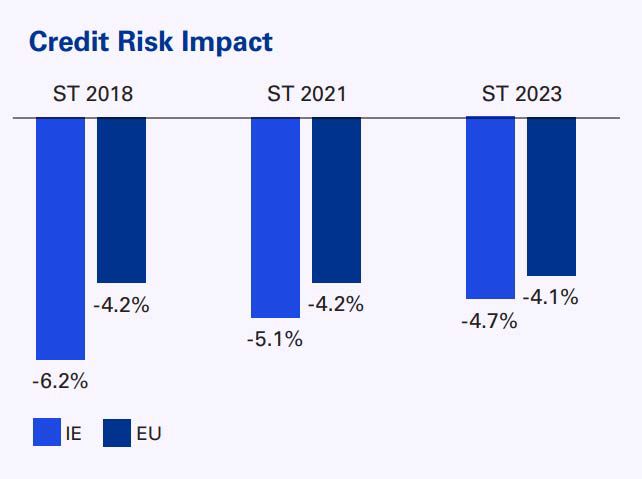
- The credit risk losses are the main negative contributor for both Irish and EU banks. Over the recent stress testing exercises, Irish banks absorbed higher impairment levels than their EU counterparts in the adverse scenario. In ST 2023, credit risk losses reduce the CET1 capital ratio by 405 bps for the EU; but has a greater impact of -465 bps in Ireland as of Year-end 2025.
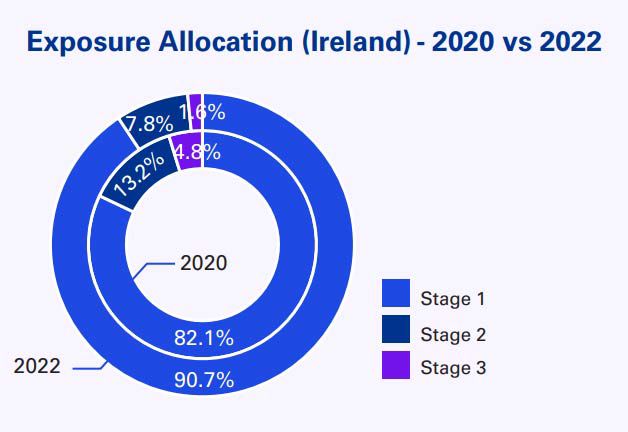
- The improvement in the credit quality of the Irish banks’ exposures is evident in the starting point data. The initial proportion of stage 2 exposures has reduced from 13.2% (2021 ST) to 7.8% (2023 ST), and the share of stage 3 exposures has also reduced from 4.8% to 1.6%.
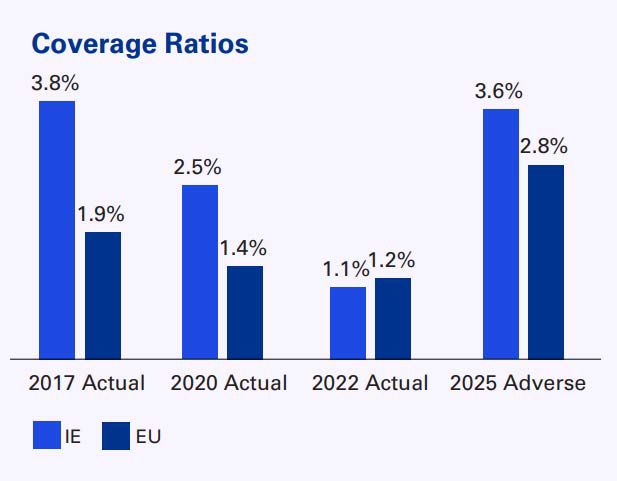
- The starting ECL coverage ratio for Irish exposures has improved from 3.8% (2017) to 1.1% (2022), which is marginally lower than the EU average (1.2%). However, under the Adverse scenario, the ECL coverage increases to a peak of 3.6% in 2025, which is higher than the EU equivalent of 2.8%. This means that Irish banks deteriorated more in credit quality through the stress test when compared to their counterparts.
- Overall, whilst credit risk represents the main negative contributor on the CET1 depletion, the impact is lower than in previous exercises, reflecting the much-improved starting position, with respect to better initial asset quality.
Market risk
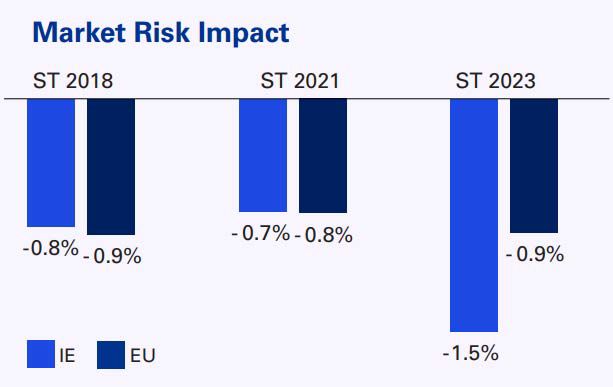
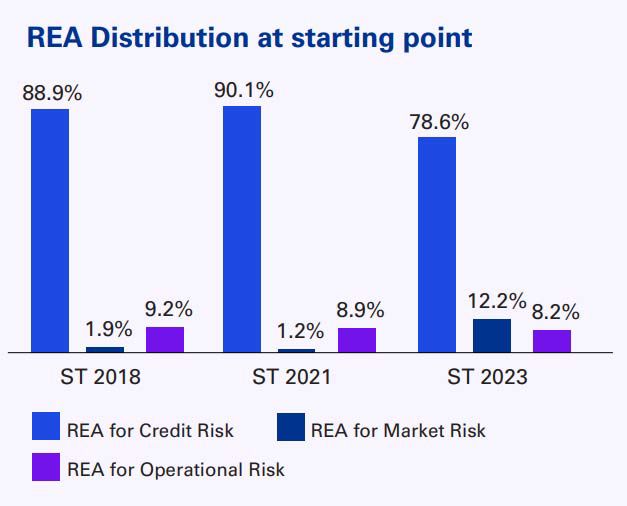
The impact of market risk on CET1 deterioration has increased in this stress test, from -0.7% (2021) to -1.5% (2023). This is primarily driven by the higher concentration of risk exposures for market risk at the starting point – increasing from c. 1.2% in the previous exercises to c. 12%.
Risk weights
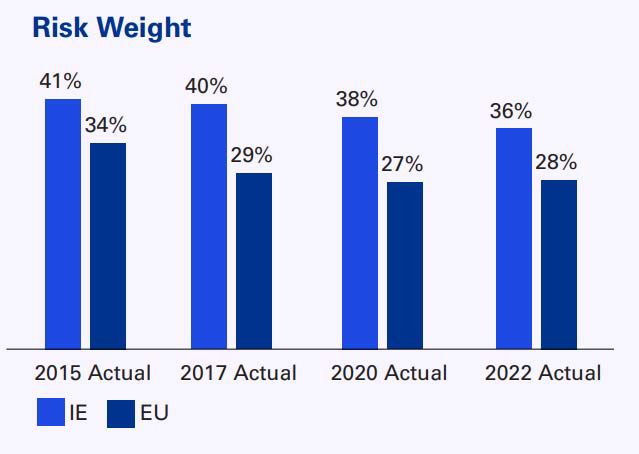
As in previous exercises, Ireland continues to have higher risk weights when compared to the EU average values. This trend of risk weight densities is shown on the graph below. This trend, alongside the constraint of the RWA floor, means that Irish banks carry higher capital requirements through the stress test, which lowers the closing CET1 ratio in the stressed period.
Get in touch
We support clients in a number of areas in relation to their stress testing programmes, by:
- Conducting in-depth benchmarking analysis
- Enhancing modelling capability
- Developing action plans
- Providing unique insights and tailored research
- Supporting the production of roadmaps for future exercises,
- Designing and implementing tailored automation solutions
For further information, or if you have any questions on our report above, please get in touch with Ian or Adrian of our Banking team. We'd be delighted to hear from you.
Ian Nelson
Partner, Head of Financial Services & Regulatory
KPMG in Ireland
Adrian Toner
Managing Director
KPMG in Ireland
Read more in Banking
4 Results
Nothing found

