
Already dealing with huge challenges, airlines face a mammoth task to achieve their net zero targets and are in urgent need of solutions. The current discourse mostly focuses on reducing in-flight CO2 emissions through Sustainable Aviation Fuels, alongside emerging electric and hydrogen technologies, but these solutions may take decades to scale effectively.
Reducing contrails, which account for a significant proportion of the sector’s total radiative forcing impact, offers a far more immediate upside opportunity. In this paper we draw on fresh research to quantify and understand that opportunity in the context of ongoing industry initiatives.

Data provided by:

Contrails: the challenge and the opportunity
The mechanism by which contrails can exacerbate global warming has been understood since the 1990s, when NASA’s Patrick Minnis first highlighted their radiative forcing effects. Under certain atmospheric conditions, they persist as cirrus clouds, which cause cooling when they reflect incoming sunlight back into space, and warming when they trap heat radiating from the earth’s surface.
While the cooling effect of contrails is thus limited to daylight hours, their warming effect persists around the clock. Consequently, without proper management, their net impact is to contribute to temperature rises.
Recent scientific advancements have deepened our understanding of this impact, though estimates of its size remain variable. Crucially, individual flights experience varying degrees of contrail impact according to different operational characteristics, such as:
- Geographic location: different regions exhibit distinct weather patterns, influencing contrail formation.
- Aircraft and engine specs: different types of aircraft and engines in use affect flight altitudes and emit varying levels of soot, a key factor in ice nucleation and contrail formation.
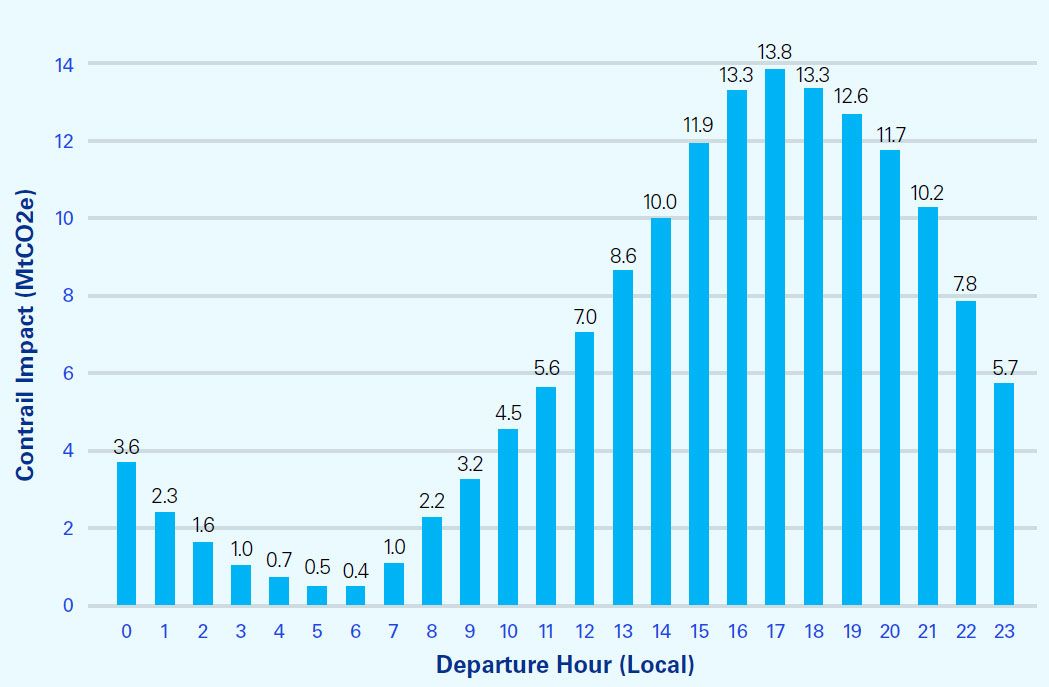
- Flight timing: flights departing in the afternoon tend to contribute to a higher contrail impact, as the contrails formed during this period often persist into the night.
- Weather: humidity, temperature, and atmospheric pressure all impact contrail formation, with contrails more likely to form in colder temperatures and higher humidity.
Contrail impact by arrival and departure region
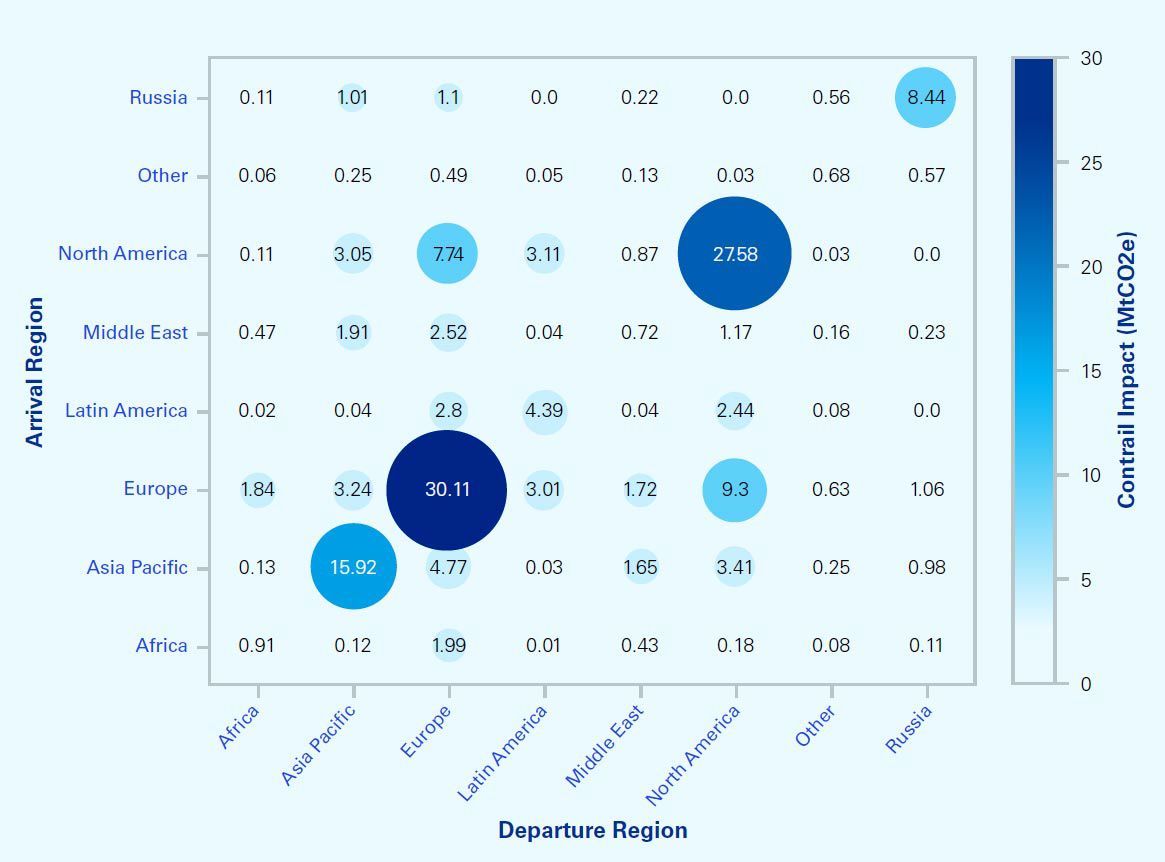
Most contrail impact is generated by flights to and from Europe and North America, where larger volumes of commercial air traffic frequently intersect with conducive atmospheric conditions for contrail formation. Other regions with high traffic, such as Asia Pacific, observe lower contrail impact, largely because of less contrail-prone cruise altitudes, as well as weather phenomena such as the Hadley Circulation.
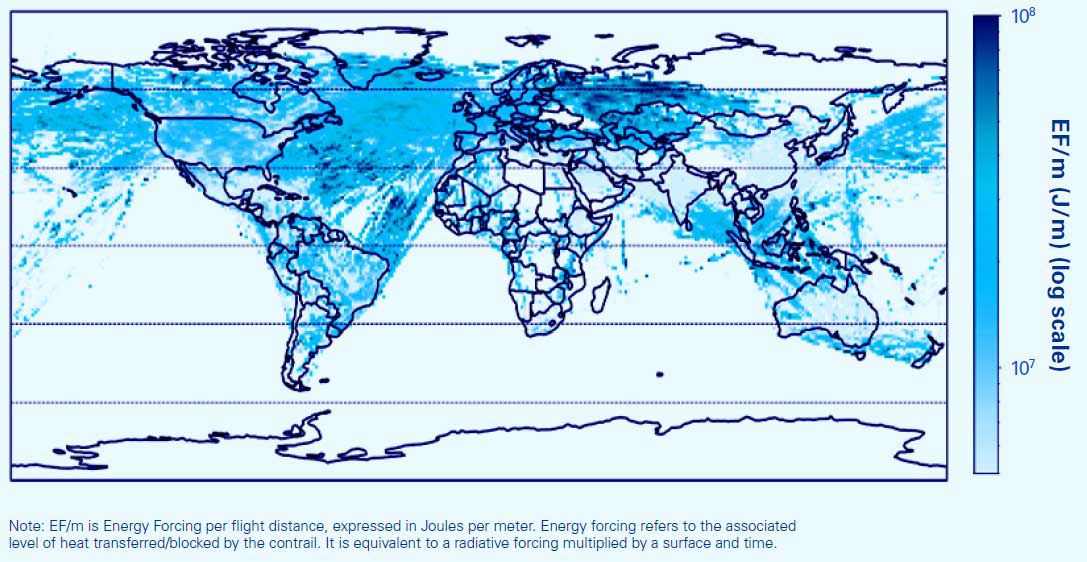
2023 contrail energy forcing per distance flown
Contrail impact by departure hour
The Contrail Opportunity Index
Climate data platform Estuaire has recently conducted an analysis of 34,388,000 commercial aviation flights to estimate both the CO2 emissions and additional radiative forcing from contrails.
This analysis adopted a detailed flight-by-flight consideration of actual aircraft trajectories, using a dataset that includes all flights operated by commercial passenger and cargo aircraft in 2023.
This approach computes the climate impact of each flight, encompassing not just CO2 emissions, but other factors like contrail radiative forcing, allowing us to build a more granular picture of contrail impacts at the individual airline level.*
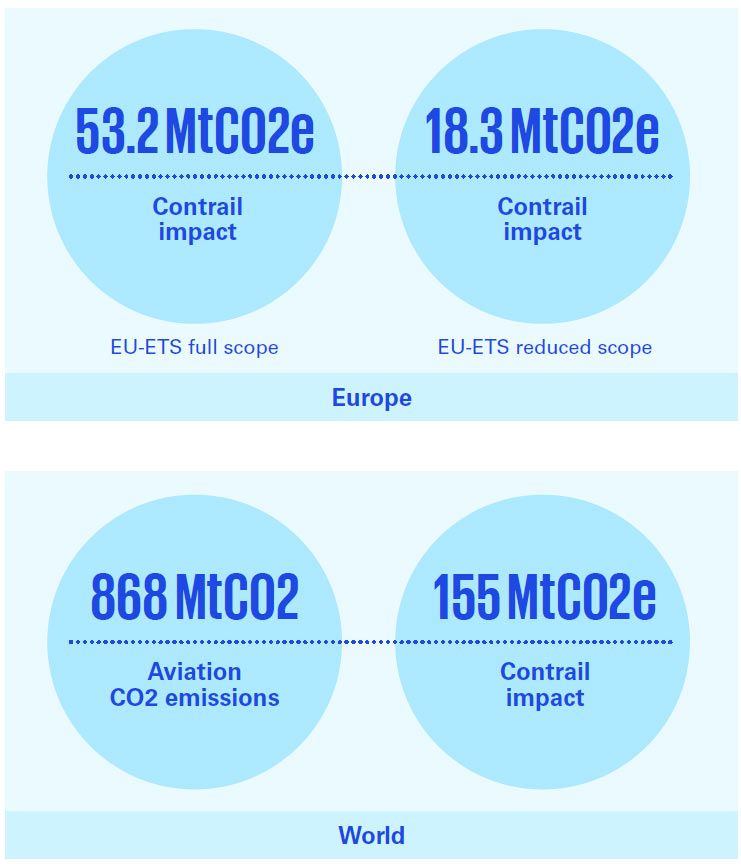
The likes of the EU and Intergovernmental Panel on Climate Change have placed the contrail effect at up to 60% of aviation’s effective radiative forcing.1,2 With the assumptions around CO2 equivalent calculations still a matter for debate among scientists, Estuaire have adopted conservative CO2 equivalent conversion assumptions for the purpose of this analysis, which suggests that contrails contribute a warming equivalent to 18% over and above the direct CO2 emissions caused by flights.
The size of the prize
These figures are highly relevant in the context of the EU’s imminent plans to introduce a new Monitoring, Reporting, and Verification (MRV) scheme for aviation’s non-CO2 environmental effects, including contrails. By the end of 2027, based on the results from the application of the MRV framework for non-CO2 aviation effects, the EU will work on a legislative proposal to mitigate non-CO2 aviation effects by expanding the scope of the EU ETS to include non-CO2 aviation effects.
Today, opinions differ on whether the monitoring scheme should encompass all flights that depart from or arrive in EU member states, or remain limited to intra-EU flights only, to already align with the scope of the EU Emissions Trading Scheme (ETS). In either case, the contrails impact remains large.
By isolating the contrail impact of each individual flight, we can now, for the first time, assess the implications of choosing one reporting scope over another. On an airline-by-airline basis, we also observe significant variability in contrail impact depending on the reporting scope, primarily driven by the airline's route network.
Whilst the scheme’s aim is currently to encompass all flights that depart from or arrive in EU member states, some airlines are advocating to reduce its scope to intra-EU flights only, to align with the scope of the EU Emissions Trading Scheme (ETS). In either case, the contrails impact remains large.
Crucially, however, this impact is very unevenly distributed. In fact, according to Estuaire’s analysis, in 2023 just 2.9% of flights generated 80% of the total radiative forcing effect of contrails.
This insight represents a huge opportunity: for most airlines, substantial climate savings can be realised with minimal fuel penalties by rerouting only a small number of flights. Estuaire’s analysis makes this clearer at the airline level, where those airlines with the highest concentrations of contrail impact can be ranked accordingly.
In the following table, we have redacted this initial ranking, but for sector transparency seek to open this up in collaboration with airlines over time.
| Opportunity Ranking | Concentration (Percentage of flights generating 80% of the airline contrail impact) | Airline | #Flights | Tailpipe CO2 (Mtons) | Contrail CO2e (Mtons) | Contrail Impact as % of total |
|---|---|---|---|---|---|---|
| 1 | 0.59% | North American Regional airline | 62013 | 0.23 | 0.03 | 11% |
| 2 | 1.27% | North American Regional airline | 56636 | 0.46 | 0.06 | 11% |
| 3 | 1.32% | South American airline | 245582 | 2.81 | 0.36 | 11% |
| 4 | 1.39% | Asia-Pacific legacy airline | 170539 | 2.97 | 0.36 | 11% |
| 5 | 1.79% | North American legacy airline | 84212 | 2.54 | 0.67 | 21% |
| 6 | 1.98% | North American charter airline | 33963 | 0.17 | 0.02 | 10% |
| 7 | 2.13% | North American cargo airline | 18272 | 0.24 | 0.03 | 13% |
| 8 | 2.24% | Asia-Pacific low-cost airline | 112318 | 2.60 | 0.45 | 15% |
| 9 | 2.47% | European legacy airline | 112901 | 2.31 | 0.51 | 18% |
| 10 | 2.58% | South American airline | 240749 | 4.67 | 0.61 | 11% |
| 11 | 2.75% | Asia-Pacific legacy airline | 260228 | 9.27 | 1.56 | 14% |
| 12 | 2.80% | Asia-Pacific legacy airline | 131820 | 6.36 | 0.75 | 11% |
| 13 | 2.80% | European legacy airline | 117740 | 2.44 | 0.58 | 19% |
| 14 | 2.81% | South American low-cost airline | 138296 | 1.99 | 0.55 | 22% |
| 15 | 2.85% | North American legacy airline | 1162575 | 31.24 | 5.26 | 14% |
| 16 | 2.89% | South American legacy airline | 178788 | 3.35 | 0.70 | 17% |
| 17 | 2.99% | North American low-cost airline | 1475228 | 19.83 | 2.36 | 11% |
| 18 | 3.08% | South American low-cost airline | 225992 | 2.92 | 0.45 | 13% |
| 19 | 3.20% | Asia-Pacific legacy airline | 61160 | 1.80 | 0.29 | 14% |
| 20 | 3.34% | African legacy airline | 64356 | 2.38 | 0.36 | 13% |
Source : Estuaire data, airlines selected have more than 50 aircraft in fleet and a Contrail Impact as % of total greater than 10%.
Actions to take now
As the aviation sector grapples with fuel efficiency, Sustainable Aviation Fuels, and other levers for reducing its environmental impact over the long term, contrail mitigation offers a realistic means of doing so in the current decade and demonstrating much-needed progress.
By adopting advanced contrail mitigation technologies, airlines can make a material impact on reducing their environmental footprint. To conclude, we list some specific actions by stakeholder type:
Airlines
- Contrail mitigation technologies represent the best opportunity for airlines to reduce their environmental footprint in the short term, and may enable additional revenue generation opportunities from tradable carbon equivalent credits.
- Around 3% of flights generate ~80% of the overall contrail radiative forcing effect, allowing for major environmental impact reductions whilst keeping fuel penalties and disruption to existing operations to a minimum.
- Adjusting flight schedules, particularly to avoid afternoon departures that lead to contrails persisting into the night, can reduce contrail impact significantly. Given the obvious challenges involved with making such schedule changes, airlines should focus on other ways to actively manage these flights for mitigation.
- Partnering with contrail and emissions monitoring companies enables airlines to gain full visibility of their unique contrail impact on a flight-by-flight basis, allowing for a strategic approach to impact reduction and monitoring.
- Engaging with airports and fuel providers to target Sustainable Aviation Fuel allocation at contrail-prone flights can leverage cleaner combustion exhaust particles to lower contrail lifetimes and impact.
- Engaging with policymakers now will allow airlines to shape the regulatory approach to contrail reduction and its treatment as part of industry emissions-reduction strategy (e.g. the EU’s Emissions Trading Scheme).
Air Navigation Service Providers (ANSPs) and regulators
- ANSPs are perfectly positioned to develop and implement contrail avoidance protocols, and should seize this opportunity to lead on a crucial element of the sector’s impact reduction strategy by engaging with airlines today to implement and refine mitigation strategies.
- Trials in Europe and the US have already proven the ability of air traffic controllers to mitigate contrail formation through real-time altitude adjustments. Upgraded meteorological forecasting and measurement tools can enhance ANSPs’ utility in this sphere yet further.
- Expedite monitoring, reporting, and verification (MRV) schemes for non-CO2 environmental effects, including contrails, alongside clear guidelines and support for airlines.
- Promote transparency in contrail impact data by encouraging airlines to share their findings and best practices, and fostering a collaborative and open approach to contrail measurement and mitigation.
Policymakers
- Promote sector-wide understanding of and engagement with contrail formation and mitigation, through agenda-setting events and content, as well as by funding the research still required to better understand contrail formation and mitigation pathways.
- Urgently include non-CO2 warming effects in aviation climate policy and emissions reduction frameworks, including impact reporting under national inventories/emissions trading schemes.
- Consider incentives for airlines to adopt contrail management as standard operating procedure (e.g. phased introduction of differentiated and dynamic airspace pricing).
- Consider territory-wide contrail mitigation potential through the integration of mitigation techniques in your airspace, likely in collaboration with your national ANSP or regulator.
- Collaborate with international bodies to harmonise global contrail mitigation efforts, including additional sensors to build up a more comprehensive, real-time data lake of relevant atmospheric conditions.
- Fund research into the long-term potential for net cooling through deliberate contrail management.
Get in touch
The Contrail Opportunity Index is a dynamic tool, which we will be updating and republishing at regular intervals.
Any airlines wishing to understand their full position in the Index, or other stakeholders wishing to explore the Index, should contact Chris Brown of our Aviation team.
We'd be delighted to hear from you.

Christopher Brown
Partner, Head of Strategy
KPMG in Ireland

Disclaimer on methodology & limitations
- Aircraft Engine Performance: Current data on lean-burn engines may be underestimated, but ongoing flight trials aim to improve model accuracy. As a result, global contrail energy forcing values are expected to increase with future model improvements.
- ADS-B Coverage: ADS-B tracking can be incomplete in some regions. In our analysis, around 80% of flights were fully tracked and analyzed. For incomplete flights, we assigned average emission and contrail impact values based on available data for each tail-number.
- Model Uncertainties: CoCiP is a model-based approach coming with uncertainties. We foresee the future of contrail management involving various data sources: satellite imagery, Numerical Weather Prediction, flight deck observations, ground and aircraft sensors.
- Climate Metric Choice: The selection of climate metrics significantly affects environmental impact assessments. Other climate metrics, efficacies and time horizons are not analyzed here (e.g. ATR, GTP over 20, 50, 100 years) and might result in different CO2 equivalent values for contrail impact. Here we use a GWP100 with an efficacy factor of 0.42 (source Lee & al), as recommended by Megill & al.