The Infrastructure Guidelines recently updated the parameters to be used for the Shadow Price of Carbon across appraisal. This post explores what the Shadow Price of Carbon is, what are the changes that have been implemented and what impact this could have on decision making.
What is the shadow price of carbon?
The past five years have seen a significant shift in our understanding of the environmental damage caused by carbon emissions, the need to reduce emissions and society’s perspective on the importance of climate change. A recent study by the Environmental Protection Agency (EPA) found that 89% of people in Ireland view climate change as important to them personally, with 79% stating it should be a priority for the Government.[1] Government investment decisions and policy making needs to accurately account for the future cost of emissions and the future value of avoiding emissions.
The Shadow Price of Carbon is used to put a monetary value on the impact of a change in carbon emissions when carrying out economic analysis. It captures the cost to society that arises from carbon emissions and is used in calculations to monetise the benefit of reducing carbon emissions, or an equivalent in other emissions. The price applied reflects the cost of removing emissions from the atmosphere.
Capturing the environmental impact of investment is an important step in economic analysis. Reductions in carbon emissions have positive externalities on society by generating benefits for both investors and the wider world. In completely free markets, the value of carbon emissions reductions is undervalued as the external benefit is not accounted for. Governments can use monetised estimates based on the Shadow Price of Carbon to include carbon-related costs in public policy decision making.
How have the values changed?
The March 2024 release of the Infrastructure Guidelines Supplementary Guidance on Measuring & Valuing Changes in Greenhouse Gas Emissions in Economic Appraisal[2] has updated the Shadow Price of Carbon Values to align with an increase in national ambitions on committing to a reduction in emissions and the targets set out in the Climate Action and Low Carbon Development (Amendment) Act 2021. The values account for a basket of emissions, meaning a monetised value can also be placed on other emissions[3]. The previous values in the Public Spending Code were released in 2019[4]. In the updated values, there is no longer a distinction between the value of Emissions Trading System (ETS)[5] traded and non-ETS traded sectors – all carbon emissions should be treated equally.

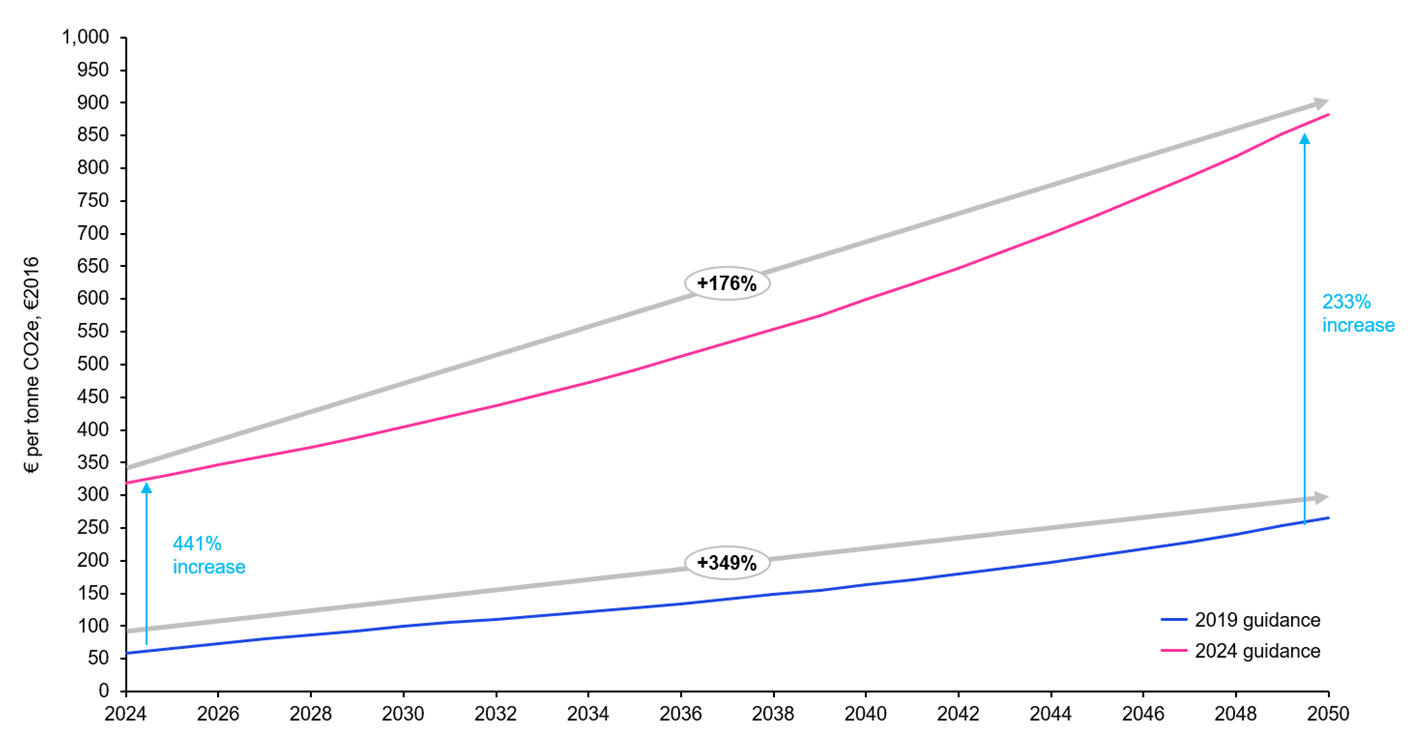
As can be seen, the parameters[6] for use across analysis have increased from €59 per tonne of CO2 in 2024 in the 2019 release to €319 in the updated version. This is an increase of 441% between the previous guidance and the current parameters. The 2019 values had set a value of €265 by 2050, which has been updated to €882 as of March 2024 (+233%). All values in the updated 2024 release are higher than the 2019 parameters. However, in the 2024 release, the growth in values between 2024 and 2050 is now relatively smaller, compared to the previous guidance (increasing by 176% over the time period compared to 349% previously).
How does the update change analysis?
As an example of the difference the updated carbon values could make to investment decisions, business case development or policy implementation, consider a project that involves investment in a segregated cycle lane, aiming to reduce car dependency in busy urban areas. In the worked example below, updating the Shadow Price of Carbon to the March 2024 release increases the Benefit Cost Ratio (BCR)[1] from 1.77 to 2.25 (+27%).
The worked example gives estimates for the capital and operating costs of the project, as well as travel time savings, journey quality, environment, health and safety benefits. The example segregated cycle lane is expected to deliver a reduction of 125,000 tonnes of carbon across the appraisal period due to people replacing car journeys with cycling trips as they feel safer using the segregated bike lane. The table below shows how the BCR for the sample project would increase by 27%, simply by using the updated 2024 values for the Shadow Price of Carbon. The proportional change in NPV is even greater (+62%).
Table 1: Worked Example
Monetised Costs and Benefits | 2019 values, €m | 2024 values, €m | % Change |
|---|---|---|---|
Travel time | 40.0 | 40.0 |
|
Journey quality | 20.0 | 20.0 |
|
Environmental benefits | 10.3 | 39.1 | 278% |
Health | 6.0 | 6.0 |
|
Safety | 30.0 | 30.0 |
|
Total benefits | 106.3 | 135.1 | 27% |
Total costs | 60.0 | 60.0 |
|
BCR | 1.77 | 2.25 | 27% |
NPV | 46.3 | 75.1 | 62% |
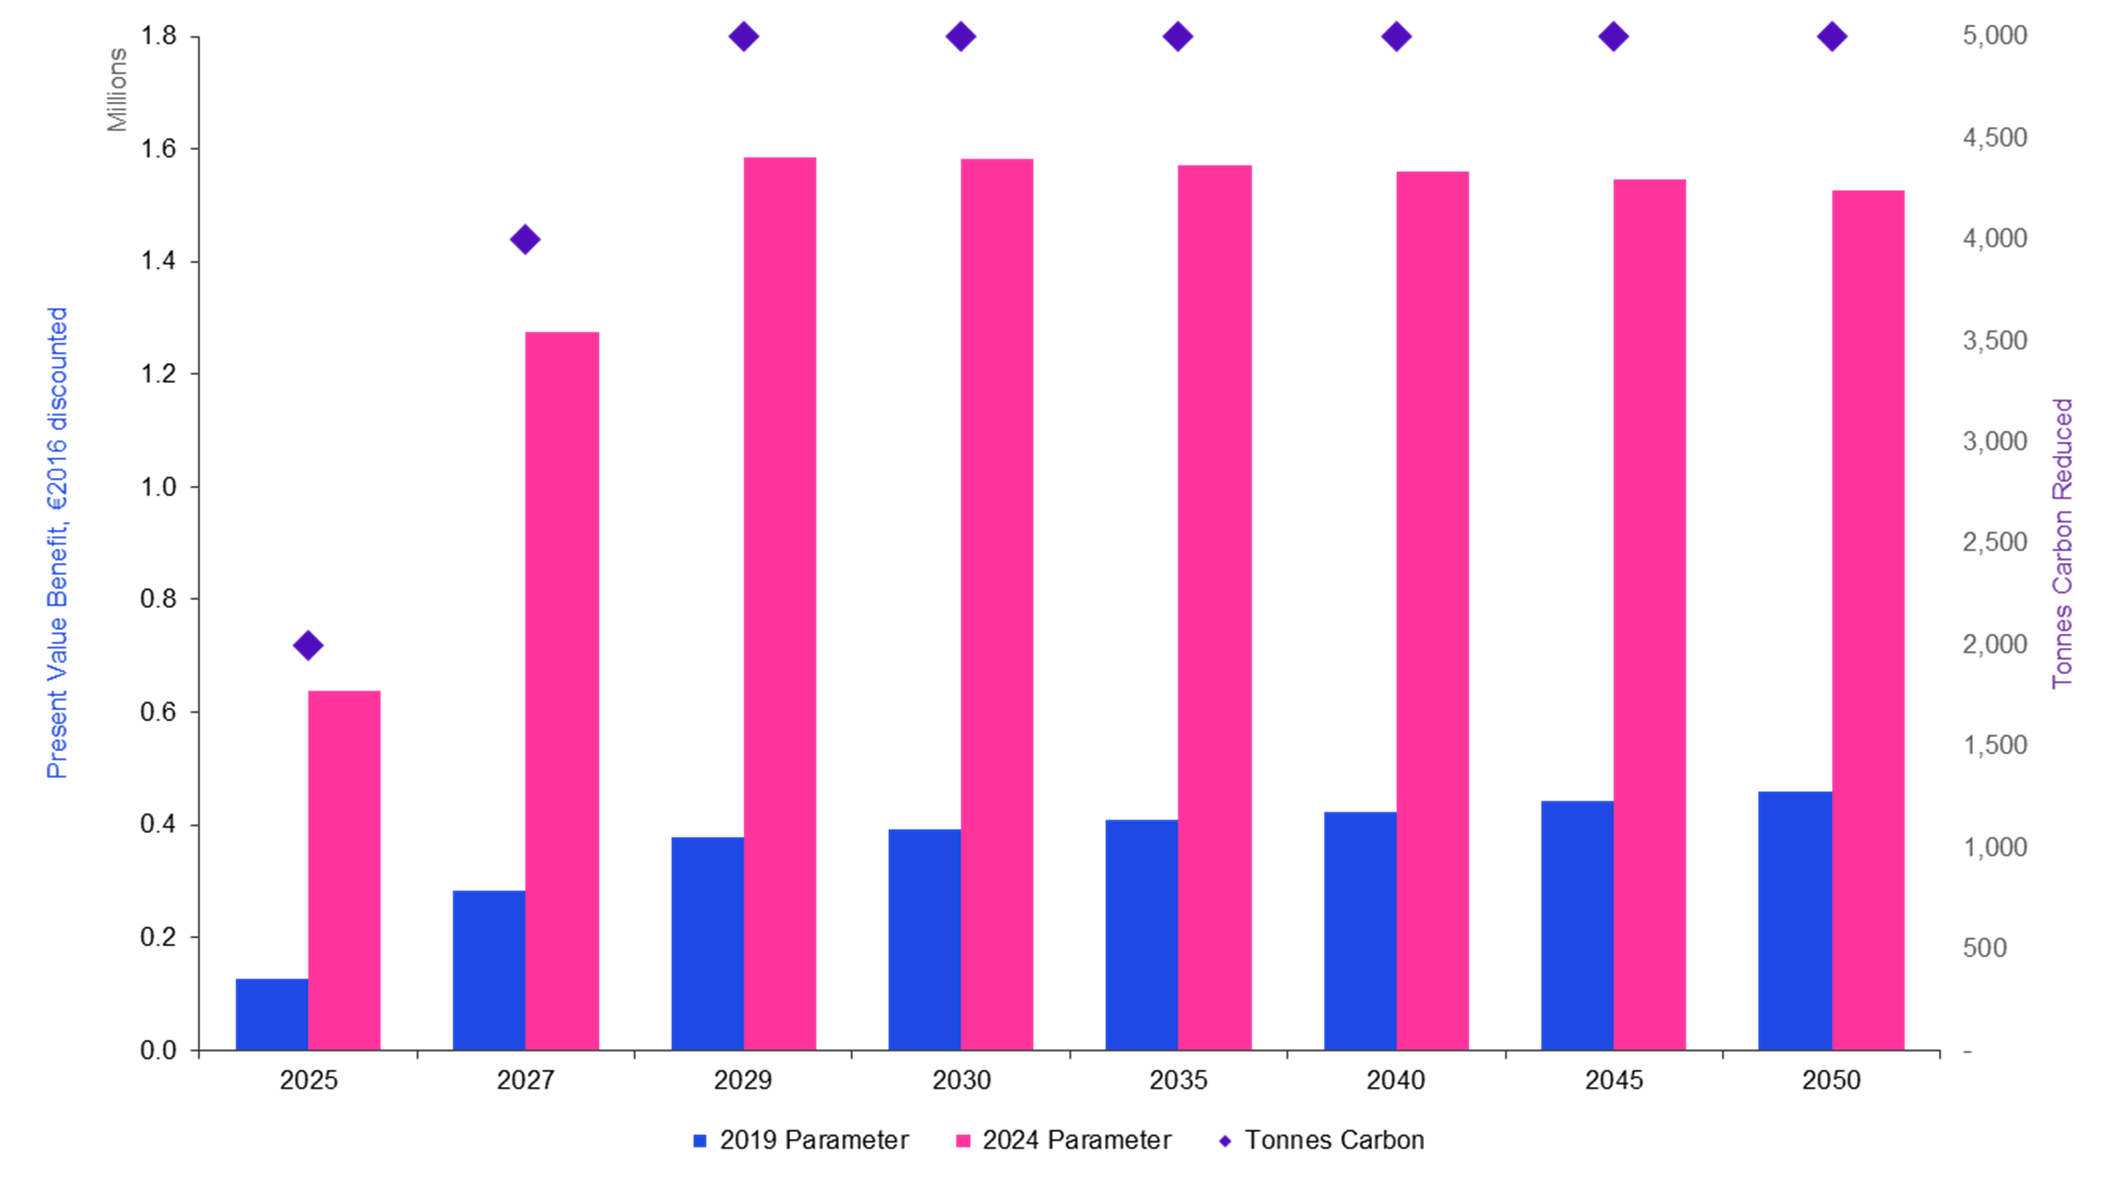
The benefit from a reduction in carbon emissions can be estimated for each year by multiplying the number of tonnes of carbon emissions avoided in that year by the appropriate Shadow Price of Carbon Value and discount rate. Using the 2019 parameters, this equates to an economic benefit of €10.3 million. Using the updated parameters for Shadow Price of Carbon, this benefit increases by 278% to €39.1 million. The chart below shows how the estimated values differ using the 2019 and updated 2024 parameters.
 Figure 2: Annual Monetised Benefit Comparison
What does this mean for policy making?
The updated Shadow Price of Carbon values released in March 2024 reflect the increasing importance placed by Government and society on accounting for emissions as part of investment decision-making. Although carbon emissions had already been monetised as part of the assessment process, the 2019 values reflected the costs of removing emissions from the atmosphere at that point in time. The updated 2024 values are reflective of the increased urgency of reducing carbon emissions, the higher cost of removing emissions once in the atmosphere and therefore the greater benefit of reducing volumes of carbon emitted.
As a result of the release of the 2024 revisions, projects which reduce carbon emissions or other equivalent greenhouse gas emissions will be viewed more favourably in the public sector decision-making process, as these will be assessed as delivering better value for money compared to when using the previous parameters. These revisions will give greater justification to projects that reduce carbon emissions and support objectives that improve the environment. A project that was previously considered to not deliver value for money may now be funded on the basis that the monetised benefits outweigh – or outweigh by a greater degree – the monetised costs.
As shown in the worked example, the March 2024 revisions to the previous parameters could have large implications for value for money results. In the short term, decision makers will need to be mindful of when an appraisal has been prepared, which values the appraisal has used, and the relevance of this to overall value for money conclusions. In the long term, the updated parameters will support investment in projects which reduce carbon emissions, helping Ireland to meet its climate commitments.
- Climate Change in the Irish Mind, EPA
- Infrastructure Guidelines Supplementary Guidance, Department of Public Expenditure NDP Delivery and Reform
- The values provided are for the “carbon equivalent” price. Other emissions such as methane, nitrous oxide or hydrofluorocarbons can be converted into their carbon equivalent and monetised using the values provided.
- Public Spending Code, Department of Public Expenditure and Reform,
- The EU Emissions Trading System is a “cap-and-trade” scheme where a limit is placed on the right to emit specified pollutants over geographic areas and companies can trade emission rights within that area. More information can be found through the European Commission.
- All values quoted are in 2016 price base, in line with Transport Appraisal Framework.
- Benefit Cost Ratios are used to show the monetised benefits relative to the monetised costs of a project, in present value terms. They are calculated by diving the total benefits by the total costs. A BCR of 1 means that benefits and costs are exactly equal to each other. Above 1 the benefits will outweigh the costs, whereas below 1 the estimated costs will be greater than estimated benefits.


