
Measuring Corporate Financial Performance
Discover which countries and territories are performing among the best. Compare financial performance across sectors. Identify distressed companies. Measure your company’s financial performance against tens of thousands of public companies around the world. KPMG’s Financial Performance Index (FPI) is designed to be one of the clearest indices of corporate financial performance.
For investors, financiers, regulators and governments, the KPMG FPI seeks to provide insights into the relative strength and health of key markets and sectors. With millions of datapoints going back to 2017, these long-term trends can help you spot signs of improvement or impending distress.
Updated quarterly, this webpage allows you to interact with the data to analyze shifts, trends, and related opportunities. You’ll also find key highlights from the most recent quarter and a spotlight on fast-moving industry sectors.
Measuring Financial Performance in Indonesia
KPMG Indonesia is proud to present the first edition of the KPMG FPI publication/newsletter. KPMG FPI allows users to discover which countries and territories are performing among the best, compare financial performance across sectors, identify distressed companies, and measure your company’s financial performance against tens of thousands of public companies around the world. KPMG FPI is designed to be one of the clearest indices of corporate financial performance.
For investors, financiers, regulators and governments, the KPMG FPI seeks to provide insights into the relative strength and health of key markets and sectors. With millions of datapoints going back to 2017, our long-term trends can help you spot signs of improvement or impending distress. Our periodic publications aim to help these parties to spot these trends as early as possible.
KPMG FPI data is refreshed on a quarterly basis. For more information, visit the KPMG FPI page. This webpage allows you to interact with the data to analyze shifts, trends, and related opportunities. You will also find key highlights from the most recent quarter and a spotlight on fast-moving industry sectors.
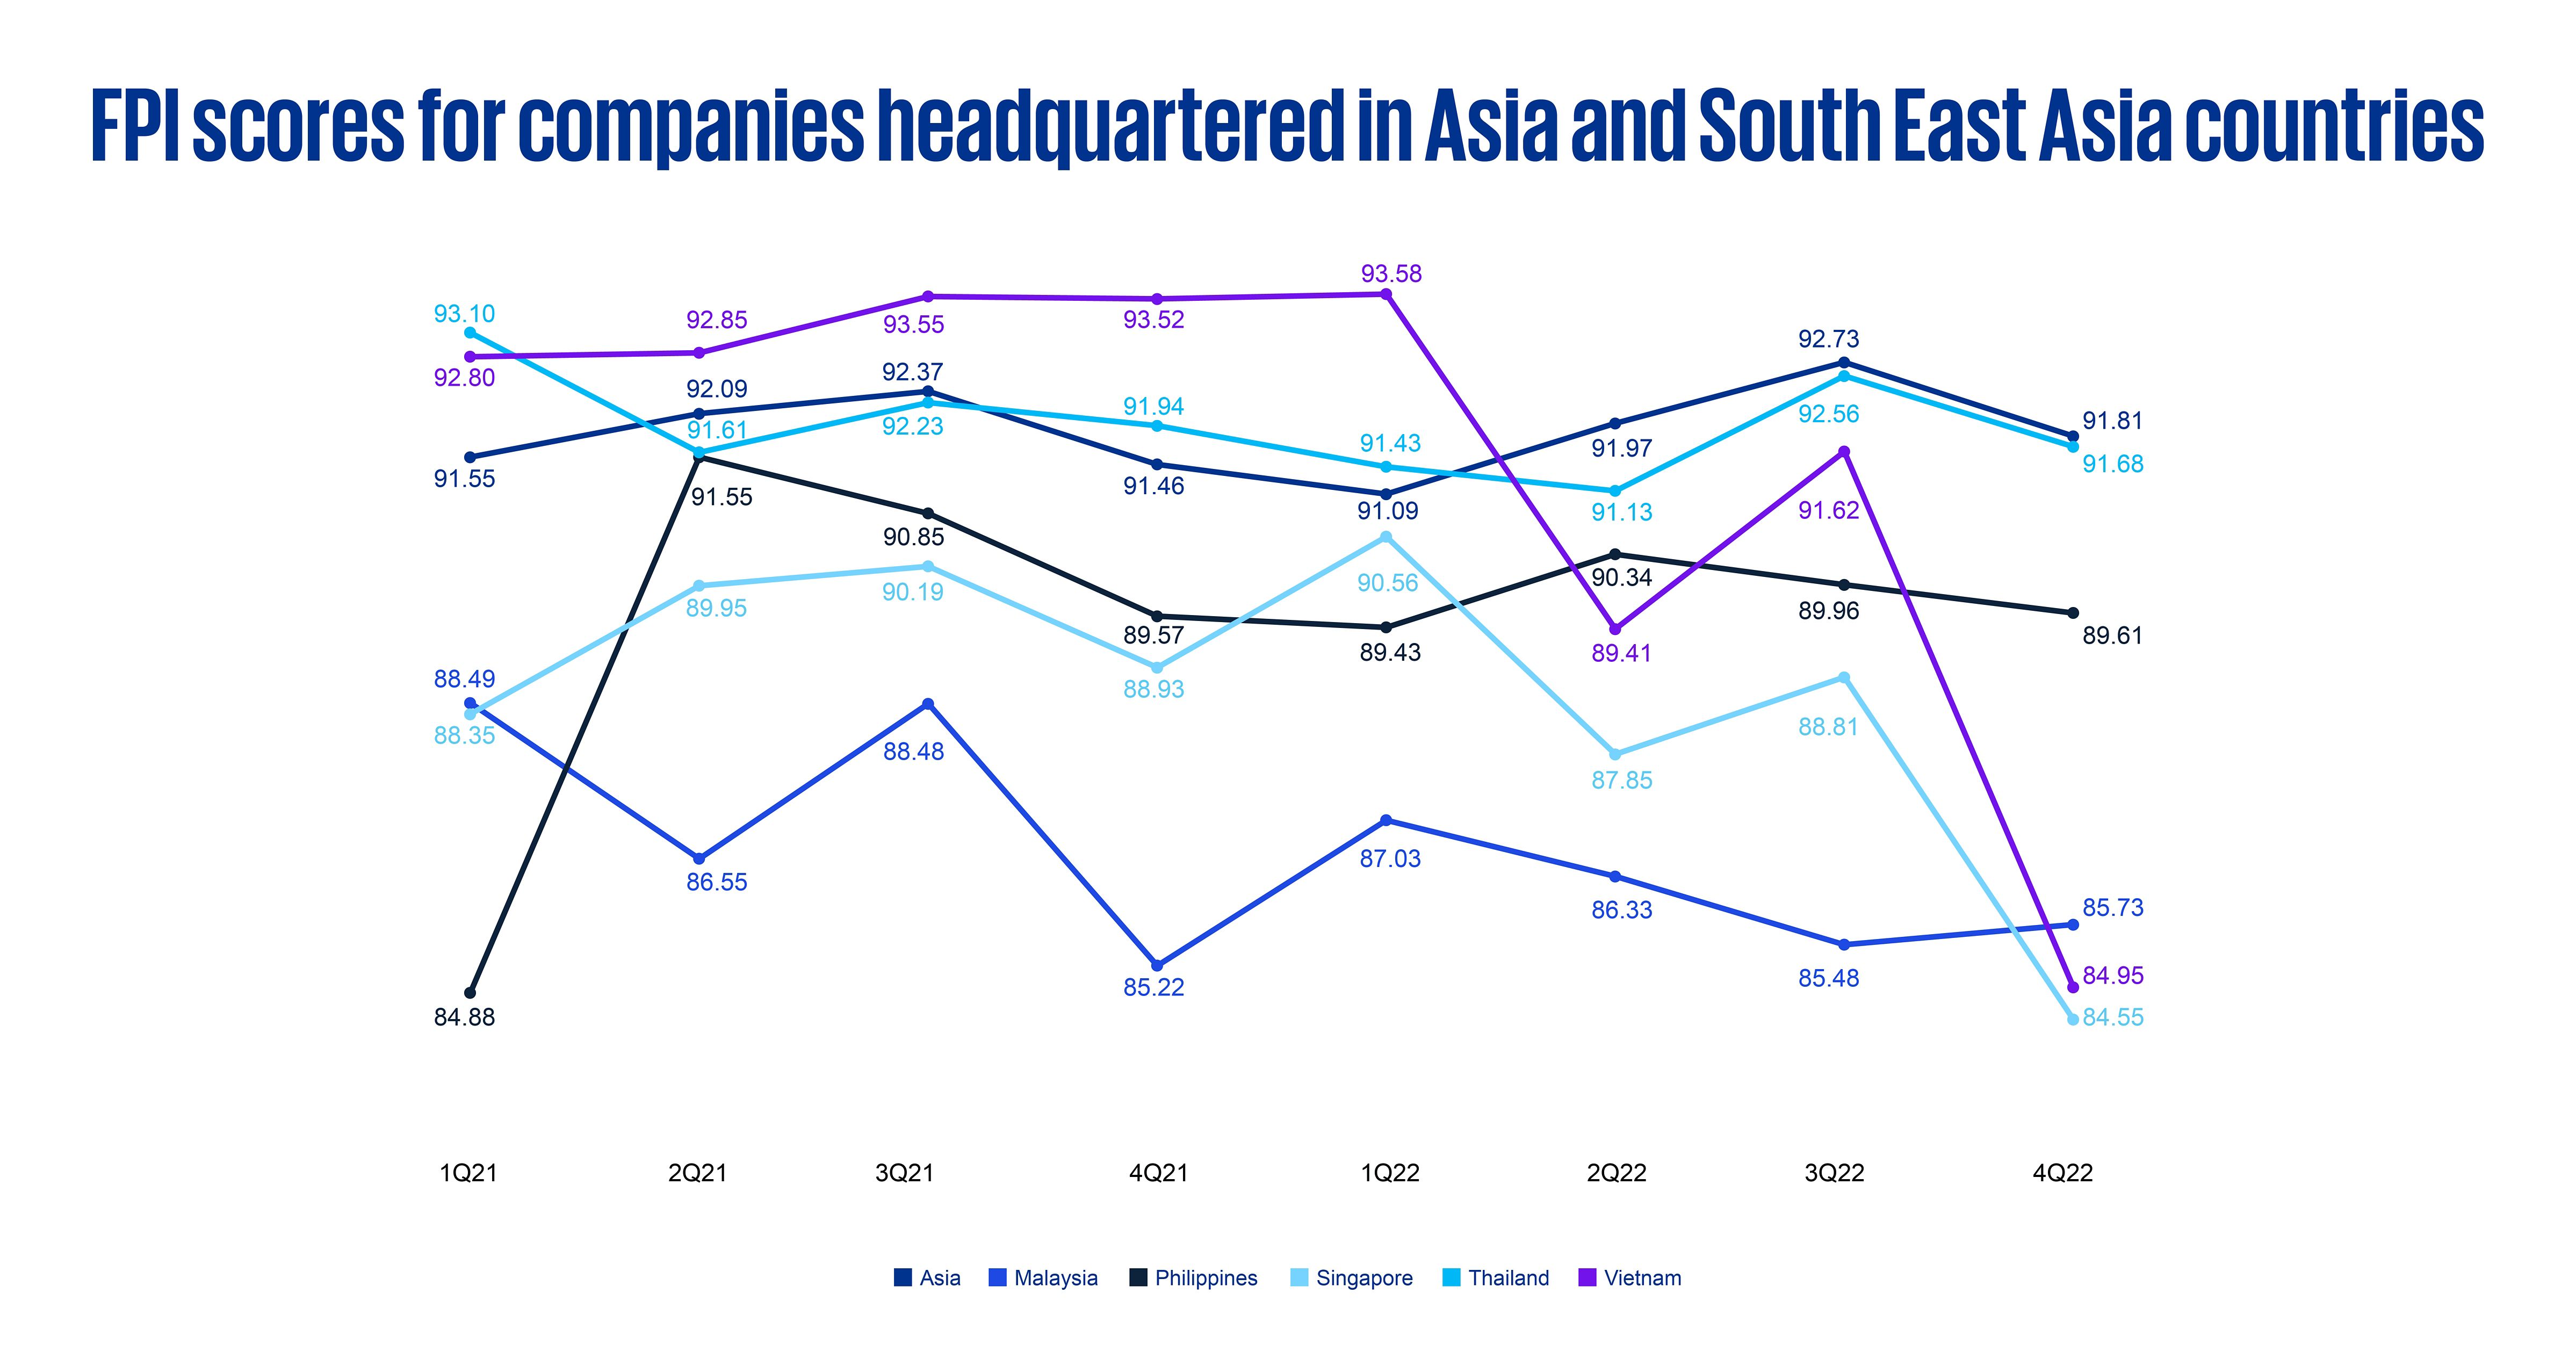
In this first edition, we will explore how Indonesia’s financial performance compares globally, in the Asia region, as well as against select Southeast Asia countries.
Indonesia has seen a steady improvement since 1Q20, when COVID initially impacted the economy, through 3Q22, when Indonesia’s FPI score reached not only its post-COVID peak, but the highest score in the time we have tracked FPI scores (going back to 1Q17). 4Q22 saw a slight decrease owing to significant weakness appearing in Textiles, Apparel & Luxury Goods, Metal & Glass Containers, and Construction & Engineering. All these sectors showed annualized decreases of over 15 percent. The only sectors to show improvement in 4Q22 were Online Retail and Technology Distributors.
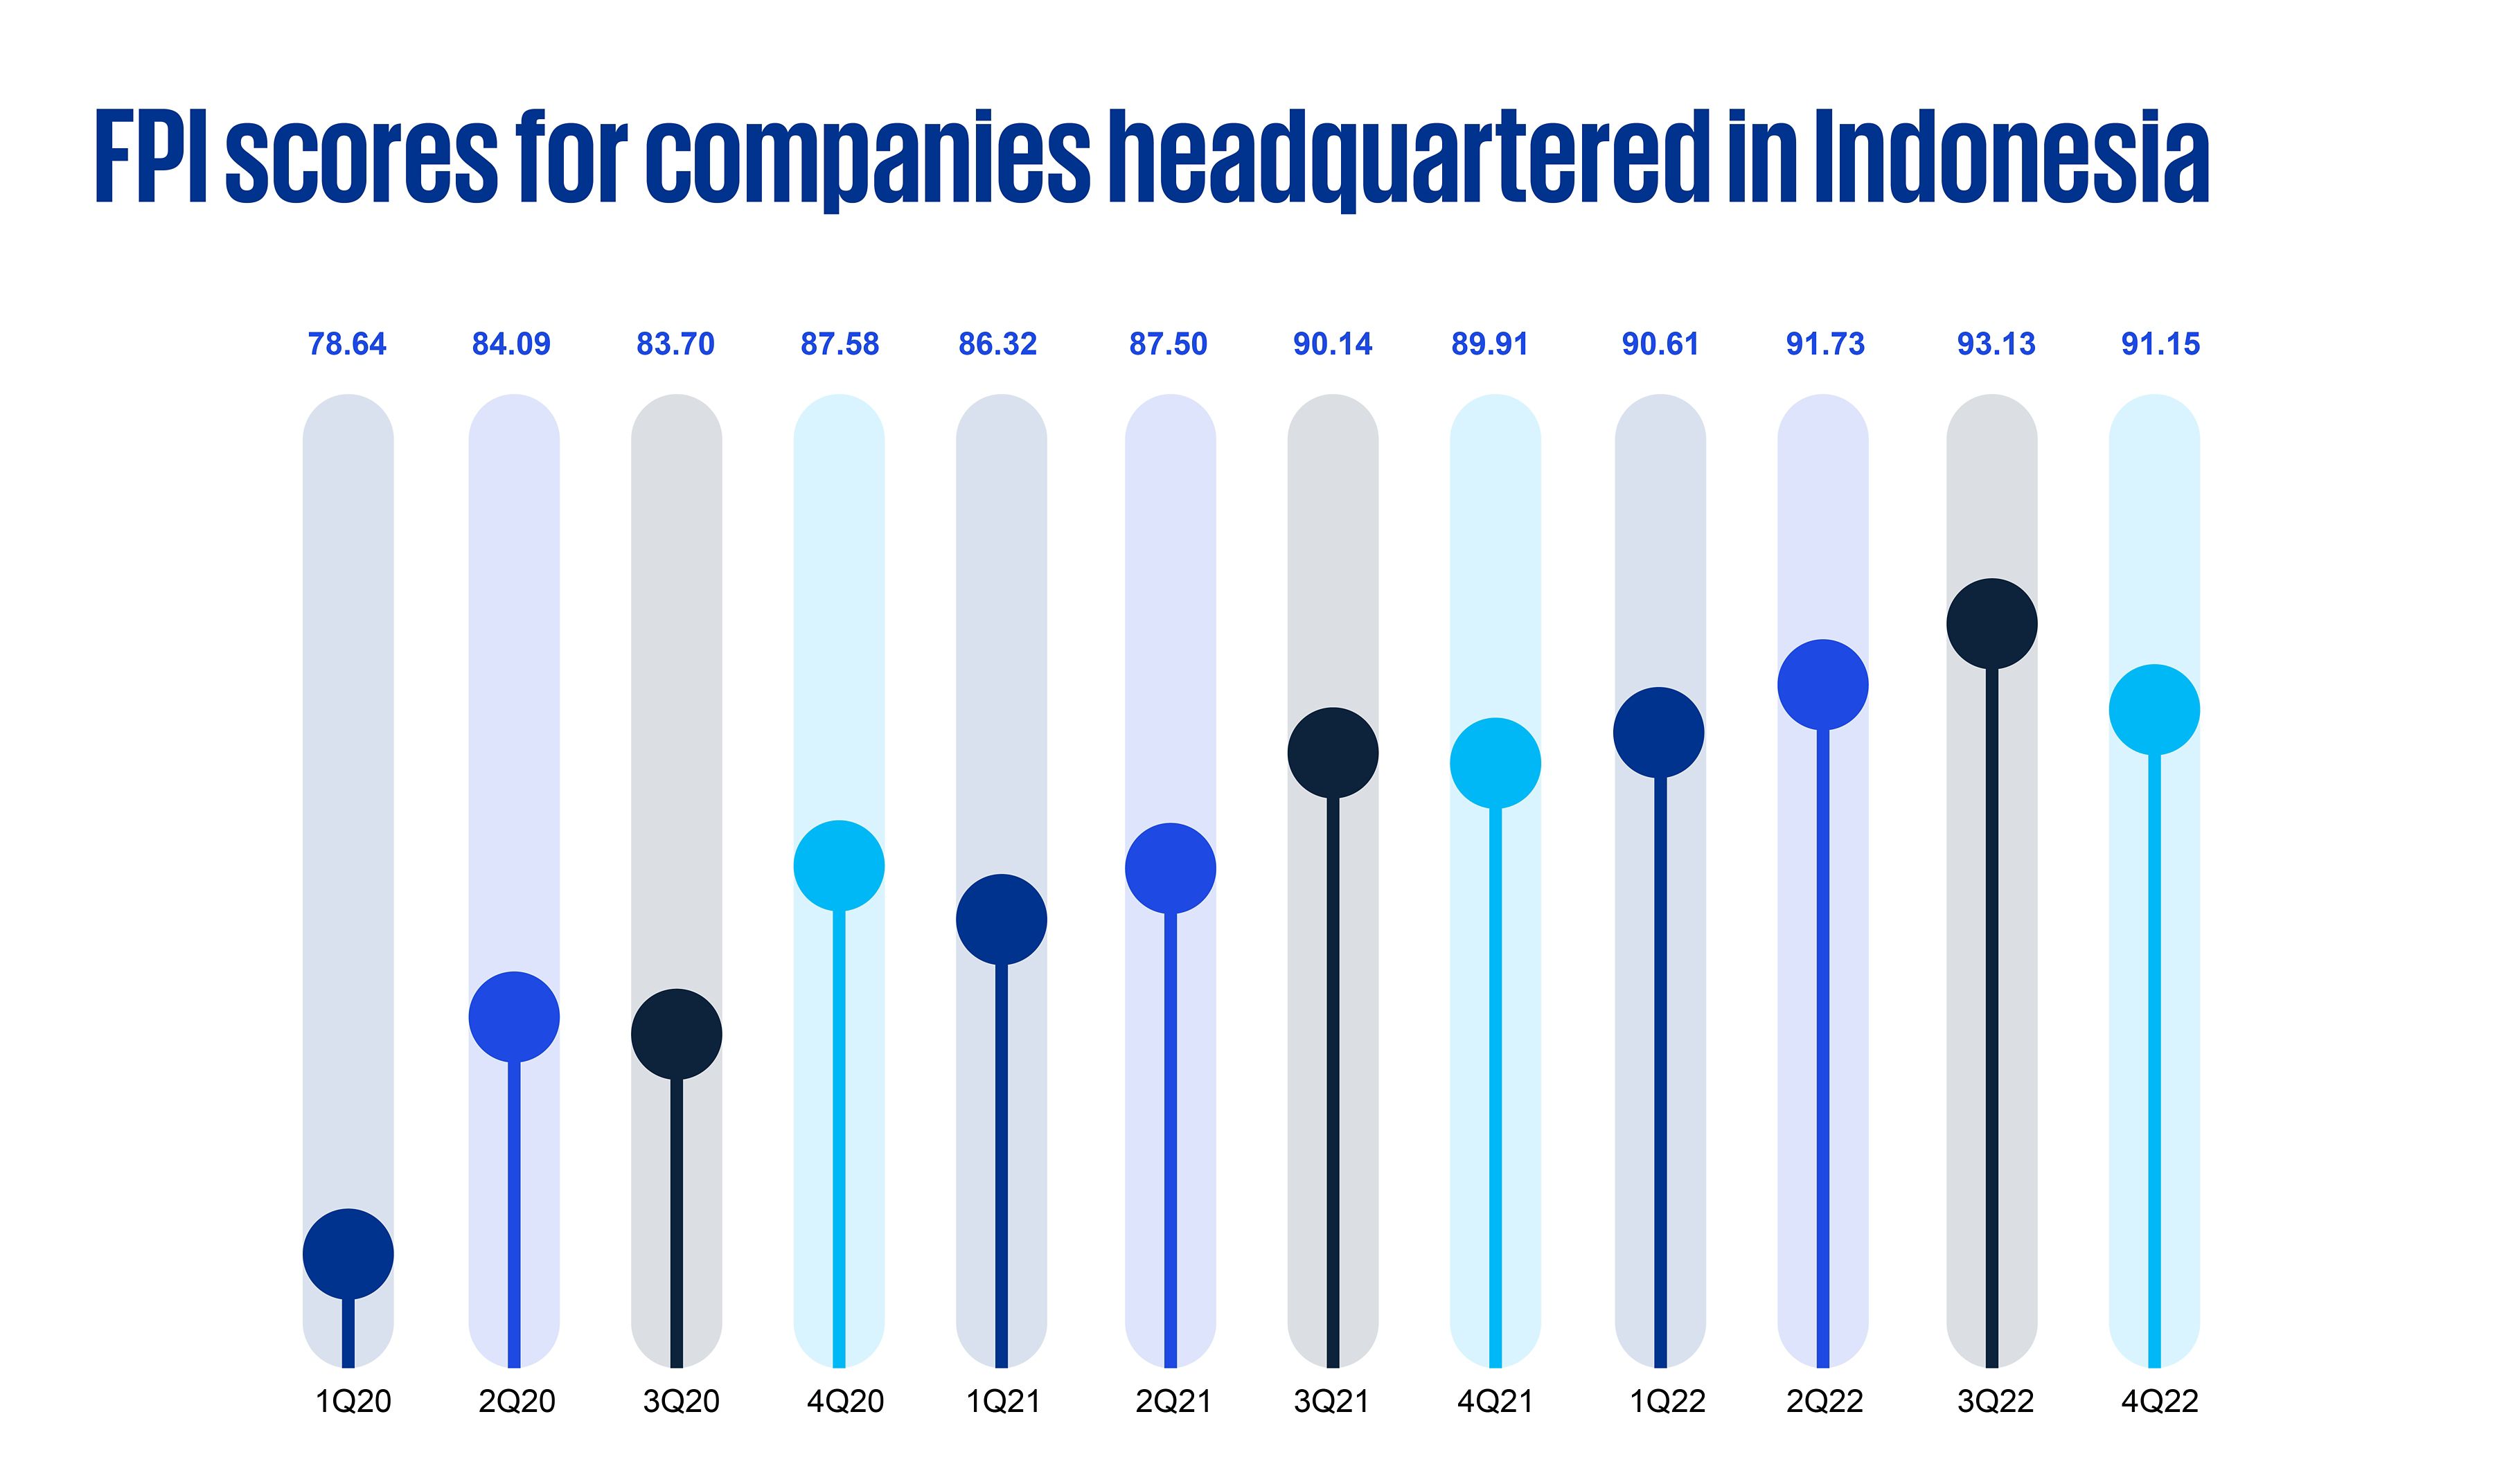
Indonesia consistently outperformed the global FPI scores in FY22, by an average of 1.6 percent per quarter. While Indonesia’s FPI score at the end of FY22 exceeded the global FPI score, it is worth noting that the decrease from 3Q22 to 4Q22 was greater in Indonesia than the globe and is a trend we will closely monitor in future quarters.
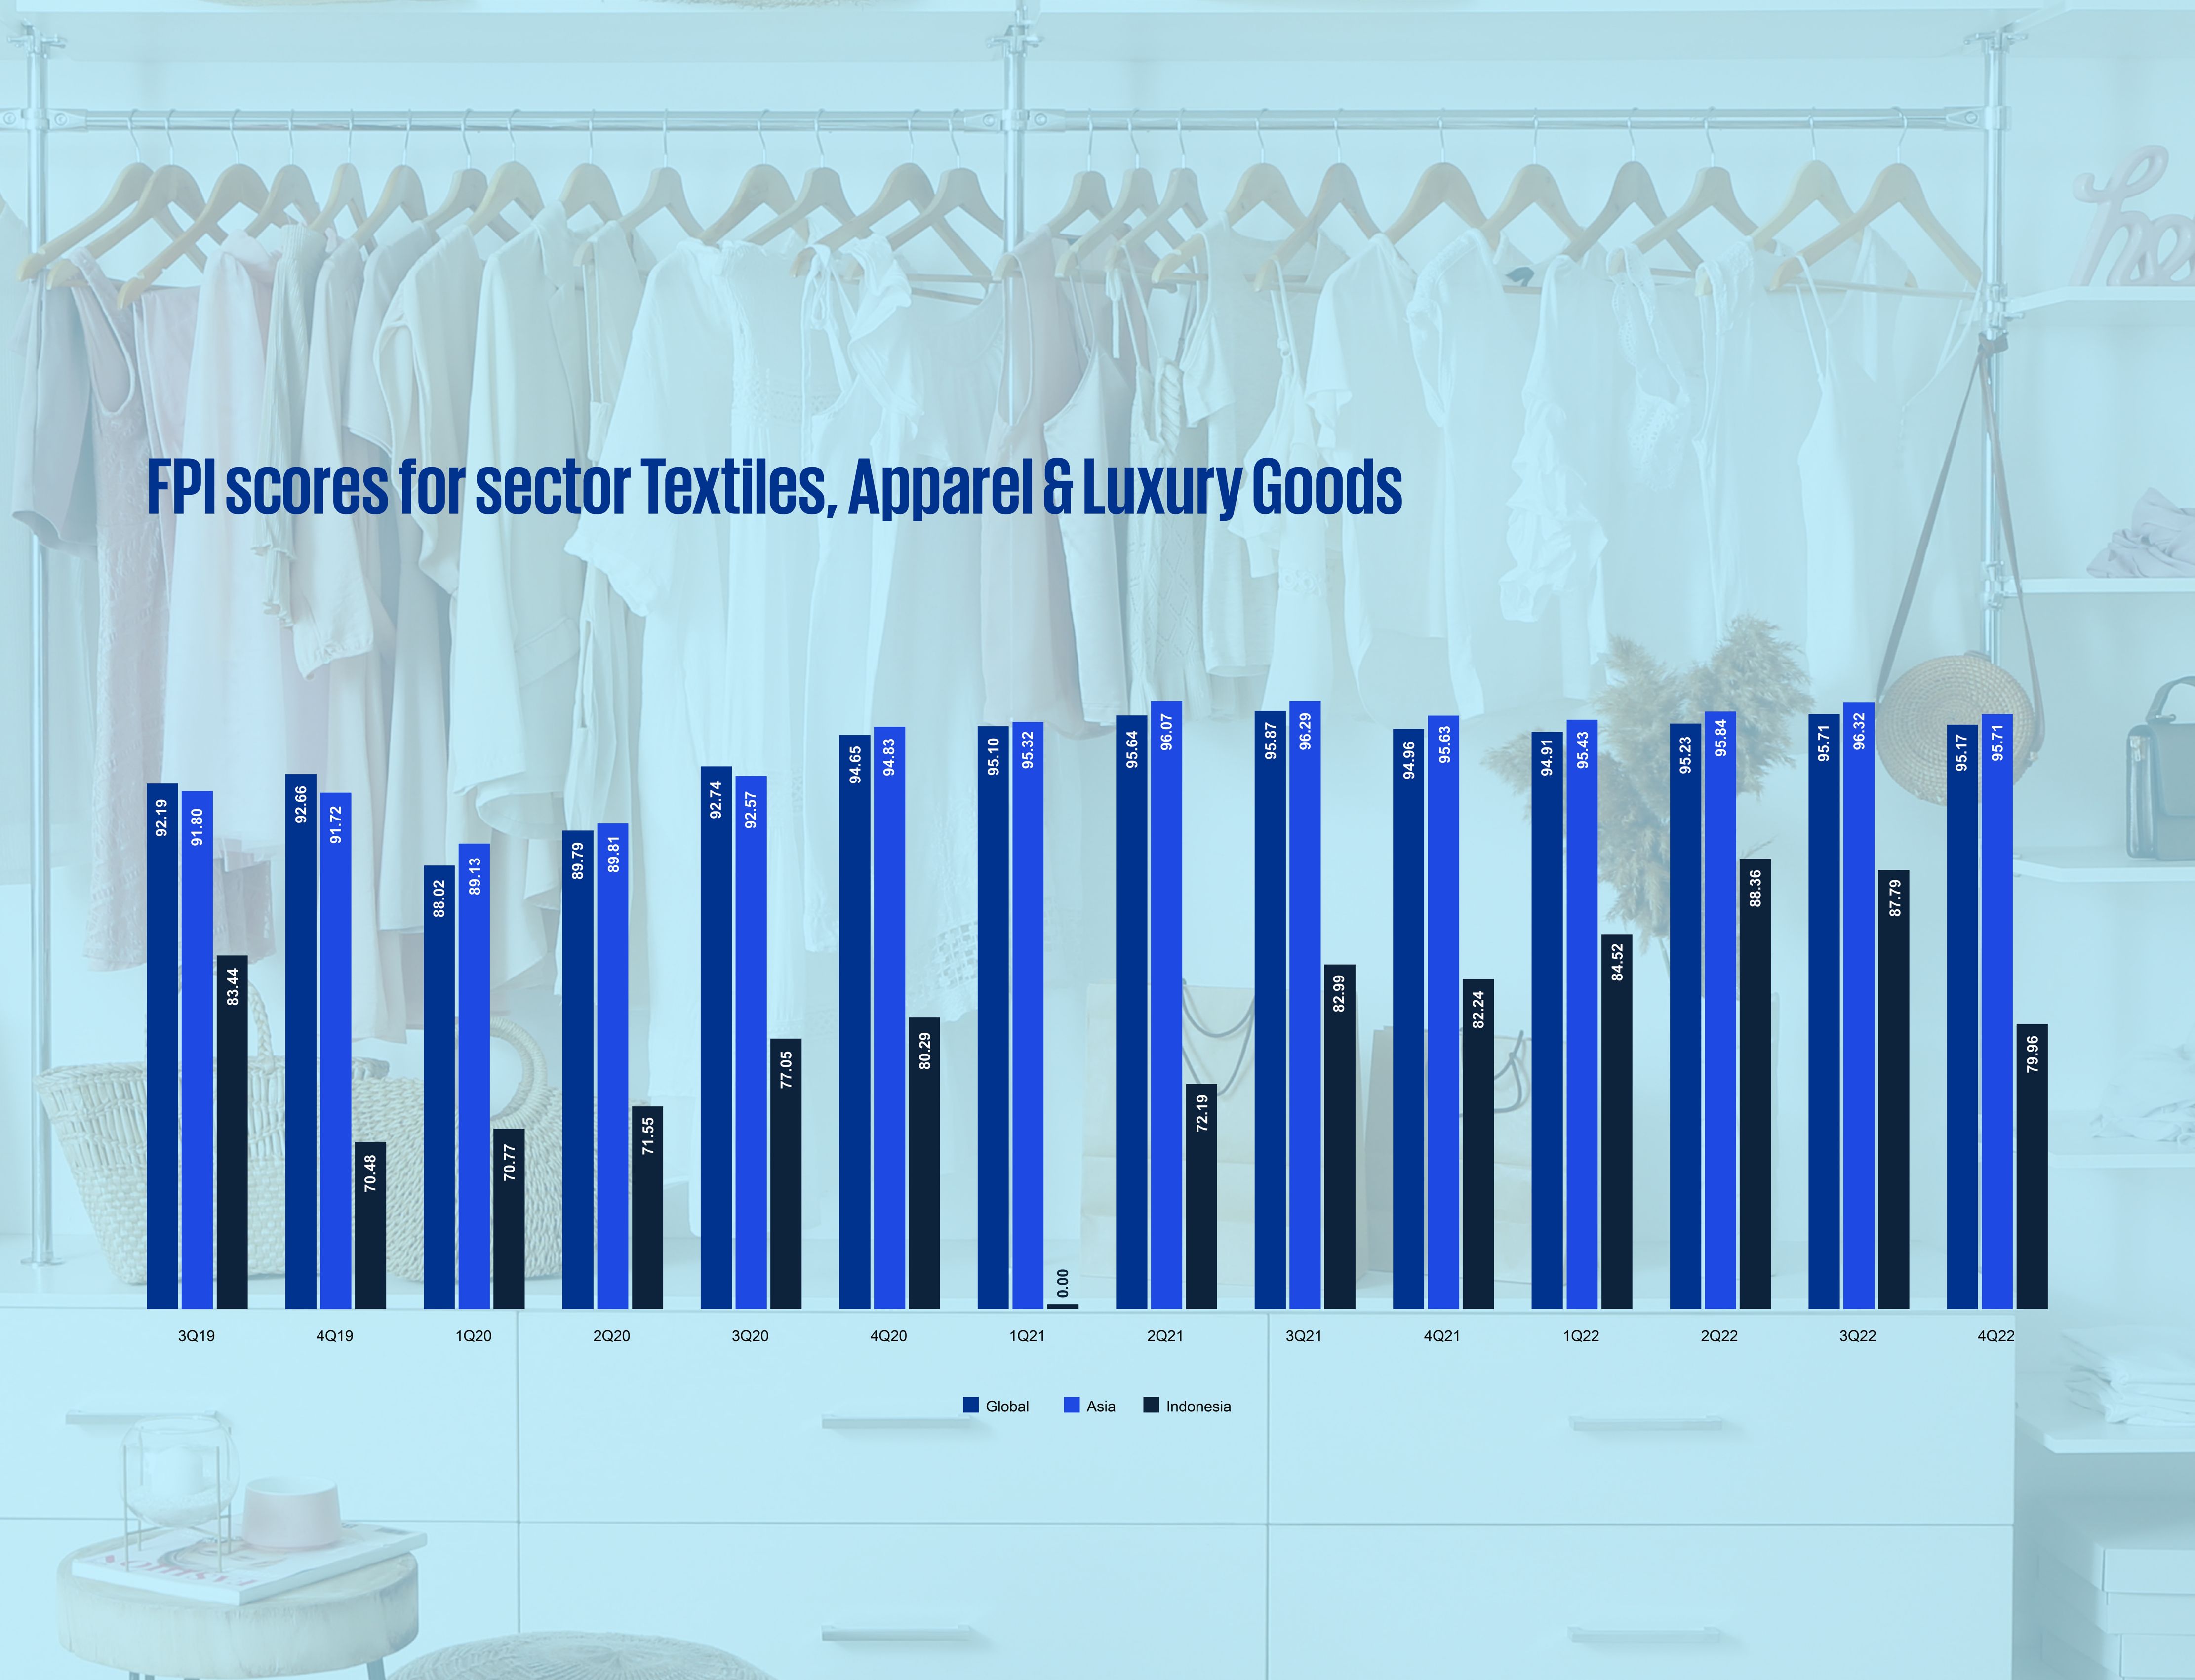
As mentioned above, FPI notes a significant decline (9 percent) in the 4Q22 FPI scores in the Textiles & Apparel sector. We have seen other large q-o-q decreases in the past four years (3Q19 to 4Q19 and 4Q20 to 1Q21), and each of these has preceded one of more large restructurings in Indonesia. Companies may wish to use this opportunity to ensure their finances and cash flows are sufficient, and banks and other creditors may want to take a deeper dive into its exposures in the sector to identify any potential issues as early as possible. Textiles was also the lowest rated sector as at the end of 4Q22 by almost 6 percent.
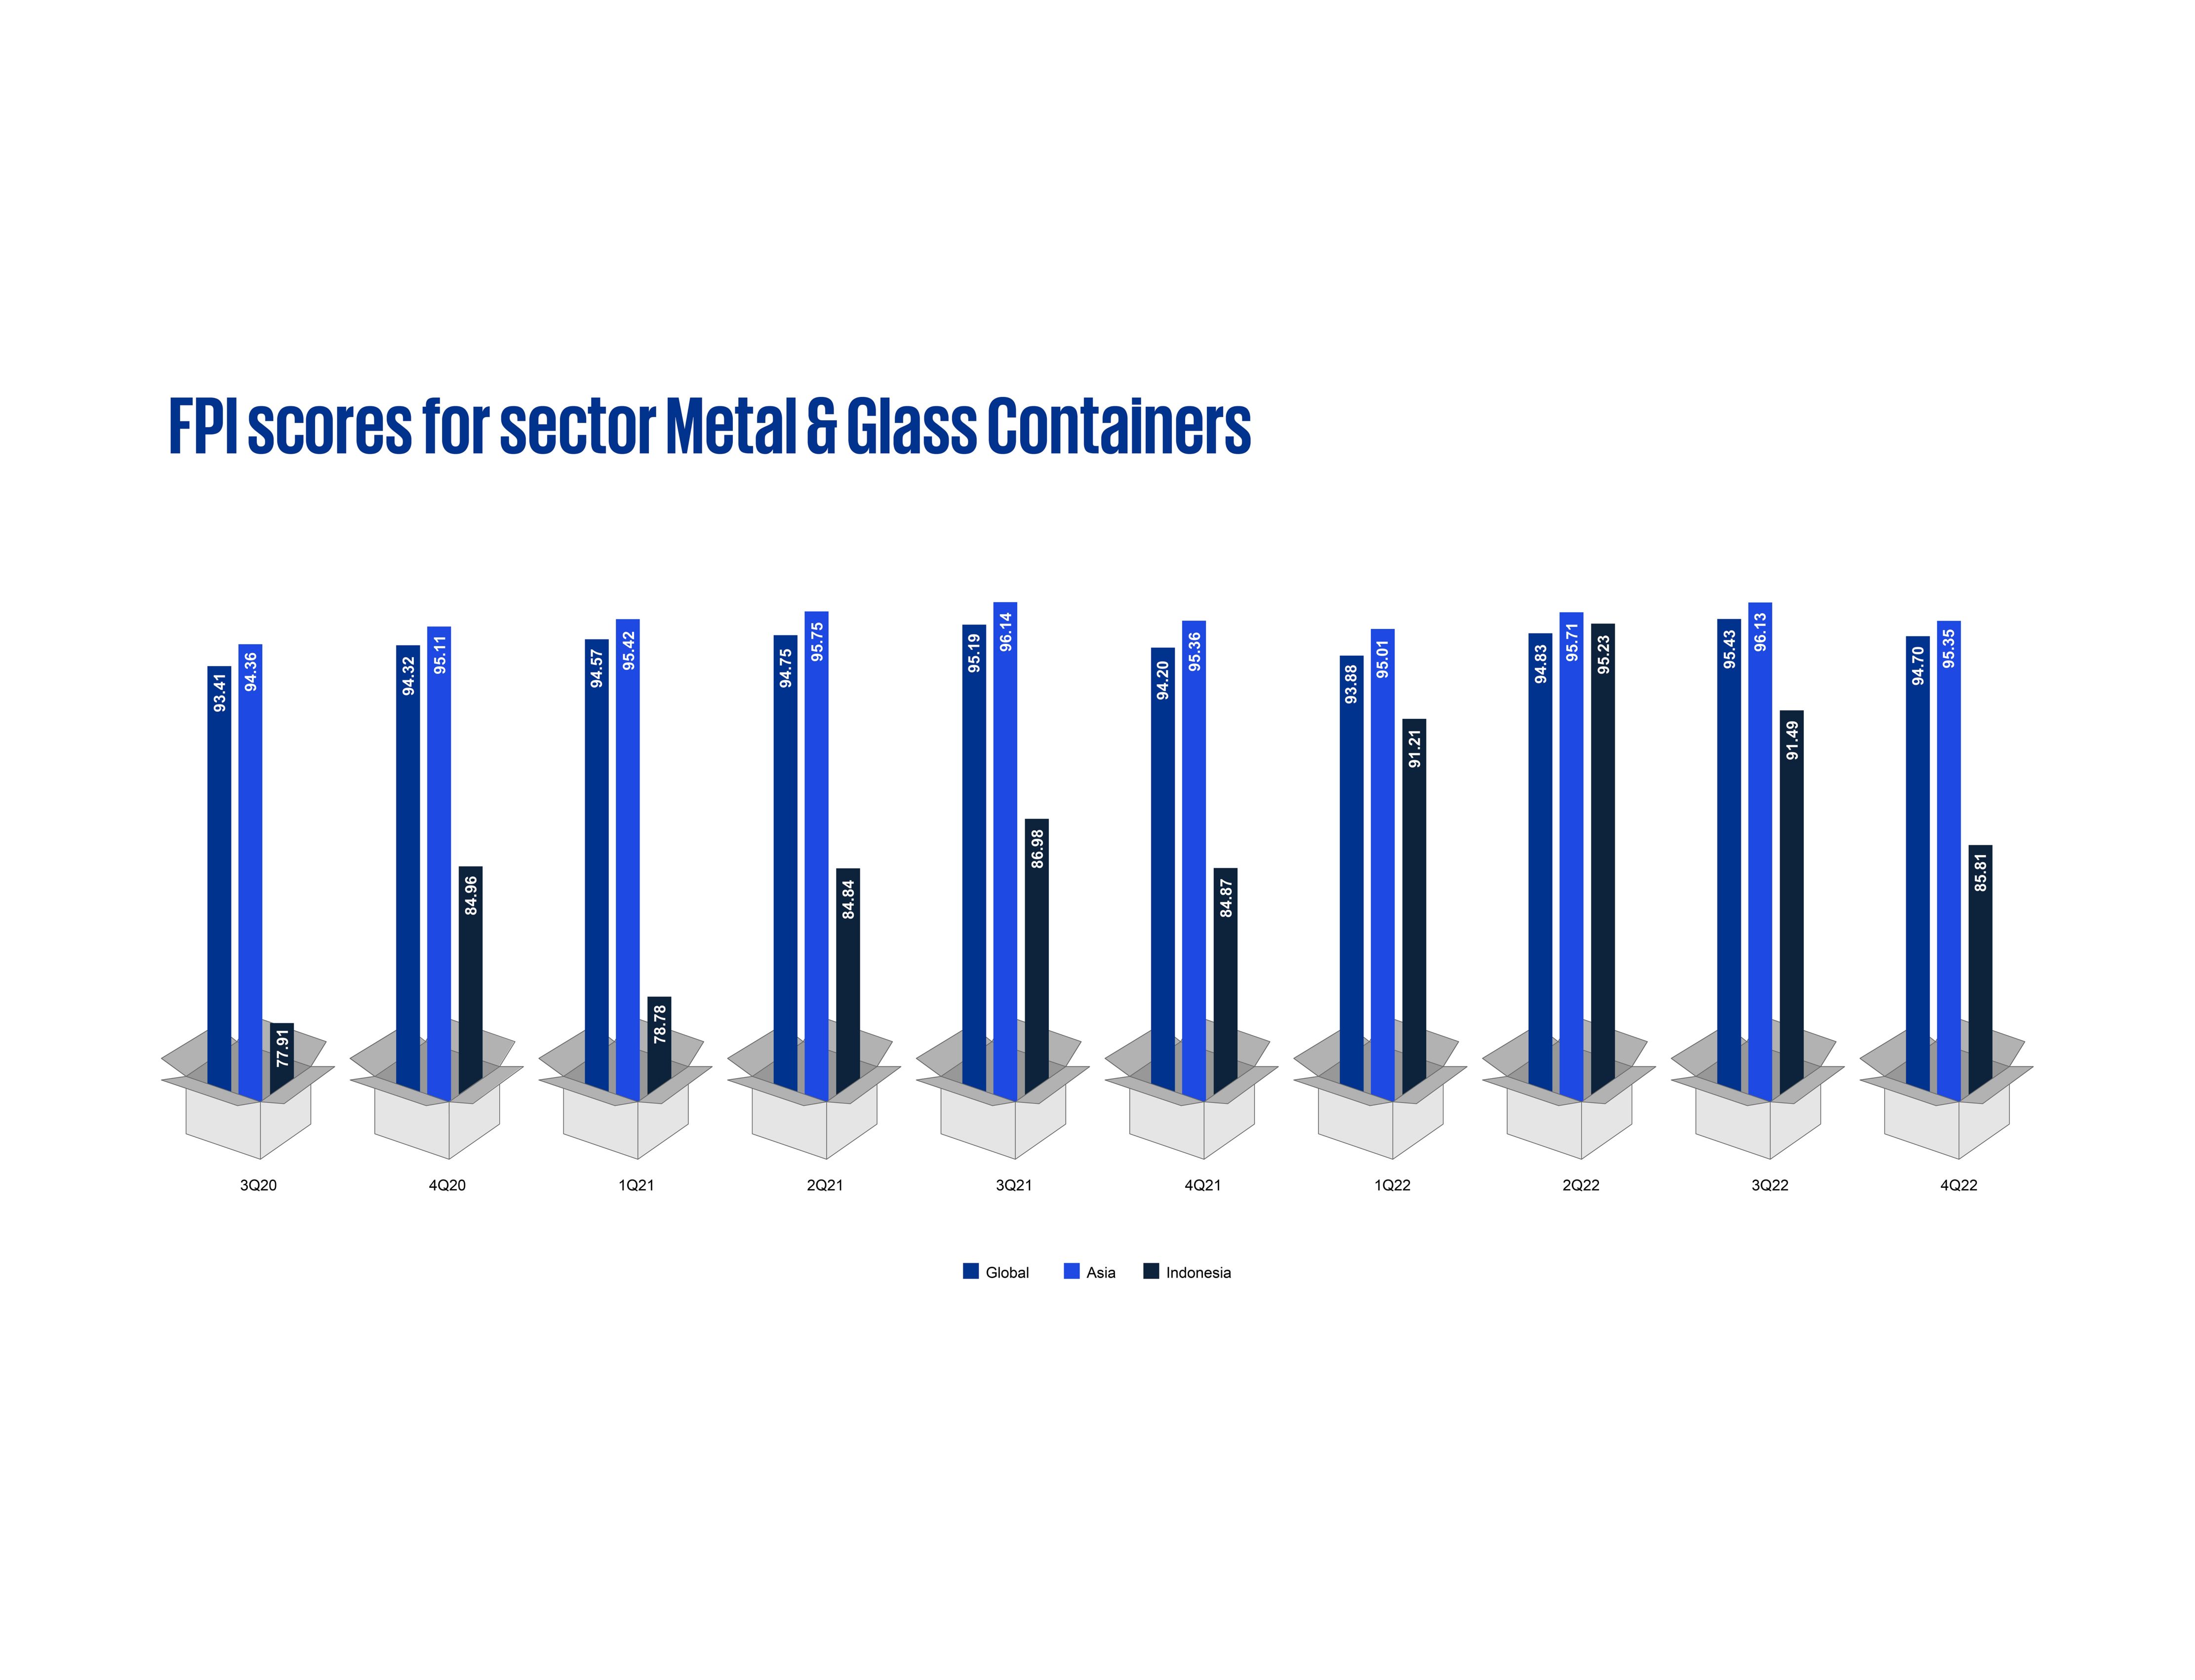
Metal & Glass Containers have been declining since its post-COVID peak in 2Q22, having dropped 9.5 percent in the second half of 2022. This makes it the third worst sector based on FPI score in Indonesia, trailing only Textiles and Advertising, which has consistently been in the mid-80s for the past seven quarters.
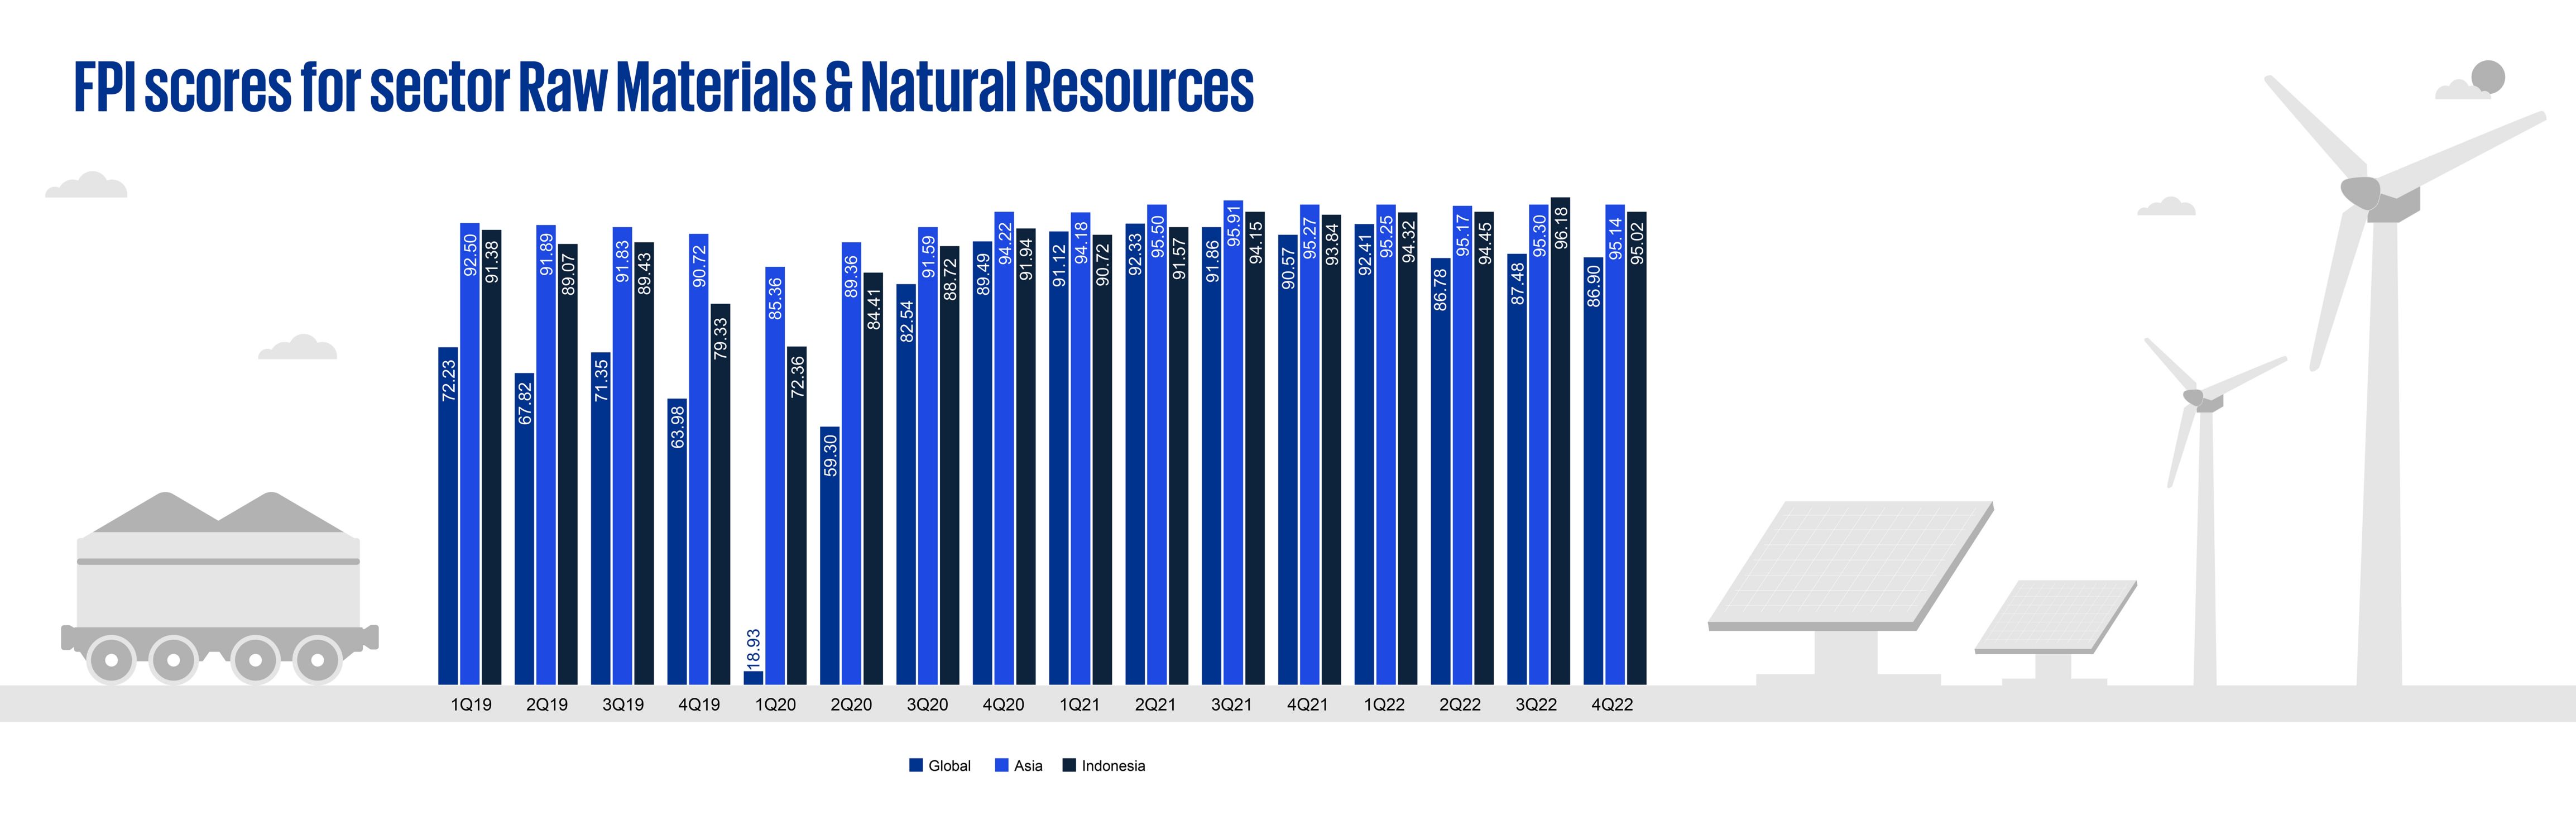
The worst performing sector based on FPI score for the Asia region was Raw Material & Natural Resources, with an FPI score of 86.9. However, in Indonesia, the FPI score was 95.0, which may reflect the different natural resources found in Indonesia compared to the rest of the region, predominantly coal where prices have reached record highs in 2022.
The Construction & Engineering subsector is experiencing headwinds in many markets globally. This is primarily due to the current interest rate environment, high relative USD, issues with raw materials and suppliers, plus global geopolitical uncertainties. When ranked in order of q-o-q percent change, of the 29 countries in our KPMG FPI analysis with sufficient Construction & Engineering companies to report a subsector, Indonesia ranks 25th and comes after China and before Bangladesh. The subsector globally has fallen by 1.6 percent across all 29 countries over this last quarter. In Asia, it has fallen 2.1 percent and of these, Indonesia has fallen almost more than any other at 4.3 percent. We expect the subsector to continue to fall further and will publish these results in our future reports.
About KPMG Financial Performance Index
The KPMG FPI distills a range of market and financial performance indicators into a single index covering nearly 34,000 public companies around the world.
The index scores companies on a scale of zero to 100, with zero indicating serious distress and 100 being best-performing.
Since many companies tend to perform well for most of their lifespans, there is a natural bias towards a higher quartile score. As such, around 80 percent of the companies in our index score between 85 and 99.
As the KPMG FPI is a logit1 model, a drop below the average can very quickly lead to an index score of zero.
When exploring this data, therefore, readers should consider:
- The absolute score (0 to 100)
- Comparisons across geographies
- Comparisons across sectors
- Relative performance against peers
- Trends over time
- Macro events which are driving trends
- Expected macro events which may affect future scores
Read more about our methodology
Want to see your company’s score?
To understand your company’s current index score, or to uncover deeper insights about specific markets or segments, contact your local KPMG member firm. KPMG’s global network of KPMG professionals have the data, sector and geographic expertise to help you understand your score and tie it back to your business needs. Whether it is benchmarking, identifying targets, comparing sectors or looking for trends over time, KPMG professionals can connect you right to the information you need to capitalize on your opportunities. That’s our business. Please contact us at in-fmkpmgfpi@kpmg.com to find out more.

Methodology
The Financial Performance Index (KPMG FPI) measures the financial health of individual companies. Based on a pool of more than 34,000 companies globally, KPMG FPI can identify those companies, sectors, regions, countries and territories that are performing well and those that are underperforming. A higher score on the KPMG FPI represents strong performance.
The KPMG FPI model draws from the Logit Probability to Financial Default model (developed by John Campbell, Jens Hilscher and Jan Szilagyi), which is based on eight explanatory variables encompassing financial and market variables, to arrive at the overall financial health of a company. The KPMG FPI is based on raw data from S&P Capital IQ database.
We release our insights publicly every quarter. However, the model can be run on any given day to reflect live market changes, so please reach out to your local KPMG member firm or contact us at in-fmkpmgfpi@kpmg.com if you would like additional information.