2019 Change Readiness Index Methodology
2019 Change Readiness Index Methodology
The 2019 CRI combines data from 25 primary survey questions, gathered from 1,400 specialists, with a secondary dataset of more than 125 variables.

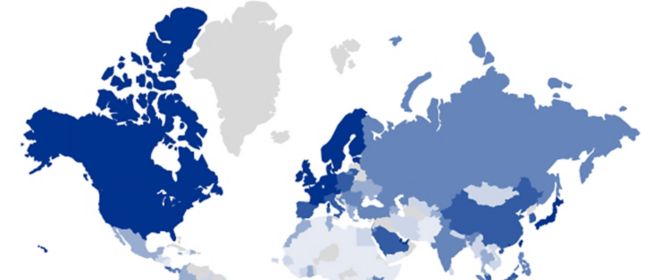
The Change Readiness Index (CRI) covers 140 countries including the 134 covered in the 2017 CRI plus a combination of additional developed and developing nations.
Country selection
The countries are distributed across a range of income levels. Countries included in this index were selected based on our ability to obtain sufficient or comparable primary and secondary data. The selection of countries provides a useful comparison between the change readiness of advanced and developing nations. Due to poor data availability, previously included countries Syria and Venezuela were not included in the 2019 CRI.
| Country income group | Economies according to GNI per capita | Number of countries (140) | Share in index sample (%) |
|---|---|---|---|
| High | >US$12,055 | 40 | 28.6 |
| Upper middle | US$3,896 - $12,054 | 37 | 26.4 |
| Lower middle | US$996 - $3,895 | 37 | 26.4 |
| Low | <US$995 | 26 | 18.6 |
Scoring methodology
The 2019 CRI is structured around three pillars (enterprise capability, government capability and people and civil society capability), with subindices for each pillar, and primary survey question responses and secondary data variables feeding each subindex score. The composite/overall change readiness score is comprised of equally weighted pillar scores, which are derived from equally weighted standardized subindex scores. Subindex scores are derived from standardized primary survey question responses and secondary data, with equal weighting given per variable, whether it is a primary survey question or secondary data indicator.
| Enterprise capability | Government capability | People & civil society capability |
|---|---|---|
| Relates to broad capability of private and state-owned enterprises | Relates to capability of governmental and public regulatory institutions | Relates to individual, societal and cultural determinants of capability |
| Labor markets | Macroeconomic framework | Human capital |
| Economic diversification | Public administration and state business relations | Entrepreneurship |
| Economic openness | Regulation | Civil society |
| Innovation and R&D | Fiscal and budgeting | Safety nets |
| Business environment | Rule of law | Technology use |
| Financial sector | Government strategic planning and horizon scanning | Gender |
| Transport and utilities infrastructure | Environment and sustainability | Inclusiveness of growth |
| Enterprise sustainability | Food and energy security | Demographics |
| Informal sector | Land rights | Access to information |
| Technology infrastructure | Security | Health |
In addition to the secondary data, between December 2018 and February 2019, Oxford Economics conducted a survey of 1,400 country specialists, with 25 survey questions, with a minimum of 10 specialists per country.
Primary survey experts
For the 2019 CRI, we surveyed individuals with at least 7 years of experience analyzing, studying or living in their reporting country. The individual had to have a good knowledge of economic policymaking, social structures and governance institutions in that country and was not currently employed directly by a government department in the country that directly influences and/or enforces policy making. A minimum of a tertiary-level educational qualification from an accredited university or vocational college degree program was required. Country experts came from a range of industries and sectors, where possible, including senior managers within the private sector, academia and trade unions.
Weighting
The CRI is a weighted average of primary (survey) and secondary (published) data. Overall the 2019 Index is weighted 21:79 for primary versus secondary data (25 primary questions and 126 secondary data series). The Index is a weighted average of 3 pillars, 30 sub-indexes, and 151 data points as follows:
- The CRI is aggregated from the three equally weighted pillar scores. It is in an average of the pillar scores.
- Each of the three pillars is an average of the 10 sub-indexes within the pillar, all of which have equal weighting.
- The sub-indexes are, where data is complete, an average of the data points contained within them. The number of individual indicators is different between the different sub-indexes - some have more data points in them than others.
- Where secondary data is incomplete, sub-indexes are calculated with a methodology which caps the weighting of the primary data, as set out in detail in Box 1.
Box 1; Dealing with Data Gaps Whilst the primary data is available for every country, secondary data is missing in some cases, with a large number of missing data in certain countries. At the sub pillar level we calculate the average score of the primary data, and the average score of the secondary data, and weight these two averages using the weighting that would be accorded to primary and secondary data in countries with a full data set. So for example if the pillar was meant to have 2 primary survey questions and 8 secondary data points, we would calculate the index with a 20% weighting for the primary questions average, and an 80% weighting for the secondary data average, which could be based on fewer than eight available data points. |
Each of the primary survey and secondary data values were transformed to a standardized scale between zero and one, facilitating the aggregation of the variables into sub-index, pillar, and composite scores. Standardization involves converting data to a common scale which can be aggregated. Standardization is calculated as set out in Box 2.
Box 2: Transformation of data into an Index. This is achieved by:
|
*All uses of the word ‘country’ or ‘countries’ in the 2019 Change Readiness Index (CRI) refers to both countries and jurisdictions. The term country is used for brevity.